XAU/USD Bullish Setup | Buying Zone to Upside TargetGold (XAU/USD) is reacting positively from a clearly defined strong buying area, indicating demand absorption after the recent decline. Price is attempting a low breakout, and sustained acceptance above this level may lead to a fake breakout scenario before continuation toward higher liquidity zones. If bullish momentum holds, the market could extend toward the final upside target near 4547, aligning with prior structure and liquidity objectives
Goldman_analysis

GOLD HP LONGS LP SHORTSgold now at crucial weekly hasnt make a fva and fvg so its respecting monthly high magenta line(M) and daily lq sweep poi is much below orange dot, cureently daily fvg in respect with lq on daily and m15 shifted bullish int. if h4 bearish fvg hold and pdl close big fall coming, if m15 continue bullish and pdh close massive up again ath ,
follow for more updates

GoldXAUUSD
- Completed " 123 " Impulsive Waves
- Break of Structure
- RSI - Divergence
- Bullish Channel as an corrective pattern in Short Time Frame
- Change of Characteristics

GoldXAUUSD
- Order Block
- Bullish Channel as an corrective pattern in Short Time Frame
- Break of Structure
- Completed " 1234 " Impulsive Waves
- Fair Value Gap

Gold is eerily quiet; there are a few things to consider.Gold Price Analysis for Next Monday: From a technical perspective, after gold broke through the high last Thursday, it has retreated back into a range-bound oscillation. The key resistance level remains around 4355. Although the bulls touched this level, they ultimately failed to hold above it. This false breakout could lead to a significant pullback by the bears. Furthermore, the daily chart shows a repeated sideways consolidation pattern at high levels. Prolonged periods of consolidation without a breakout also carry the risk of a pullback. The longer the consolidation lasts, the greater the accumulated pressure. Our strategy of shorting around 4345-4355, which we emphasized this week, proved effective yesterday, reaching exactly 4355 before encountering resistance and closing around 4338. Therefore, next week, gold prices are expected to be under pressure, with at least three attempts to break through the 4355 level proving successful. The downside target remains around 4270-4260.
Yesterday, the gold market exhibited a typical consolidation pattern, with a sharp short-term drop followed by a rapid rebound. Today, the market has become more stable, with significantly narrower price fluctuations, entering a consolidation phase. The daily Relative Strength Index (RSI) has fallen from the overbought zone, suggesting that bullish momentum is weakening in the short term. Currently, the gold price closed below the key level of $4350/oz, putting pressure on the short-term trend. Initial support can be seen at the psychological level of $4300/oz. In the absence of new macroeconomic data or events, the upward momentum of gold prices is indeed insufficient. Next week's trading strategy is as follows: Pay close attention to the resistance level of $4355. This level can be used as a key reference for tentative short positions. However, given the strong performance of silver, if the key resistance is broken strongly, the strategy should be adjusted promptly. If the gold price confirms a weakening trend, the support level around the psychological level of $4300 can be used as a reference for long positions. Overall, regardless of whether you are holding a long or short position, strict stop-loss orders must be set.

GOLD 4H CHART ROUTE MAPDEAR TRADERS,
Our Previous 1H Chart & 4H Chart has been completed well and all profit hits successfully.
Gold has broken its previous high today and made history by printing a new All-Time High (ATH).
We will now wait for a healthy pullback and retest at the key support zone.
Entry Zone: 4375 – 4385
Bullish Targets:
4419 • 4444 • 4459 • 4480
Bearish Targets:
4380 • 4327 • 4300 • 4270
As we are in the month of December and the festive season is approaching, this week is packed with high-impact news on the forex calendar. Unexpected volatility is highly possible. Please trade with caution, discipline, and proper risk management.
Your support means a lot—please show it with likes, comments, and boosting 🙌
— The Quantum Trading Mastery

Fibonacci Time Zone supported (( Best Buying Point ))This chart anticipates the next optimal buying opportunities by integrating Fibonacci Time Zone analysis with money flow sell cycles and wave structures. The study is characterized by a high degree of precision and temporal accuracy.
a personal vision and not trading signal or advise

GoldXAUUSD
- Rising Wedge as an corrective pattern in Short Time Frame
- Break of Structure
- Consolidation Phase
- Completed " 12345 " Impulsive Waves and " AB " Corrective Waves
- RSI - Divergence

GoldXAUUSD
- Completed " 12345 " Impulsive Waves
- Consolidation Phase in Long Time Frame
- RSI - Divergence
- Bullish Channel as an corrective pattern in Short Time Frame
- S / R Level

GOLD 4H Chart AnalysisDear Traders – 8 Dec 2025
Please review the updated 4H chart.
Since the start of December 2025, GOLD has been repeatedly testing key levels, with an upside gap near 4262 and a downside gap near 4164. Price is likely to continue testing both sides until one of these levels breaks, confirming the next directional move and range.
On the 4H timeframe, the double bullish symmetrical triangle has broken to the upside, which is a clear bullish signal. However, there is still a possibility of one more retest toward the lower level around 4135 – 4165 zone and potentially to the retracement zone.
If a candle closes and holds below the ifvg zone around at 4135, we could see a deeper retracement toward the 4000 – 4044 area.
IMPORTANT:
This week's news calendar is packed with high impact events. Please be cautious with your trades and positions, as the market are expected to be volatile across the board.
Keep this in mind when looking for buy entries from dips. The updated chart will help you monitor any downward move and catch the potential bullish bounce.
Bullish Targets: 4244, 4278, 4328
Bearish Targets: 4135, 4044

the reset of Gold April.2026As in nearly every other market, the period between June and September represents the next attractive buying opportunity, following a decline from around the 5,000 level to whatever base ultimately forms, driven by the onset of a new, broad-based accumulation and buying phase across all markets.

XAU/USD Bullish Outlook - Strategic Entry & Exit Plan🟡💰 XAU/USD — “Gold Rush or Police Trap?” ⚡ Thief Strategy Playbook 🎯
Asset: XAU/USD “Gold vs U.S. Dollar”
Market Type: Crypto / Metals Cross (Swing / Day Trade)
Bias: Bullish 🟢
🔓 Thief’s Entry Game Plan (Layer Method)
This isn’t your typical sniper-entry… this is the Thief Strategy™ — a layering style method using multiple limit orders for flexible accumulation.
💎 Layer Entries:
4000.00 ✅
4025.00 ✅
4050.00 ✅
(You can increase or adjust the layers based on your risk appetite & setup.)
🛡️ Stop Loss (Thief’s SL): @3950.00
“Dear Ladies & Gentlemen (Thief OG’s) — I’m not recommending my SL; it’s just my escape route.
Trade smart, take your profits, and move at your own risk.”
🎯 Target Zone — “Police Barricade Ahead 🚨”
The 4200.00 zone acts as a strong resistance + potential trap area — heavy liquidity and overbought conditions live there.
Be wise, secure the bag 💼, and slip out before the market cops show up.
📊 Key Technical Notes
Momentum shows gold buyers reclaiming upper zones after liquidity grabs.
Higher-timeframe structure: Still bullish unless 3950.00 breaks cleanly.
RSI divergence & volume spike hint at layered re-accumulation potential.
🔗 Related Pairs to Watch & Correlations
💵 TVC:DXY — Inverse correlation; stronger dollar → gold pullback risk.
BITSTAMP:BTCUSD — Occasionally follows gold sentiment under risk-off conditions.
💹 TVC:SILVER (XAGUSD) — Often moves in tandem; can confirm metal-sector strength.
💱 FX:USDJPY — Watch for safe-haven flows; yen strength = gold demand uptick.
⚙️ Market Sentiment (London Session Focus)
📈 Bullish tone continuing through European hours.
🔍 Institutions layering bids near 4000–4050 liquidity pocket.
⏱ Short-term pullbacks expected before breakout continuation.
✨ “If you find value in my analysis, a 👍 and 🚀 boost is much appreciated — it helps me share more setups with the community!”
📜 Disclaimer:
This is a Thief-style trading strategy — just for fun & educational purposes only.
Not financial advice. Trade responsibly — steal profits, not peace. 🕶️
#XAUUSD #Gold #ThiefTrader #SwingTrade #LayerEntry #Forex #DayTrading #TechnicalAnalysis #MarketStrategy #GoldTrading #XAU #PriceAction #SmartMoney #LondonSession #TradingViewIdeas

GoldXAUUSD
- Fibonacci Level - 361.80%
- Fair Value Gap
- Completed " 123 " Impulsive Waves
- Break of Structure
- Symmetrical Triangle as an corrective pattern in Long Time Frame

GoldXAUUSD
- Completed " 12345 " Impulsive Waves and " ABC " Corrective Waves
- Change of Characteristics
- Break of Structure
- Consolidation Phase as an corrective pattern in Short Time Frame
- Order Block

GoldXAUUSD
- Completed " 1234 " Impulsive Waves
- Break of Structure
- RSI - Divergence
- Change of Characteristics
- Fibonacci Level - 38.20% / 50.00%

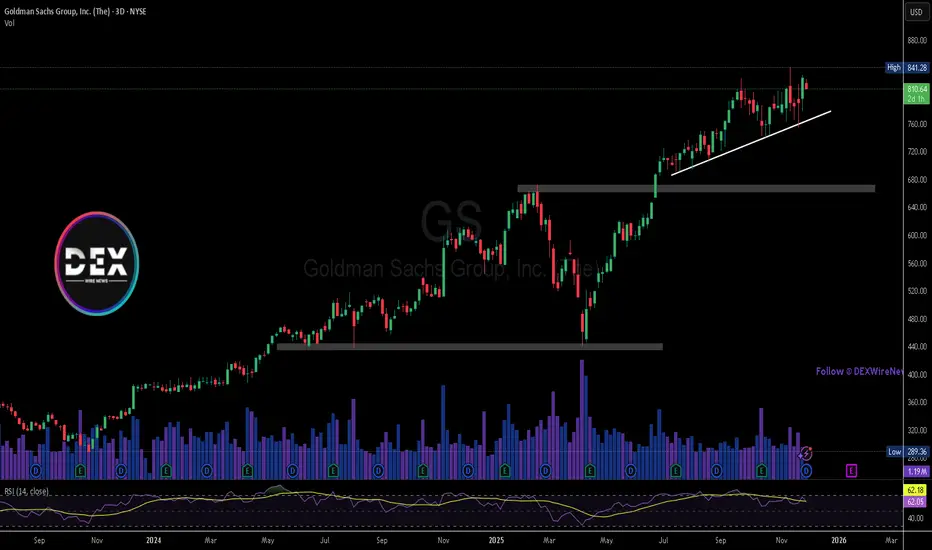
Goldman Sachs (NYSE: $GS) : $2B Innovator Deal Boosts ETF PowerGoldman Sachs (NYSE: NYSE:GS ) is taking a major leap in the fast-growing ETF market with its $2 billion acquisition of Innovator Capital Management. The deal brings in a powerful lineup of 161 U.S.-listed ETFs managing nearly $30 billion in assets, instantly strengthening Goldman’s position in defined outcome products—one of the hottest ETF segments today. Innovator is widely recognized for pioneering “buffer” ETFs, which use options to offer downside protection in exchange for capped upside. These strategies have surged in popularity as investors seek structured, rules-based approaches to managing risk.
Innovator’s products carry a median expense ratio of 0.79%, translating to roughly $237 million in annual revenue at current AUM levels. Beyond U.S. equities, its strategies span various indexes and asset classes, giving Goldman broader reach and deeper ETF diversification. Before the acquisition, Goldman ranked 18th among U.S. ETF issuers with $51.4 billion in assets. Combined with Innovator, it climbs to 16th place—leapfrogging Global X and Direxion. Still, joining the top 10 will require significantly more scale.
CEO David Solomon highlighted the accelerating growth of active ETFs, noting their role in reshaping public markets. Although defined outcome ETFs are technically active, they operate as disciplined, systematic strategies, making them attractive to investors seeking predictable payoff structures.
Technical analysis
Goldman Sachs stock remains firmly bullish. Price action continues to respect an ascending trendline established after breaking a key resistance level. The next major resistance sits near $841, the previous high. As long as the trendline holds, GS maintains strong upside momentum, with the trendline itself acting as dynamic support.
GoldXAUUSD
- Consolidation Phase in Long Time Frame
- Impulse Correction
- Completed " 12345 " Impulsive Waves and " AB " Corrective Waves
- Break of Structure
- Bullish Channel as an correction in Short Time Frame

GOLD 1H Chart Technical AnalysisDear Traders,
Please also consider the important news events on the economic calendar, as they may significantly impact market volatility and price movement.
We are currently observing price consolidating between two key weighted levels, with an upside gap at 4156 and a downside gap at 4040. To identify the next directional range, we need to focus on these 2 scenario marked.
Price may continue to move sideways and retest these zones until one of the weighted levels decisively breaks and locks, which will confirm the direction for the next market leg. Refer to the arrows marked on the 1H timeframe, which highlight the two potential scenarios and assist with accurate entry timing.
Scenario 1 – Bullish Continuation
If price breaks the resistance and locks above 4155, we anticipate a continuation toward higher targets 4193 & 4233, supported by the bullish structure.
Scenario 2 – Support Test & Bounce
If price fails to lock above resistance, we expect a retracement toward the lower support zones at 4100 & 4060 for a potential support test and bounce.
We will keep both scenarios in mind as we continue taking buy entries from dips. Our updated weighted levels and structural zones will help us track any downward movement and position ourselves to capture upward bounces effectively.
As always, we will continue executing our dip-buying strategy, targeting 20–40 pips per entry. Each structural level consistently provides a 30–50 pip bounce, offering clean, high-probability entry and exit opportunities.
The Quantum Trading Mastery

GoldXAUUSD
- Completed " 12345 " Impulsive Waves
- Change of Characteristics
- Bullish Channel as an corrective pattern in Short Time Frame and Long Time Frame
- Order Block
- Fibonacci Level - 78.60%

GoldXAUUSD
- Rising Wedge as an corrective pattern in Long Time Frame
- Change of Characteristics
- Completed " 12345 " Impulsive Waves
- Fibonacci Level - 38.20% / 50.00%
- Consolidation Phase

GoldXAUUSD
- Change of Characteristics
- Fair Value Gap
- Fibonacci Level - 61.80% / 78.60%
- Bullish Channel as an corrective pattern in Short Time Frame
- Order Block

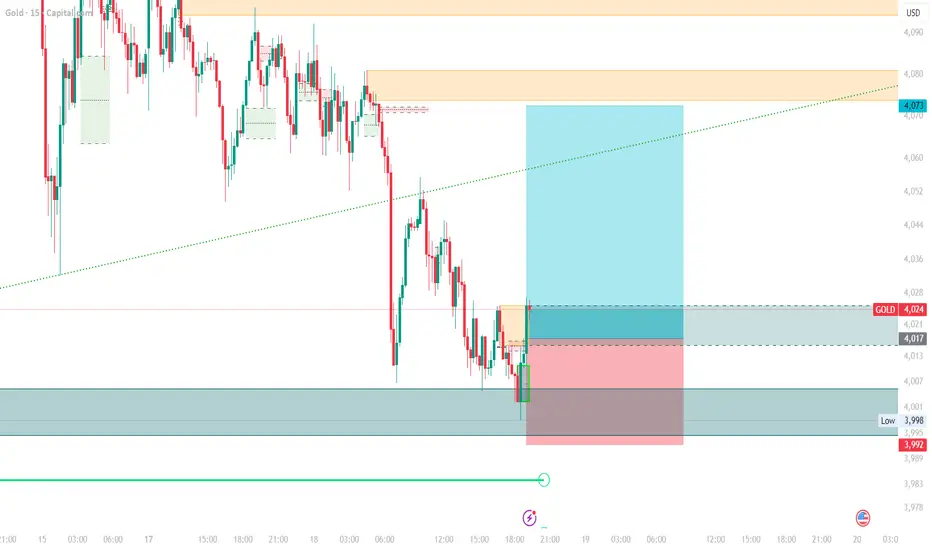
GOLD 15 CHART Dear Traders,
Gold has been testing lower levels since yesterday and has now shown multiple confluences confirming a potential long setup on the 15-minute chart. Please trade cautiously and maintain strict risk management.
Quantum Trader
Is a gold price collapse signaling the end of the bull market?Today's market is likely to continue its downward trend. The strategy should be to sell on rallies. The primary focus is on the 4200 level, a key support/resistance level. If the downward trend continues, short positions can be initiated near 4200, with an initial target of 4145 and a further target of the key support at 4100. Only a decisive break below 4100 would confirm the formation of a secondary high. If the rebound holds above 4200, be wary of a large-scale market correction. Short-term resistance is around 4210; a break below this level would target yesterday's high, with the possibility of a second test to confirm the secondary high. Today's market is prone to surprises. While the technicals suggest a continuation of the downward trend, sudden fluctuations should be monitored. Initial resistance is around 4100; a short position can be initiated if it holds. Further upside targets are 4230-4240, where short positions can be initiated. Support is around 4100; a long position can be initiated if it holds.
