GoldXAUUSD
- Completed " 12345 " Impulsive Waves
- Change of Characteristics
- Bullish Channel as an corrective pattern in Short Time Frame and Long Time Frame
- Order Block
- Fibonacci Level - 78.60%
Goldmansachs

GoldXAUUSD
- Rising Wedge as an corrective pattern in Long Time Frame
- Change of Characteristics
- Completed " 12345 " Impulsive Waves
- Fibonacci Level - 38.20% / 50.00%
- Consolidation Phase

Market outlook and investment strategy: I am bullish.#XAUUSD TVC:GOLD OANDA:XAUUSD
Judging from the structural trend and the performance of gold in different timeframes, gold has formed a short-term double bottom structure based on the trend line, and the prototype of the W pattern is gradually emerging.
Although the price retreated slightly after touching the channel resistance level around 4160 in the evening, it did not break the current upward structure, and the market is still dominated by bulls. Meanwhile, influenced by multiple positive factors such as geopolitical uncertainties and rising market speculation about a December rate cut, gold still has the potential for further gains.
Therefore, based on the current trend structure and fundamental logic, in the future trading process, we can first pay attention to the short-term resistance of 4170-4180, which is a key resistance under the triangle consolidation pattern. When it first touches this level, we can try to short gold with a small position and set the stop loss above 4185 to prevent the risk of a strong bullish breakout.
Meanwhile, if this strategy is effective, we need to pay attention to the subsequent rebound after the gold price falls back and stabilizes, which will help confirm the completion of the W pattern. At that time, we will focus on the breakout of the neckline at 4200-4205. If it can stabilize above this level, the upside potential will be further opened up, and it may extend to 4240-4245, or even higher!
In summary, our trading strategy must closely follow the confirmation signals of the trend structure. Therefore, it is essential to strictly control position size and stop-loss. We will continue to monitor market dynamics and optimize our trading strategy accordingly.

GoldXAUUSD
- Change of Characteristics
- Completed " 1234 " Impulsive Waves
- Break of Structure
- Bullish Channel as an corrective pattern in Short Time Frame
- Order Block

Bulls remain clearly bullish on gold.#XAUUSD OANDA:XAUUSD TVC:GOLD
Good morning. Gold prices surged yesterday due to external stimuli, and this trend continued today, reaching a high of around 4155. From a daily chart perspective, gold prices remain above the 5-day and 10-day moving averages. Considering the unstable geopolitical situation and the increased probability of an interest rate cut in December, as long as prices do not fall below 4100, the bullish trend will continue. Consider going long on gold if it pulls back to 4125-4115.

GoldXAUUSD
- Change of Characteristics
- Fair Value Gap
- Fibonacci Level - 61.80% / 78.60%
- Bullish Channel as an corrective pattern in Short Time Frame
- Order Block

How to choose a direction at the end of a triangular formation#XAUUSD TVC:GOLD OANDA:XAUUSD
Although gold is still in a volatile market in the short term, its current trend has entered the end of a converging triangle pattern, and the market is getting closer to choosing a direction.
The market has recently been driven primarily by news, and the current geopolitical tensions, coupled with the stalled Russia-Ukraine peace talks, may trigger a new wave of risk aversion. Therefore, during the European session, we can consider going long on gold when it retraces to the 4040-4030 range.

XAU/USD) Bullish trend analysis Read The captionSMC Trading point update
Technical analysis of breakdown of your analysis idea based on the chart you provided (XAUUSD – 4H):
---
Chart Overview
Symbol: Gold Spot (XAUUSD)
Timeframe: 4H
Indicators used: EMA 50 (blue), EMA 200 (black)
Current price: ~4095.58
Key support zone: 4060 – 4075 region
Target: 4125 – 4130
---
Idea Explanation
1. Market Structure
Price has recently broken upward strongly from the EMA50 zone.
Expectation: A retracement back into the Demand Zone (blue region).
Fibonacci levels shown: 0.5 / 0.618 / 0.705 / 0.786
Expected retracement point appears around 4070–4065.
2. Trade Plan
Bullish Scenario
Wait for price to retrace into the Demand Zone
Look for confirmations (rejection candle, BOS, liquidity sweep)
Enter long position between 4075 – 4065
SL likely beneath 4050–4045
TP area 4125 – 4130
3. Liquidity Concept
Chart shows a liquidity grab (sweep) below previous lows inside the demand zone
After sweep → expectation of impulsive move upward
---
Target & Risk Management
Entry Stop Loss Take Profit R:R
4075–4065 4045 4125–4130 approx 1:3 – 1:4
---
Summary
Bias: Bullish continuation
Strategy: Retracement to demand + Fibonacci confluence + EMA support
Target aligned with next significant high & liquidity area
Mr SMC Trading point
---
My Personal Insight
This setup is clean and valid. The key will be waiting for price to confirm rejection in the zone. If news volatility pushes price deeper, 4060–4050 is strong institutional level.
---
please support boost 🚀 this analysis

XAU/USD) Bullish trend analysis Read The captionSMC Trading point update
Technical analysis of (XAUUSD) – Bullish Reversal Setup from Demand Zone
1. Key Zone: Strong Demand / Rejection Area
Price has reacted multiple times inside the blue demand zone (around 4040–4035).
This zone aligns with Fibonacci levels (0.705–0.79), strengthening the bullish probability.
Each touch shows buyers stepping in (long wicks + strong rejections).
2. Falling Wedge Breakout
A falling wedge pattern has been broken to the upside.
Price retested the wedge but dropped again to retest deeper inside the demand zone.
A bullish continuation is expected after one more dip into the zone (green arrow).
3. EMAs: Bullish Confluence
EMA 50 and EMA 200 are close, tightening and suggesting a potential trend shift.
Price is expected to bounce off the demand zone and climb above EMAs.
4. Projected Move
After tapping the demand zone, price is expected to:
Break above recent structure highs
Build bullish momentum toward the target point: 4,143.06
SMC Trading point
5. Overall Idea
This setup indicates a bullish continuation forming after a correction.
The blue zone is the high-probability buy zone, and the projected path suggests a move toward 4143 after confirmation.
---
please support boost 🚀 this analysis

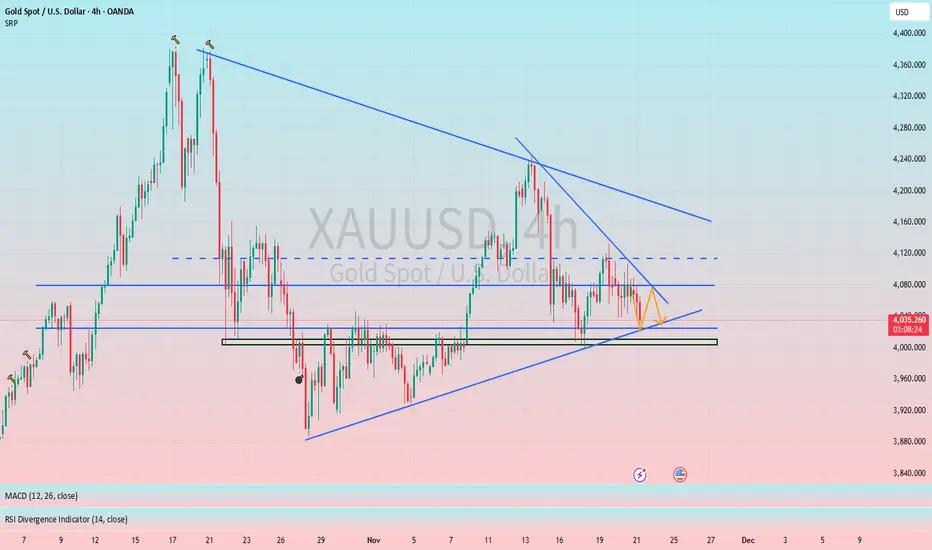
Breakout from a triangle pattern indicates a potential direction#XAUUSD OANDA:XAUUSD TVC:GOLD
From a trend perspective, gold is currently in a triangle consolidation range. As time goes on, the short-term resistance is also moving downwards. Therefore, gold did not provide us with a suitable opportunity to participate in trading last night. Gold is currently continuing its decline and may further test the 4025-4015 support level. If it pulls back to this level, we can consider a small long position in gold.
Gold Price Outlook – Trade Setup (XAU/USD)📊 Technical Structure
TVC:GOLD Gold (XAU/USD) is trading near $4,075, struggling to gain traction after a sharp intraday recovery. Price remains capped by the resistance zone at $4,081–$4,086, while intraday support is seen between $4,041–$4,045.
The structure currently favours a short-term bearish reaction, with price showing repeated rejection at the resistance zone. A break below $4,060 could accelerate downside momentum toward the support zone, while any sustained push above $4,093 would invalidate the bearish bias.
🎯 Trade Setup
Idea: Sell from resistance zone targeting retest of support.
Entry: $4,081 – $4,086
Stop Loss: $4,094
Take Profit 1: $4,045
Take Profit 2: $4,041
Risk–Reward Ratio: ≈ 1 : 3.4
Bias turns bullish only if price closes above $4,093.
🌐 Macro Background
Gold trades above $4,100 ahead of the delayed US September NFP report, which was pushed back due to the 43-day government shutdown, the longest in U.S. history.
FXStreet notes that:
“Gold edges higher to near $4,110 as uncertainty over US jobs data and cautious sentiment support safe-haven demand.” 【FXStreet】
NFP Impact:
A weaker-than-expected jobs report would likely revive expectations for a December rate cut, boosting gold through lower yields and a softer USD.
Fed Divisions:
The FOMC Minutes showed policymakers divided—some supporting further cuts, others opposing another move in December.
Market Pricing:
The CME FedWatch Tool shows only a 30% probability of a December rate cut, sharply lower than nearly 60% last week, limiting gold’s upside.
Overall, gold’s upside remains constrained by shifting rate expectations, but uncertainty around delayed data continues to provide safe-haven support.
🔑 Key Technical Levels
Resistance: $4,081 – $4,086
Support: $4,041 – $4,045
Psychological Level: $4,100
📌 Trade Summary
Gold remains trapped between resistance at $4,081–$4,086 and support at $4,041–$4,045. Price is showing rejection at resistance, favouring a short-term bearish pullback.
Downside targets lie at $4,045 and $4,041, unless incoming NFP data triggers renewed bullish momentum.
⚠️ Disclaimer
This analysis is for reference only and does not constitute trading advice. Trading involves significant risk, and proper risk management is essential.

An upward trend line has formed,be wary of a breakout above 4100#XAUUSD TVC:GOLD OANDA:XAUUSD
The intraday short limit order has been closed with profit, but there is still some room for a short-term pullback. The hourly chart shows an upward trend line below, with the 4H middle line converging with the MA5 and MA10 moving averages around 4077. The hourly moving averages also point to around 4077, which is also a previous area of dense trading volume, and may provide some support in the short term. Therefore, if gold prices pull back to 4082-4077 during the European session, I think we can try to go long on gold with a small position.

Gold Short-Term Rally – Potential to Continue Upside📊 Market Update:
Gold is currently trading around USD 4,078/oz, up from the 4,072 support zone due to short-term buying and weaker USD. Recent US economic news hasn’t been strong enough to halt the short-term uptrend.
📉 Technical Analysis:
• Key resistance: USD 4,085 4.088
• Additional resistance: USD 4.095
• Nearest support: USD 4.072 4.074
• Additional support: USD 4.065
• EMA 09: Price is above EMA 09 → short-term bullish bias continues.
• Candlestick/momentum: Strong bullish candle with high volume → confirms buying pressure dominance.
📌 Outlook:
Gold may continue rising in the next few hours if support at 4,072 4.074 holds. Conversely, if a rejection candle forms at resistance 4,085 4,088 or 4.095, a short-term pullback to 4,065 4,072 is possible.
💡 Short-Term Trading Strategy:
• SELL XAU/USD at: 4,084 4.088
🎯 TP: 40/80/200 pips
❌ SL: 4,092
• BUY XAU/USD: 4.065-4062
🎯 TP: 40/80/200 pips
❌ SL: 4,059

A rebound after hitting bottom is bound to face pressure again.#XAUUSD OANDA:XAUUSD TVC:GOLD
Gold rebounded after falling to around 3997, forming a V-shaped pattern and has now largely recovered its Asian session losses. However, judging from the timeline, the mid-term correction is not yet completely over. During the NY session, we should continue to pay attention to the 4000-3980 range. Only a break below this level can open up further downside potential. Similarly, as I mentioned before, the market is expected to remain volatile before the data release, so the short-term upside resistance level to watch is 4055-4060, and the key resistance level is 4080-4090. If gold prices first touch 4055-4060 and encounter resistance during the NY session, consider shorting gold with a small position.
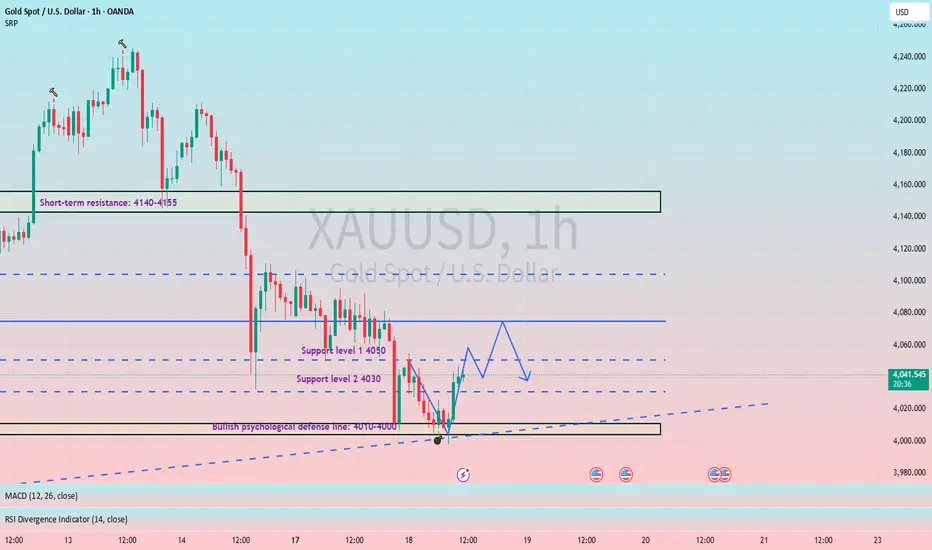
XAUUSD: Short if resistance at 4050 is not broken.Gold prices plunged by approximately $100 yesterday, from a high of around 4110 to around 4010.
Looking at the current 1-hour chart:
It's clear that the 4010-4000 area represents a support level from the previous rapid rise.
If the price fails to break below 4000, a bottoming-out rebound is possible.
The current resistance level is around 4050.
After breaking below 4050 last night, 4050 has become resistance.
Gold is currently likely to consolidate within the 4000-4050 range.
Which way will the breakout occur next?
If gold prices return above 4050, the trading range will revert to 4050-4100.
Conversely, if it breaks below 4000, the subsequent range will become 4000-3950.
Therefore, as long as the 4000-4050 range remains unbroken, I recommend maintaining a range-bound trading strategy, buying low and selling high, and avoiding chasing highs and lows.
Gold is currently at 4050, a short position can be initiated.

The bullish structure remains intact, we remain bullish.#XAUUSD TVC:GOLD OANDA:XAUUSD
Looking at the hourly chart, the short-term resistance level is at 4210, which is also the high point of yesterday's NY session rebound. Although gold encountered resistance and pressure again during the day, as long as this resistance is broken, it will continue to test the 4245-4260 level.
Gold has fallen back again, but the bullish structure has not been broken in the short term. The current pullback can be regarded as a technical correction, so I am still inclined to be bullish on gold. The daily MA5 has also risen to around 4160, which is exactly the important support level I emphasized yesterday. Therefore, if the price retraces to 4160-4145 again during the European session, we can continue to go long on gold.

Gold rebounds from 4159 – support holds strong, upward trend📌 Market Overview
Gold (XAU/USD) dropped to 4159 and then bounced back, showing that:
• The strong 4158–4165 support zone continues to hold firmly.
• The weakening USD is helping gold maintain its bullish structure.
• Short-term profit-taking pressure appeared but wasn’t enough to break support.
• Risk-off flows still favor gold, keeping buying interest near support.
📈 Technical Analysis
• The strong bounce from 4159 confirms that the medium-term uptrend remains valid.
• EMA20 near 4170–4172 is acting as short-term resistance.
• EMA100 & EMA200 remain below → overall trend stays bullish.
• Key support zones:
o 4158–4165 → strongest intraday support.
o 4138–4145 → deeper support if breakdown occurs.
• Key resistance:
o 4176–4182 → near-term resistance.
o 4187–4195 → major resistance, likely rejection zone.
• RSI recovering from lows → buying momentum is returning.
🧭 Outlook
• The sharp rebound from 4159 indicates gold is still in a bullish pullback phase.
• As long as price stays above 4158, gold is likely to:
o 🔄 Retrace toward 4176–4182
o 🔺 Extend toward 4187–4195
• Only if gold closes H1 below 4158, the trend shifts bearish with targets at 4138–4145.
🎯 Trading Strategy
🔺 BUY XAU/USD
Entry: 4158 – 4161
🎯 TP: 40 / 80 / 200 pips
🛑 SL: 4154
🔻 SELLXAU/USD
Entry: 4178 – 4181
🎯 TP: 40 / 80 / 200 pips
🛑 SL: 4184

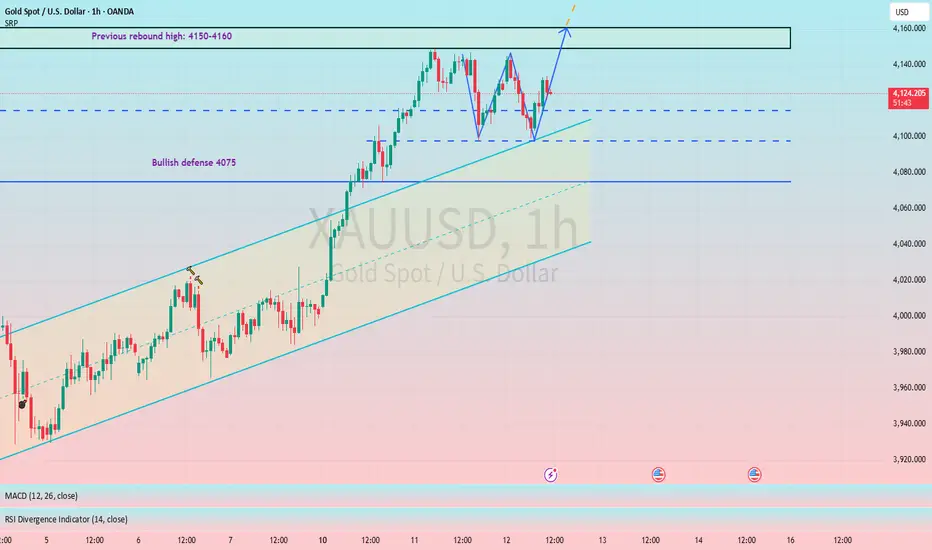
A W-shaped pattern is emerging, indicating a bullish outlook.#XAUUSD TVC:GOLD OANDA:XAUUSD
Gold prices trended downwards during the Asian session, leading many to believe the market has begun to reverse. However, I disagree. As I clearly stated yesterday, as long as the key support level of 4075 is not broken, we will maintain our bullish outlook, and we will continue to follow this strategy today.
From the hourly chart, gold prices are showing signs of forming a W pattern. If the neckline is broken, gold prices will continue to rise, testing the 4150-4160 range. A strong breakout could see prices reach 4180, or even 4200.
XAU/USD) Bullish trend analysis Read The captionSMC Trading point update
Technical analysis of XAU/USD (Gold) on the 1-hour timeframe. Here’s a detailed breakdown of the idea:
---
Context & Structure
The market has been in an uptrend, confirmed by a strong impulsive leg upward.
The current pullback retraced into a key demand zone (highlighted blue box), aligning with:
The 0.705 – 0.79 Fibonacci retracement zone, often a high-probability reversal area.
The EMA(50) at 4,092, which provides dynamic support.
---
Key Technical Elements
1. Demand Zone (Blue Box):
Price has tapped into the discount area of the previous bullish move. This area is expected to attract buyers.
2. Fibonacci Confluence:
The retracement aligns with the 70.5–79% zone, suggesting potential exhaustion of the pullback.
3. EMA Support:
EMA(50) and EMA(200) are both trending upward, reinforcing bullish structure continuation.
4. Liquidity Sweep:
The lower wick into the demand zone may represent a liquidity grab before the next bullish leg.
---
Projected Scenario
Expected reaction: bullish rejection from the 0.705–0.79 zone.
Price is anticipated to form a short-term higher low and then continue upward.
Target Point: 4,161.261 — aligns with the prior swing high / equal highs liquidity area.
---
Trade Idea Summary
Bias: Bullish continuation
Entry Zone: 4,100–4,090 area (within blue zone)
Confirmation: Bullish reversal candle or break of minor internal structure upward
Target: 4,161
Invalidation: Clean break below 4,085 (below demand zone and EMAs)
---
please support boost 🚀 this analysis

A reversal? No! Our bullish outlook remains unchanged!#XAUUSD OANDA:XAUUSD TVC:GOLD
Looking at the hourly and 4-hour charts, the technical indicators are diverging, indicating a need for a pullback correction. In the short term, it may test the 4115-4105 support level. Therefore, do not trade blindly in the short term, wait for the price to pull back to the support level before participating in long positions.

The bull market has returned. Am I bullish at this price level?#XAUUSD TVC:GOLD OANDA:XAUUSD
Gold prices performed strongly yesterday, closing with a large bullish candle on the daily chart and stabilizing above the daily MA5, officially signaling the return of bulls to the market.
Gold strengthened further today, and from a technical perspective, the bullish trend remains intact. Therefore, continuing to go long on gold is clearly safer. The bullish signal given last night regarding a pullback to the 4075 support level remains valid. However, with the passage of time and the continued strength of gold, a direct pullback to this level in the short term is somewhat difficult. But as a point of multiple pullbacks on smaller timeframes and near the daily MA20, the 4075 support remains reliable. Therefore, we can consider it a defensive level for the short-term bulls. As long as gold prices remain above this level, the bullish momentum will not change.
Currently, looking at the hourly chart, the 4125-4110 range is the support zone for the short term. If the price retraces to this level during the European session, it would be a good entry point, and we can continue to go long on gold within this range.

Gold Technical Outlook:
Price has stabilized above the 4105 level, indicating a potential bullish continuation toward the resistance zone at 4160.
A break and confirmation above 4160 on the 1-hour or 4-hour candle would strengthen the bullish sentiment and open the way for further upside targets at 4188 and 4220.
However, if the price drops and breaks below 4105, this would invalidate the bullish scenario and shift the outlook toward a downward move targeting the 4075 support level.

XAU/USD) Bullish trend analysis Read The captionSMC Trading point update
technical analysis of Gold (XAU/USD) on the 4-hour timeframe. Let’s break down the technical analysis presented:
Overall Idea
The analysis suggests that Gold is likely to continue its upward movement after a possible short-term retracement. The chart projects a move toward the target point at 4,160.549.
---
Key Technical Elements
1. Break of Structure / Trendline Break
A descending trendline (black) has been broken to the upside, signaling a potential trend reversal from bearish to bullish.
The breakout candle is strong and supported by volume, confirming bullish momentum.
2. Fair Value Gap (FVG) Zone
A Fair Value Gap (blue box) has been marked where price may retrace to fill imbalance before continuing higher.
This FVG area also aligns with the previous resistance turned support, adding confluence for a bullish continuation.
3. Exponential Moving Averages (EMAs)
EMA 50 (blue): 4,016.295
EMA 200 (black): 3,965.661
Price has crossed above both EMAs, indicating a strong bullish trend shift.
A bullish EMA crossover may be forming, further confirming upward bias.
4. Projection Path
After a short retracement into the FVG zone, the expected price structure shows:
A bounce upward forming higher highs.
The final target zone is projected at 4,160.549, where a potential take-profit level lies.
---
Target and Confirmation
Target Point: 4,160.549
Retracement Zone (Buy Area): Within the blue FVG zone (around 4,060–4,080 range).
Confirmation: Watch for a bullish reaction (e.g., bullish engulfing or rejection wicks) within the FVG zone before entry.
---
Risk Considerations
If price closes below the FVG or drops back under 4,016 (50 EMA), it could invalidate the bullish continuation setup.
Fundamental catalysts like U.S. Dollar strength or economic data releases could cause volatility and affect momentum.
Mr SMC Trading point
---
Summary:
This analysis outlines a bullish continuation setup on Gold, expecting a pullback into the FVG for liquidity collection before resuming upward momentum toward 4,160.549.
Please support boost 🚀 this analysis
