The bulls are back, and going long remains the main theme.#XAUUSD OANDA:XAUUSD TVC:GOLD
Although the beginning of the week didn't offer a pullback entry opportunity, gold rallied immediately after the open, breaking through 4030 as expected and continuing its upward trend, officially signaling the return of the bulls to the market.
From the hourly chart, gold broke through the resistance of the upward channel at 4055 and continued to fluctuate upwards, indicating that the bullish momentum remains strong in the short term. However, attention should be paid to the resistance at 4080-4100 from the weekly MA5 moving average and the daily middle line, and be wary of a possible pullback after a surge. Therefore, in the short term, avoid blindly chasing the rally, patiently waiting for a pullback to buy remains our main trading strategy. The first support level to watch is the 4055-4045 level, a previous resistance turning point, followed by the important support at 4030-4020.
Therefore, if gold prices fall back after encountering resistance during the European session, we can consider going long on gold in batches based on the strength of the pullback.
Goldmansachs

Market volatility, trade steadily.#XAUUSD TVC:GOLD OANDA:XAUUSD
As mentioned last night, gold prices failed to break below the important short-term support level of 3965, so we maintain our bullish view. Although the intraday volatility was not high, the consolidation process can be seen as gold accumulating positions in the short term. Market breakout requires patience. Currently, the daily MA5 and MA10 moving averages are converging around 3980, which is also where the 4-hour middle band is located. The key resistance level in the short term is in the 4015-4030 area. A break above this level could lead to further gains towards 4050-4080.
It's important to be cautious given the recent volatile market with poor continuity. Therefore, even if a breakout occurs today, it is not advisable to rush to buy. Instead, wait for a pullback before entering the market to avoid being trapped by blindly chasing highs. The 3980-3965range remains the ideal entry point for bulls. Maintaining patience is always a key element in trading.

XAU/USD) Bullish trend analysis Read The captionSMC Trading point update
Technical analysis of Gold (XAU/USD) — expecting a retracement into a demand/Fibonacci zone before a continuation to the upside toward the target at 4,030.68.
Here’s the detailed breakdown
---
Overall Idea
The analysis suggests a pullback-entry buy scenario, where Gold is expected to retrace to a key Fibonacci confluence + trendline support zone, then resume the uptrend toward 4,030.
This setup fits the Smart Money Concept (SMC) and market structure shift logic — from bearish to bullish.
---
Key Components
1. Market Structure Shift
Price broke above the descending trendline, signaling a potential bullish reversal.
The pullback is seen as a retest of the breakout zone, which often becomes a new support area.
The overall expectation is for a higher-low formation, leading to continuation upward.
2. Fibonacci Retracement Zone
The 0.5–0.79 retracement area (highlighted blue box) is the ideal buy zone.
Price is expected to tap into this area before continuing higher.
The 0.705 Fibonacci level aligns with the previous structure and EMAs, adding confluence.
3. EMA Confluence
50 EMA (3,986.37) and 200 EMA (4,007.71) are key dynamic levels.
Price is retesting around the 50 EMA, which supports the idea of a bullish continuation if respected.
Once price breaks above the 200 EMA, momentum confirmation strengthens.
4. Projected Path
The expected pattern:
➤ Pullback into 0.62–0.79 zone →
➤ Formation of a higher low →
➤ Impulsive move toward 4,030.68 target point.
The projected move aligns with structure and Fibonacci extension.
Mr SMC Trading point
---
Summary
Market bias: Bullish
Setup type: Retracement buy / Trend continuation
Entry zone: 3,975–3,985 (Fibonacci 0.62–0.79 area)
Target point: 4,030.68
Confirmation: Bullish rejection from zone or structure break above 4,000
Invalidation: Break below 3,960 (previous swing low)
---
pelas support boost 🚀 this analysis

XAU/USD) Bullish trend analysis Read The captionSMC Trading point update
Technical analysis of Gold (XAU/USD) on the 1-hour timeframe, with a clean structure suggesting continuation toward the 200 EMA. Here's the idea summary:
---
Analysis Idea: Bullish Continuation Setup
1. Structure Overview:
Price is currently trading above the ascending trendline, showing a short-term bullish bias.
The 50 EMA (3,974.93) has recently been retested and held as support.
The 200 EMA (4,011.37) acts as the next resistance / target point.
2. Setup Logic:
After a breakout above the 50 EMA, price is forming a retest zone (highlighted box).
A bullish reaction from this zone aligns with the trendline confluence and EMA support.
This suggests buyers may step in again to push price higher.
3. Entry & Target:
Entry Zone: Near 3,974–3,978 (trendline + EMA confluence area).
Target: 4,011 (200 EMA / key resistance).
Stop Loss: Below 3,965 (below the trendline and retest box).
4. Market Psychology:
Recent candles show higher lows and strong bullish momentum after rejection from previous lows.
Break and retest of dynamic resistance (50 EMA) supports bullish continuation.
Mr SMC Trading point
---
Trade Idea Summary:
Bias Entry Zone Stop Loss Target Confirmation
Bullish 3,974–3,978 <3,965 4,011 Bounce from trendline or bullish candle pattern
---
Pelas support boost 🚀 this analysis

We firmly go long when the market is blindly shorting.#XAUUSD OANDA:XAUUSD TVC:GOLD
From the hourly chart, the short-term gold price has broken through the resistance of the triangle pattern boundary. The market has made its choice, and it is clear that we bulls have won. Therefore, we can continue to execute our trading strategy for the next step. Wait for a pullback to 3995-3985 to buy again, with an initial target of 4020-4030.

Gold – Buy around 3960, target 3980-4000Gold Market Analysis:
Gold rebounded sharply yesterday after touching 3930. The expected rebound followed by a further decline didn't materialize; instead, it underwent a significant correction and consolidation at higher levels. The daily candlestick pattern closed positive again, indicating significant buying and selling pressure due to the alternating bullish and bearish candles. Finding the right rhythm during short-term consolidation is crucial. Today's strategy for gold is to maintain a bearish overall trend while expecting short-term consolidation, with opportunities for both buying and selling. The 5-day and 10-day moving averages are about to cross, potentially indicating a direction today. Note the upcoming Non-Farm Payrolls (NFP) data; a large one-sided trend is unlikely. We anticipate needing the NFP to provide direction. Our target direction is a breakout from the short-term consolidation. Today, focus on the 3990 level during the Asian session; a break above this level would trigger a new buying opportunity, forming a large V-shaped pattern on the 4-hour chart. For the Asian session, look for two buying opportunities: a slight dip to the 3965-3960 area, and a pullback after breaking 3990. Gold's consolidation will likely be volatile; chasing the market today requires confirmation of signals to avoid losses. Our strategy for gold remains to follow the trend and trade based on understanding the market.
Support levels are 3965 and 3956, with strong support at 3930. Resistance is at 3990, with strong resistance at 4020. The key level for market strength/weakness is 3990.
Fundamental Analysis:
Yesterday's ADP employment data was -2.9, with an expected 2.8, but the result was 4.8. The positive data is bearish for gold, but gold only saw a small rebound, so the reaction was not significant .
Trading Recommendation:
Gold – Buy around 3960, target 3980-4000.

XAU/USD) Bearish trend analysis Read The captionSMC Trading point update
Technical analysis of XAU/USD (Gold Spot) – Bearish Continuation Setup
Timeframe: 1H (Capital.com)
Concepts: Smart Money Concepts (SMC), Trendline Break, FVG & EMA Confluence
---
Market Structure Overview
The uptrend structure was recently broken, confirming a shift to bearish order flow.
Price has broken the ascending trendline, retested near the FVG / premium retracement zone, and is rejecting from the supply area.
The structure and EMAs both support further downside continuation.
---
Key Technical Elements
Retracement Zone (Short Entry Area):
0.5 – 0.79 Fibonacci levels align with the Fair Value Gap (FVG), showing potential for bearish mitigation.
Price currently trading near 0.62–0.705 level (premium zone).
EMA Confluence:
EMA-50 ≈ 3,992
EMA-200 ≈ 4,024
Both EMAs are above price, acting as dynamic resistance.
Trendline Break:
The ascending trendline has been decisively broken and retested, indicating trend reversal confirmation.
---
Targets
Immediate Target (0-level structure): 3,940 zone
Extended Bearish Target: 3,796 — marked as the final target point on the chart
---
Scenario Plan
1. Expect minor retracement to the FVG zone (3,990–4,010).
2. Watch for bearish confirmation (rejection or lower-timeframe BOS).
3. Target downside continuation to 3,796, completing the swing projection.
Mr SMC Trading point
---
Bias:
> Bearish – Market showing structure shift, EMA confluence, and FVG rejection setup aligning toward deeper downside movement.
---
please support boost 🚀 this analysis

Gold – Technical Outlook🔴 Bearish Scenario (Downtrend)
Pivot Level: 4000
If price trades below 4000, continuation to the downside is expected.
🎯 First target: 3930 (support zone)
If 3930 breaks → full bearish extension towards:
🎯 Next targets: 3895 – 3865
🟢 Bullish Scenario (Uptrend)
If price breaks and holds above 4000, upside momentum will strengthen.
🎯 First target: 4030 (resistance zone)
If 4030 breaks and holds on the 1H or 4H timeframe → strong bullish continuation towards:
🎯 Next targets: 4081 – 4133

Support and trend line coincide, pullback to buy.#XAUUSD OANDA:XAUUSD TVC:GOLD
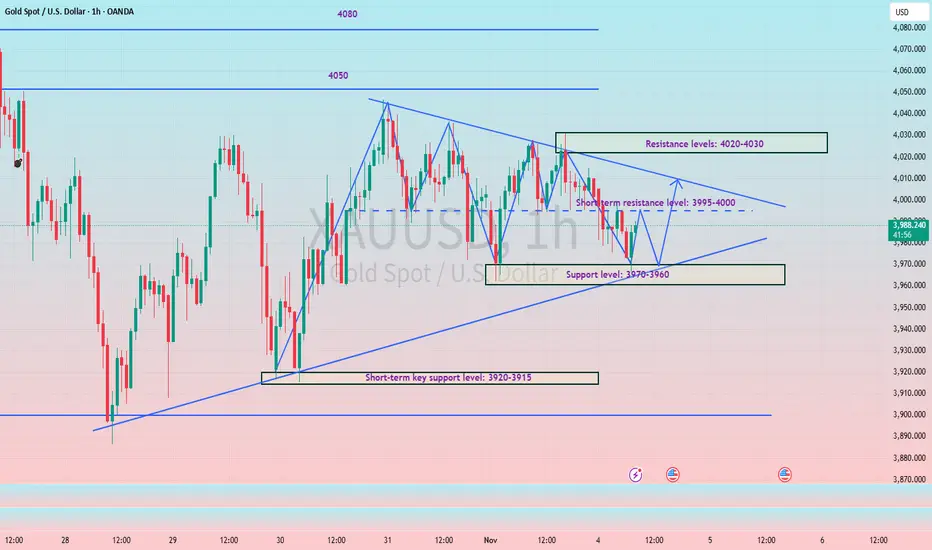
So far, gold has failed to break out of the converging triangle boundary to choose a clear trading direction, but as time goes on, the price is gradually approaching the end of the triangle, and the battle between bulls and bears may come to a critical decision during the NY session. Looking at the hourly chart, multiple attempts to break through the 4000 resistance level have failed, confirming the pressure above, and gold prices may see further pullback in the short term. The support zone below coincides with the upward trend line, which may be the key area for gold to test during a pullback. Therefore, continue to pay attention to the support level of 3970-3960. If the price retraces to the support level during the NY session and does not break down, you can try to go long on gold with a small position.

How to keep up with the rhythm of triangle pattern consolidation#XAUUSD OANDA:XAUUSD TVC:GOLD
Gold prices stalled at higher levels yesterday, mainly due to Federal Reserve officials' cautious stance on a December rate cut, which boosted the dollar and dampened enthusiasm for gold's rise. Judging from the current trend, the market is in a converging triangle pattern. The daily MA5 is around 3987, and the MA10 is around 4021. It can be seen that the range between these two points is very small, indicating that the market is also preparing to break out and choose a major direction. Once the gold price breaks out of the triangle pattern and chooses a direction, the daily chart's trendline will widen. Therefore, the key resistance level to watch is 4020-4030, while the key support level is 3970-3960. The European session is expected to trade within a range in the short term. Before a successful breakout, pay attention to the resistance level of the middle band on the hourly and 4-hour charts at 3995-4000. If the price touches the resistance level on the first attempt and fails to break through, a small short position can be considered.
Gold may reverse up if support ~3,950–3,970 USD/oz holds📊 Market Overview:
Gold is trading around ~3,980 USD/oz in the Asian session after declining from ~4,020 and dipping near ~3,975. On the H4 timeframe the selling pressure remains as no strong bottom has yet been confirmed around the support zone. Meanwhile, economic data and USD/crude oil swings continue to exert pressure.
📉 Technical Analysis:
• Key support: ~3,950–3,970 USD/oz (previous bounce zone).
• Immediate resistance: ~4,020–4,040 USD/oz.
• The EMA 50 is around ~3,990-4,000, acting as interim resistance.
• If price closes H4 below ~3,950 → likely target ~3,900. If it holds above ~3,970 and rallies, target ~4,040.
• Recent H4 candles show a potential hammer/pin-bar at the support zone, but we need confirmation via a strong H4 close.
📌 Outlook:
The medium-term bias remains neutral to slightly bearish until support ~3,950-3,970 holds and price closes above ~4,000 on H4. If the support breaks, deeper declines are probable. If support holds and we see volume/momentum pick up in EU/US session, a recovery may kick in.
💡 Suggested Strategy:
🔺 BUY XAU/USD
Entry: 3,972 – 3,969
🎯 TP: 40 / 80 / 200 PIPS
❌ SL: 3,966
🔻 SELL XAU/USD
Entry: 4019 – 4022
🎯 TP: 40 / 80 / 200 PIPS
❌ SL: 4025

Latest gold price trend analysis today!Market News:
On Monday (November 3rd) in early Asian trading, gold prices in London were pressured by the dollar index hitting a near three-month high, as hawkish comments from several Federal Reserve officials on Friday reduced the probability of a December rate cut. However, market sentiment remained cautious, as the near-historic US government shutdown and ongoing geopolitical instability continued to support gold prices. International gold prices rose 3.7% in October, marking the third consecutive month of gains. A 53% increase year-to-date further demonstrates the resilience of international gold. It should be noted that North America officially adopted daylight saving time on Sunday (November 2nd). Trading hours for major financial instruments in the US and Canadian financial markets, such as gold, silver, crude oil, and US stocks, as well as the release times of important economic data, will generally be one hour later than during daylight saving time. For traders, remaining on the sidelines in the short term and selectively positioning for positions in the $3800-$4000 range may be the most prudent choice. In the long term, however, the strategic allocation value of gold remains unshaken due to currency depreciation, geopolitical cycles, and central bank gold purchase cycles. This week, attention should be paid to news related to the US government shutdown and speeches by Federal Reserve officials. Additionally, data such as the ISM Manufacturing PMI, ADP employment, the Bank of England's decision, and the Michigan Consumer Sentiment Index should be monitored.
Technical Analysis:
Gold is expected to continue its wide-range consolidation. The monthly chart shows a long upper shadow bullish candlestick, with the price closing near the upper Bollinger Band. The weekly chart shows a bearish candlestick, with the gap down at 4113 still unfilled. The price has retreated to the 10-day moving average support at 3890. The RSI indicator, after a prolonged period of overbought conditions, has turned downwards and is trading below 70. On the daily chart, the 10-day and 7-day moving averages continue to widen downwards to 4028/4000, and the RSI indicator is consolidating around the 50 level. The Bollinger Bands on the short-term 4-hour and hourly charts are narrowing, and the RSI indicator is showing weak consolidation near the lower band. Technically, gold's weak consolidation is likely to continue. However, looking at the longer-term uptrend line, gold is currently still within an upward channel, with key support around $3900. As long as this level is not decisively broken, the long-term uptrend for gold is expected to continue.
Gold Intraday Trading Strategy:
Buy gold at 3930-3935, stop loss at 3920, target 3980-4000;
Sell gold at 4005-4010, stop loss at 4020, target 3950-3920;
Key Levels:
First Support: 3963, Second Support: 3950, Third Support: 3930
First Resistance: 4007, Second Resistance: 4020, Third Resistance: 4038

What is the purpose of this back-and-forth market manipulation?#XAUUSD OANDA:XAUUSD TVC:GOLD
Gold prices have broken through short-term resistance due to news, and the hourly and 4-hour charts show prices above the middle Bollinger Bands. Therefore, we need to adjust our strategies accordingly. However, the market is currently fluctuating rapidly, and entering the market rashly in the short term still carries significant risks. Therefore, the wise choice is to wait and see, and enter the market only after the market stabilizes. In the short term, the upside resistance level to watch remains at 4030. If gold breaks through this level strongly during the US session, the price may test 4050. The initial support level to watch is 3980-3960. If the price retraces but does not break through this level, consider taking small long positions in gold in batches, with a target of 4010-4030. Temporary adversity is the best test for traders; setbacks only make us stronger. Success belongs to the confident, opportunity belongs to the pioneers, and miracles belong to the persistent! 💪💪💪

Gold: Trending downwards, 3980 is key.#XAUUSD TVC:GOLD OANDA:XAUUSD
In the short term, gold is still digesting the hawkish impact of Powell's speech, and selling pressure remains heavy.
From a technical perspective, yesterday's daily candlestick closed with a long upper shadow. The 4030 level has proven to be a strong resistance level for gold prices, while the daily MA5 moving average has continued to cross below the MA10 moving average, making 3980-3990 a key short-term resistance level. Only by breaking through this key resistance range can gold prices potentially test higher levels further. Otherwise, the market will remain in a weak and volatile state in the short term.
On the support side, pay close attention to the double bottom support level formed on the hourly chart at 3920-3915.
If this range is breached, gold prices may experience an accelerated decline, further testing 3880 or even 3850.
Therefore, in the short term, European trading can try to short gold with a small position when the price rebounds to 3980-3990. The first target can be 3960-3950, and if the price falls sharply, the next target is 3920-3915.

Watch for support at 3990-3980 to consider going long on gold.#XAUUSD TVC:GOLD OANDA:XAUUSD
Gold prices have repeatedly tested the 4030 level without a successful breakout. Gold has now begun to decline, with short-term bears gradually releasing their momentum. Further downside is expected, with support expected in the 3990-3980 range. If gold prices can pull back to this range in the short term, we can consider going long on gold in anticipation of a rebound. Target range: 4030-4050
Focus on the Federal Reserve, short once in 4020.#XAUUSD OANDA:XAUUSD TVC:GOLD
Last night, I gave everyone a trading strategy to short at 3975-3990. It can be said that there were several opportunities after the Asian session opened. As long as you followed the strategy and executed the short order, I believe you will definitely have a rich return if you seize any of the opportunities.
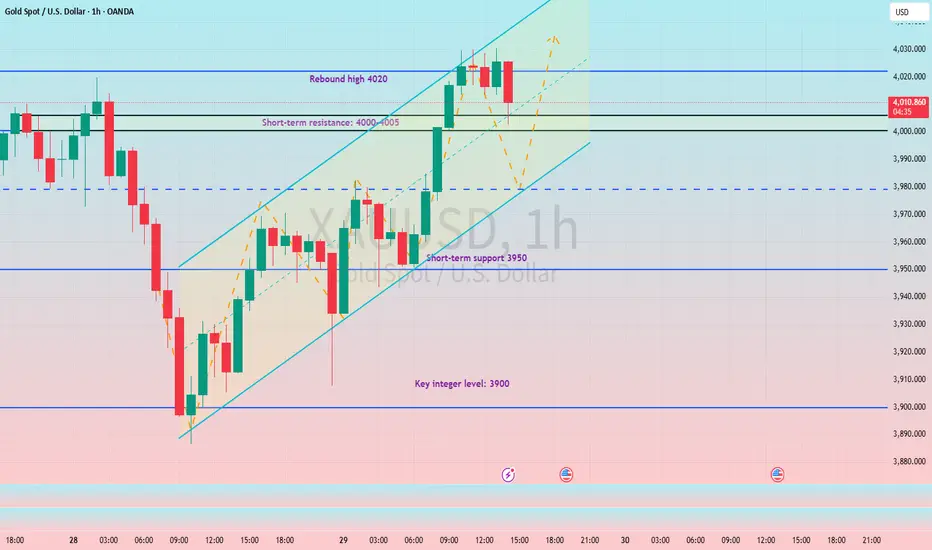
However, please note that trading is never done blindly. Price trends change over time, so please combine strategies with flexible responses. For example, since the current gold price has broken through the trendline resistance, short-term traders should be more cautious.
With the trend resistance broken, the short-term bulls have strengthened further. The first resistance level to watch is 4000-4005. As a psychological barrier for previous defense, gold prices will definitely test this resistance level first if they want to rise further. If this level is broken, gold will continue its upward trend and further test yesterday's rebound high of 4020. This is also the key level that bears need to defend today. Therefore, I believe we should not rush into trading in the short term. We can patiently observe the market performance. When the gold price rebounds to the 4010-4020 resistance range and encounters resistance, we can consider shorting gold appropriately.

Gold - Sell near 3981, target 3940-3900Gold Market Analysis:
Yesterday, gold rebounded sharply after hitting a low of around 3886 on the daily chart. Selling pressure had broken through 4000 and 3900, indicating a short-term sell signal. However, the late-day rally resulted in a very long lower shadow on the daily chart. I predict gold will consolidate and fluctuate today. No market can fall indefinitely; after a significant drop, consolidation and correction are necessary. Today, we'll focus on the potential profit from any subsequent decline. During the Asian session, we'll maintain a sell-on-high strategy. The weekly chart's top signal is confirmed, making a new high unlikely in the short term. There are two possibilities: either a correction begins, with the price falling back to its previous high, or a large-scale consolidation and sharp price swings at higher levels. Based on yesterday's performance, a large-scale consolidation at higher levels is more likely. In such a market, timing is crucial. The high point of the Asian session rebound, 3981, is the hourly high and the first resistance point in the Asian session. Even stronger is 4019, which was the previous bottom of the pattern and has now transformed into a new strong resistance level. If future buying can hold above this level, it could trigger a new major rebound. The 5-day moving average on the daily chart is also approaching this level, making further corrections more likely.
Support is 3941 and 3900, while resistance is 3981 and 4019. 3981 is the dividing line between strength and weakness.
Fundamental Analysis:
The previous smooth Sino-US trade negotiations were positive for the US dollar, leading to a sharp drop in gold as safe-haven sentiment eased. Another major data point this week is the Federal Reserve's monetary policy announcement.
Trading Recommendation:
Gold - Sell near 3981, target 3940-3900.

Gold Consolidates Weakly Around $3925 – Sellers Still in Control📊 1. Market Overview
Gold prices rebounded slightly from the $3900 level, reaching $3931 before losing momentum. The market is now moving sideways around $3925 in a weak consolidation phase. The U.S. dollar remains firm as Treasury yields stay elevated, while traders await the upcoming PCE inflation data, limiting gold’s recovery potential.
🔍 2. Technical Analysis
• Main Trend: Bearish, with weak corrective rebounds.
• Immediate Resistance: $3930 – $3935
• Higher Resistance: $3948 – $3960
• Near-term Support: $3900 – $3890
• EMA50 & EMA200 (H1): EMA50 remains below EMA200, confirming the ongoing bearish bias.
• Candlestick Pattern: Small lower-tail candles around 3925 indicate mild buying but no clear reversal signal.
• RSI (H1): 45 – neutral, suggesting potential range-bound movement before breaking above 3930 or below 3900.
💡 3. Outlook
Gold is currently in a short-term accumulation phase after a steep drop, but the broader trend remains bearish. A rejection from the $3930–$3935 resistance zone could trigger another decline toward $3900 or even $3880. Conversely, a decisive breakout above $3935 with strong volume may extend the rebound toward $3960.
🎯 4. Trading Strategy
🔻 SELL XAU/USD: $3928 – $3932
🎯 TP: 40 / 80 / 200 pips
🛑 SL: $3938

Why am I bearish when the market is bullish?#XAUUSD TVC:GOLD OANDA:XAUUSD
We have reminded everyone today that you can short gold in batches at key points, and now all short positions have been exited. When entering the market, it depends on the technology; when leaving the market, it depends on the mentality. Don’t be dominated by fear and greed. Profits belong to you only when you really get them in your hands. Otherwise, everything is just empty talk.
Short-term bears should not continue to participate blindly. By observing the hourly line trend, we can find that this is a typical upward trend. Therefore, bulls may still have a certain rebound momentum in the short term. But it should also be noted that there is pressure from the golden section point of 38.2%, or 3975, and it is also close to the downward trend line. Therefore, for evening trading, I think we can continue to be patient and wait, observe the performance of 3975-3990, and then consider appropriately participating in shorting gold after there is obvious pressure but it is not broken.

When the market was confused, I shorted at 3975#XAUUSD OANDA:XAUUSD TVC:GOLD
Yesterday's short profit marked a good start to this week's trading. Today we will continue this good habit and continue to make profits.
First, the weekly MA5 moving average has broken below and is moving closer to the MA10 moving average. Secondly, through the hourly chart and 4H chart, we can find that the bears still dominate the market. Then our trading idea is very clear, which is to focus on shorting on rebounds.
Gold has already fallen below 3950, so it is likely to hit the 3900 integer mark next, or even 3880-3870, or even the weekly MA10 around 3835. However, in the short term, I still recommend not blindly chasing shorts and be wary of a possible rebound in the short term. Conservative traders can wait for a rebound to 3960-3975 before attempting to continue shorting gold.

Gold - Sell near 4019, target 3980-3970Gold Market Analysis:
Yesterday, we sold gold at 4066, 4037, 4049, and 4050, maintaining a bearish outlook. Yesterday's blog analysis and chart clearly demonstrated this bearish outlook. Gold's selling price dipped to as low as 3970, surprisingly breaking through 4000 with ease. In fact, from a broader perspective, 4000 is a major support level and a round number. I predict there will be further trading around 4000. Today's strategy remains bearish, so continue selling on rallies. Yesterday's decline was too large, and today's decline is expected to correct. Gold has been volatile recently, so we should try to follow the trend and chase orders. If you follow orders, the probability of losses is higher. A small rebound can result in 30-50 pips, making it difficult to take technical positions. We must also stick to our direction and not change it easily. Today's Asian session tested resistance at 4019. If this level holds, selling is still acceptable. The current pattern suggests a stronger resistance level at 4049, which has transformed from a previous strong support level into a new resistance level. Yesterday's daily chart closed negative, and after breaking 4000, selling today suggests continued downward momentum. Furthermore, if 4049 unexpectedly breaks, it will be necessary to observe whether there is a new rally.
Resistance levels are 4019 and 4049, support is 3970, and 4019 is the dividing line between strength and weakness.
Fundamental Analysis:
The decline in gold prices is attributed to the fading of news, which has led to a decline in risk aversion. We will continue to monitor the Federal Reserve's new monetary policy.
Trading Recommendation:
Gold - Sell near 4019, target 3980-3970.

XAU/ USD Bullish trend analysis Read The captionSMC Trading point update
-
Technical analysis of XAU/USD (Gold Spot)
Timeframe: 1H (OANDA)
Technical Basis: Smart Money Concepts (SMC) + EMA Confluence
---
Market Structure
Current trend: Bearish, price respecting a descending wedge/channel.
Recent Break of Structure (BOS) confirms bearish momentum continuation.
Price is retracing after forming a new low and may move back to mitigate imbalance (FVG).
---
Key Technical Areas
Retracement Levels:
0.5 – 0.79 Fibonacci zone marks the premium shorting area.
Fair Value Gap (FVG) zone between 0.62–0.79 levels is the ideal entry region.
EMA Resistance:
EMA-50 ≈ 4,067
EMA-200 ≈ 4,120
Both EMAs align with the supply zone, strengthening sell bias.
---
Projected Move
1. Expected retracement toward the 4,067–4,100 zone (supply/FVG region).
2. Potential short entry within that area.
3. Bearish continuation targeting the next structural low at 3,960 (as marked).
---
Targets
Next Target (retracement zone): 4,089
Final Bearish Target: 3,960
Mr SMC Trading point
---
Summary
Gold remains under bearish pressure within a contracting structure. A retracement to the premium zone (4,067–4,100) offers potential short opportunities aligned with structure and EMA resistance. A break below 3,995 would further confirm bearish continuation toward 3,960.
---
Pelas support boost 🚀 this analysis

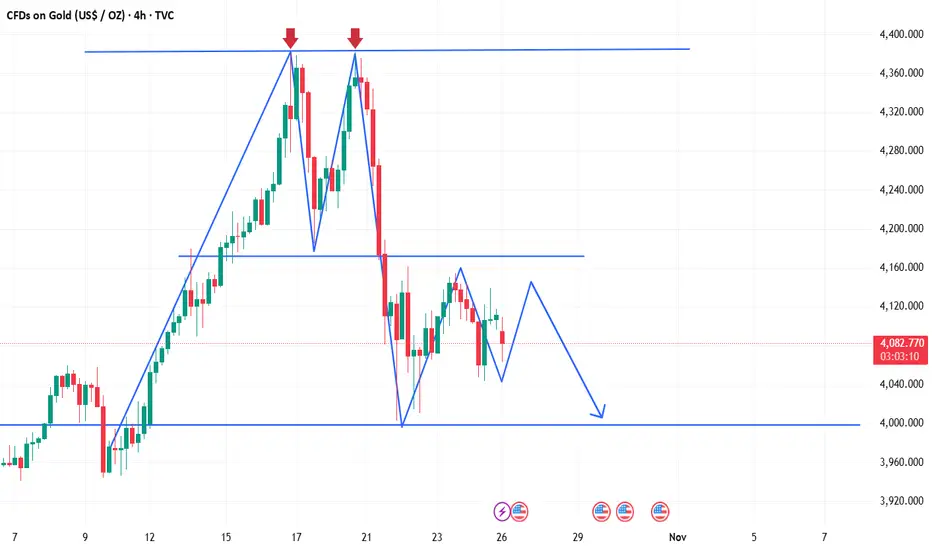
Gold analysis with trading ideasAfter nine consecutive weeks of strong gains, gold has entered a sharp correction phase. Driven by intense selling pressure, its nearly three-month winning streak has officially come to an end. However, given the persistently high levels of global geopolitical and economic uncertainty, the likelihood of a significant further decline in gold prices remains low, as safe-haven trading activity remains robust and dynamic. Currently, trade negotiations between the U.S. and China are still ongoing, while President Trump has announced the termination of all trade talks with Canada. Meanwhile, due to the U.S. Congress’ prolonged failure to pass an appropriations bill, the release of economic data continues to be disrupted, shifting traders’ focus back to central bank policies once again.
From a technical perspective, following the formation of a "double top" pattern on the 1-hour chart, gold has been oscillating under the resistance of the pattern’s neckline. Despite the bullish CPI data last Friday, gold bulls failed to push prices above the 4,160 level, indicating that short-term bullish momentum is still under significant pressure and gold is likely to remain in a wide-range consolidation. Looking at the 4-hour chart, after prices fell from the "double top" pattern, they rebounded with support from the acceleration line: the lower boundary of the range was reclaimed last Thursday, followed by a second bottoming-out and rebound on Friday—signaling that the short-term support at the lower boundary has been basically confirmed.
The key range currently lies between 4,060 and 4,170, and these two levels can be regarded as the dividing lines for short-term bullish and bearish trends. A break above 4,170 would suggest strengthened rebound momentum, potentially leading to a further test of the upper channel edge around the 4,300 area. Conversely, a break below 4,060 may trigger a continued decline toward the 4,000 support level—this forms the core framework for the current market movement.
Today’s trading strategy will revolve around the 4,000–4,170 range, prioritizing short positions at higher levels and long positions at lower levels. If prices break above 4,170, it will indicate that gold bulls have regained control, requiring a timely strategy adjustment to enter long positions on pullbacks.