XAU/USD) bearish Trand analysis Read The captionSMC trading point update
Technical analysis of (XAU/USD) on the 3-hour timeframe, projecting further downside after rejection from a resistance zone aligned with a descending trendline.
---
Analysis Summary
Trend Bias: Bearish
Current Price: ~$3,301.96
Structure: Price is respecting a descending channel, with multiple rejections from the upper boundary and key resistance zone.
---
Key Technical Insights
1. Resistance Zone & Downtrend Line:
Price was rejected from a resistance block near the EMA 200 (~$3,331) and descending trendline.
This level has repeatedly triggered strong downside moves (highlighted with red arrows).
2. EMA 200 Reaction:
The EMA 200 at $3,331.10 is acting as dynamic resistance.
Each time price reaches or crosses above this line, selling pressure increases.
3. Bearish Price Projection:
After recent rejection, the chart anticipates a pullback to the support zone between $3,248.26 and $3,245.71.
A deeper drop toward $3,159.13 is projected as a next major target, consistent with previous price moves.
4. RSI Indicator:
RSI at 40.24 suggests bearish momentum is still in play but not yet oversold—indicating room for more downside.
---
Bearish Trade Idea
Element Level / Description
Entry Zone Below resistance: $3,310–$3,320
Target 1 $3,248.26–$3,245.71 (support zone)
Target 2 $3,159.13 (channel base / next support)
Stop-Loss Above $3,335 (above resistance zone)
---
Risk Considerations
Fundamental catalysts: Gold is sensitive to USD strength, interest rate decisions, and macroeconomic data.
Invalidation: A strong breakout and close above the descending trendline and EMA 200 would negate the bearish outlook.
---
Summary
This analysis outlines a bearish setup for XAU/USD, supported by trendline resistance, EMA rejection, and RSI momentum. If current structure holds, a move toward the $3,245 and $3,159 levels is likely.
Please support boost 🚀 this analysis)
Goldmansachs

Short-term gold bulls and bears are anxious,3330 becomes the keyAt present, the market has been fluctuating narrowly in the range of 3330-3320, and both bulls and bears are in a stalemate. However, gold has formed a double-layer head and shoulders bottom pattern, so the short-term bullish trend is definitely unchanged. In the previous post, I also mentioned that if the rebound in the European session is weak and gold continues to be below 3345, then the short-term NY session may usher in a retracement and a second bottom. Therefore, I still hold a long order of 3325-3315, and temporarily modify the TP to the 3335 line. I expect that there may be a retracement here, but there may also be a direct retracement. No matter what the situation is, we need to stabilize before entering the market.
In addition to investment, life also includes poetry, distant places, and Allen. Facing the market is actually facing yourself, correcting your shortcomings, facing your mistakes, and exercising strict self-discipline. I share free trading strategies and analysis ideas every day for reference by brothers. I hope my analysis can help you.
PEPPERSTONE:XAUUSD FOREXCOM:XAUUSD FX:XAUUSD FXOPEN:XAUUSD OANDA:XAUUSD TVC:GOLD

Gold: update hello friends✋️
According to the recent growth of gold, you can see that it is constantly resisting and forming a falling pattern.
For this reason, it can be a warning that the fall can continue and the price will fall to the specified limits.
🔥Follow us for more signals🔥
*Trade safely with us*

Gold/USD Bullish Reversal from Support Zone Gold/USD Bullish Reversal from Support Zone 🟢📈
Technical Analysis:
Support Zone: Price is consistently respecting the horizontal support range near 3,305 – 3,310, confirming it as a strong demand zone (marked by multiple orange circles and previous bounce reactions).
Bullish Structure: After breaking the descending trendline, the price has retested the trendline and horizontal support zone, forming a higher low — a classic bullish reversal signal.
Target Projection: The measured move projection targets a potential upside near 3,366.979, aligned with previous highs.
Bullish Candlestick Patterns: Green arrows highlight bullish price action at significant reversal points, confirming buyer strength at support.
Harmonic Pattern: The shaded harmonic pattern suggests completion near the previous lows, which aligns with the reversal zone.
Conclusion:
As long as the price holds above the support area and respects the trendline retest, bulls may push toward the projected target. A break below the zone would invalidate this bullish setup.

XAU/USD) order block back up trand Read The captionSMC trading point update
Technical analysis of Gold (XAU/USD) on the 1-hour timeframe, focusing on a potential reversal from a key support/order block zone. Here's a full breakdown
---
Chart Analysis – XAU/USD (1H)
1. Key Zone: Support Level / Order Block (Yellow Box)
The price is currently testing a strong support zone that previously acted as a bullish order block (demand area).
This zone is also near a diagonal trendline and a prior breakout level, adding confluence to the setup.
2. Reversal Anticipation (Black Zigzag Path)
The chart suggests two possible scenarios from the support area:
A bullish bounce leading price up toward:
Target 1: 3,343.05 (near 200 EMA)
Target 2: 3,364.62 (upper resistance)
A break below the yellow support zone, triggering a deeper move toward:
Key support: 3,247.55
3. RSI Oversold Signal
RSI (14) is at 32.66, which is near oversold territory, signaling potential for a bullish reversal if buying pressure steps in.
4. EMA (200 - Blue Line)
EMA at 3,330.95 currently acts as dynamic resistance.
If price bounces from the order block, this EMA may serve as the first reaction level before further upside.
Mr SMC Trading point
---
Summary
Bias: Bullish bounce if price holds above 3,296.04 (order block support).
Entry Zone: Current price near 3,301 or confirmation bounce candle.
Targets:
TP1: 3,343.05
TP2: 3,364.62
Invalidation: Strong break and close below 3,296.04 may open the path to 3,247.55.
RSI: Favoring reversal conditions (near oversold).
---
Please support boost 🚀 this analysis)

XAU/USD) support level back bullish trend Read The captionSMC trading point update
Technical analysis of Gold (XAU/USD) on the 3-hour timeframe, suggesting a long trade idea with a clearly defined support zone and target projection. Here's the detailed breakdown:
---
Chart Breakdown (3H - XAU/USD)
1. Support Zone (Yellow Box):
Price reacted strongly to the 3,244–3,300 area, which is identified as a key support level.
This area has historically seen demand and is now acting as a base for potential bullish continuation.
2. Falling Wedge Breakout:
A falling wedge pattern has been broken to the upside, which is typically a bullish reversal signal.
The breakout indicates a shift from the previous bearish momentum into bullish strength.
3. EMA 200 Confirmation:
Price is now above the 200 EMA (3,333.347), supporting a bullish bias.
This can act as dynamic support going forward.
4. RSI Momentum:
RSI at 62.00, indicating growing bullish momentum without being overbought.
The RSI has also broken above a previous local high, confirming strength.
5. Target Projection:
The projected move (blue arrowed box) suggests a potential rally of +105.305 points (3.20%), targeting the 3,394.503 level.
This level aligns with previous price structure and acts as the next major resistance.
6. Anticipated Price Path (Black Zigzag Line):
Price is expected to pull back slightly, retesting the wedge breakout or support zone.
After this retest, a bullish continuation toward the target point is projected.
Mr SMC Trading point
---
Summary:
Bias: Bullish
Pattern: Falling wedge breakout + support retest
Entry Zone: Around 3,300–3,320 on a retest
Target: 3,394.503
Invalidation: Strong break and close below 3,244.166
Confirmation: Bullish price action near support + sustained RSI strength
Please support boost 🚀 this analysis)

XAUUSD – Gold at a Key AreaGold is now in a crucial zone with short potential.
If the market provides a valid bearish signal, I’ll take the short.
But if this zone breaks and confirms with a pullback, I’ll switch bias and go long.
💡 Remember:
We don’t control the market — we just try to profit using structure, setups, and solid risk management.
📌 Always risk max 1% per trade.
If the market goes against your bias, you only lose 1% — not your whole account.
🧠 One trade won’t make you rich,
But one reckless trade can destroy everything.
No gambling.
Just discipline, structure, and smart execution.

GOLD/USD Bearish Rejection From Resistance Zone – Potential DropGOLD/USD Bearish Rejection From Resistance Zone – Potential Drop Ahead! 🎯
📊 Technical Analysis Summary:
The chart illustrates a bearish setup forming after multiple rejection points near a key resistance zone around 3,360–3,380 USD.
🔍 Key Observations:
🔴 Double Rejection Pattern:
Red arrows highlight strong bearish rejections from resistance.
Indicates sellers are defending this zone aggressively.
🟠 Support Turned Resistance:
The previous support (labelled as "SUPPOT") is now acting as resistance.
Classic bearish retest behavior.
🔷 Bearish Flag Formation:
Price consolidates in a descending flag pattern.
Breakdown below the flag suggests continuation to the downside.
🎯 Target Zone:
If breakdown confirms, price may drop towards target area near 3,275–3,280 USD (marked as “TARGET FAXS”).
🟧 Important Reaction Zones:
Multiple orange circles indicate zones of high reaction – historically significant for both buyers and sellers.
📌 Conclusion:
Unless bulls reclaim the 3,360–3,380 resistance zone convincingly, the bias remains bearish, and the next leg down may target the 3,280 USD area.
🔔 Traders should watch for a clean break below 3,320 to confirm bearish continuation.

Go short before breaking 3350, go long before falling to 3320📰 News information:
1. Geopolitical situation
2. Tariff implementation and interest rate cut bill
📈 Technical Analysis:
As I said, the US stock market closed early today, and the market will lack some momentum. It is difficult to have a large fluctuation. It is expected to fluctuate and consolidate. I also explained in the previous post that the upper pressure in the short term is at 3340-3350. If it is touched, we can try to short and defend 3360. If it falls back to 3323, we can try to go long for the first time. If it continues to fall, it is expected to reach 3315-3305. Therefore, if it first touches 3323, go long, SL 3316, and consider going long if it touches 15-05 below.
🎯 Trading Points:
SELL 3340-33350
TP 3330-3320-3310-3300
BUY 3323
TP 3333-3340-3350
BUY 3315-3305
TP 3325-3333-3340
In addition to investment, life also includes poetry, distant places, and Allen. Facing the market is actually facing yourself, correcting your shortcomings, confronting your mistakes, and strictly disciplining yourself. I hope my analysis can help you🌐.
TVC:GOLD OANDA:XAUUSD FX:XAUUSD FOREXCOM:XAUUSD PEPPERSTONE:XAUUSD FXOPEN:XAUUSD

Gold accumulates and breaks through 3350 points
⭐️Personal comments:
Gold price rebounded around 3350. There was no important news and bank holidays in the US session on Friday, so it rebounded in the short term
⭐️Set gold price:
🔥Sell gold area: 3365-3367 SL 3372
TP1: $3355
TP2: $3342
TP3: $3330
🔥Buy gold area: $3311-$3313 SL $3306
TP1: $3325
TP2: $3338
TP3: $3350

Gold trend analysis and layout before NFP data📰 News information:
1. Initial jobless claims and NFP data
2. The final decision of the Federal Reserve
📈 Technical Analysis:
Due to the Independence Day holiday this week, the NFP data was released ahead of schedule today, while the policy differences within the Federal Reserve have brought uncertainty to the market. Judging from the market trend, the 4H level shows that the gold price tested the upper track yesterday and then turned to high-level fluctuations after coming under pressure. In the short term, the structure still has bullish momentum after completing the accumulation of power. Although there was a correction in the US market yesterday, it stopped falling and rebounded near 3335, further confirming the strength. At present, the upper resistance in the European session is at 3365-3375, and the short-term support is at 3345-3335 below. Intraday trading still requires good SL to withstand market fluctuations. In terms of trading, it is recommended to mainly go long on callbacks
🎯 Trading Points:
SELL 3365-3375
TP 3350-3340-3335
BUY 3335-3330-3325
TP 3350-3360-3375
In addition to investment, life also includes poetry, distant places, and Allen. Facing the market is actually facing yourself, correcting your shortcomings, confronting your mistakes, and strictly disciplining yourself. I hope my analysis can help you🌐.
FXOPEN:XAUUSD PEPPERSTONE:XAUUSD FOREXCOM:XAUUSD FX:XAUUSD OANDA:XAUUSD TVC:GOLD

GOLD/USD Bullish Reversal and Breakout Target GOLD/USD Bullish Reversal and Breakout Target 🎯 ✨📈
🔍 Technical Analysis Overview:
The chart illustrates a clear bullish reversal pattern following a strong downtrend, with price reacting from a key support zone (highlighted in blue).
Multiple bullish rejection wicks and confirmation candles (green arrows) indicate buying interest at this support.
The recent higher low formation confirms shift in market structure towards bullish bias.
📌 Key Zones:
🟦 Support Zone: Around 3,280 – 3,320 USD
Price respected this zone multiple times (marked with orange circles), confirming its strength.
🟥 Resistance Zone / Target: 3,430 – 3,460 USD
This area aligns with previous swing highs and is the projected target for this bullish move.
📈 Chart Structure:
Break of descending trendline and bullish momentum above support suggests potential continuation towards the marked target.
Falling wedge breakout also aligns with reversal logic.
🎯 Price Target:
3,438.515 USD (resistance area), as labeled on chart with arrow and breakout projection.
🛑 Invalidation Level:
A sustained break below the support zone (3,280 USD) would invalidate this bullish outlook.
📌 Conclusion:
Gold is exhibiting strong bullish behavior with confirmation from price action and structure break. As long as price sustains above support, the path toward 3,438 remains

Bullish Reversal Setup on GOLD/USD Bullish Reversal Setup on GOLD/USD 💰📈
🔍 Chart Analysis:
The chart illustrates a clear bullish reversal structure forming off a strong support zone:
📌 Key Observations:
Multiple Rejections at Support 🟠
The price has reacted to the 3,300 - 3,280 USD support zone multiple times, forming a triple bottom pattern, indicating strong buyer interest.
Bullish Harmonic Pattern ✅
A bullish harmonic pattern (likely a Bat or Gartley) completed right at the support level, triggering a strong reversal with a bullish engulfing candle.
Break of Minor Structure 📊
Price broke through minor resistance near 3,340 USD, confirming bullish momentum. The breakout is supported by a retest shown with the green arrow 🟢.
Target Point Identified 🎯
The projected target is 3,460 USD, marked clearly as the next significant resistance zone. This aligns with previous price rejection areas, making it a high-probability target.
📈 Trading Outlook:
✅ Buy Confirmation: Break and retest of 3,340 USD zone.
🎯 Target: 3,460 USD.
🛡️ Support Zone: 3,300 – 3,280 USD (watch for any breakdown below this).
📌 Conclusion:
The chart signals a high-probability bullish continuation, with strong support, harmonic confluence, and structural breakout. Traders may look for buy opportunities on pullbacks with the target set at 3,460 USD. 🚀📊

XAU/USD) bearish reversal analysis Read The captionTechnical analysis of (XAU/USD) based on price action and technical indicators on the 15-minute timeframe. Here's a
---
Key Technical Insights:
1. Resistance Level (Highlighted Yellow Zone):
Price is approaching a strong resistance zone (previous rejection marked by red arrows).
This area has historically pushed price downward.
2. Trendline Support (Rising Black Line):
Price has been following a short-term ascending trendline, forming higher lows.
A break below this trendline signals potential bearish reversal.
3. EMA 200 (Blue Line):
Price is currently above the EMA 200, indicating short-term bullish momentum.
However, price is testing resistance — a rejection could flip momentum bearish.
4. Bearish Rejection & Projection:
The chart shows an anticipated rejection from resistance, followed by a break of trendline support.
Target zone is marked near 3,228.098, indicating a drop of ~94 points from the current level.
5. RSI (Relative Strength Index):
RSI is nearing overbought territory (68.79).
A bearish divergence or RSI crossing down may confirm weakening momentum.
Mr SMC Trading point
---
Conclusion / Trading Idea:
Bias: Bearish
Entry Zone: Near the resistance level (~3,322)
Confirmation: Break of trendline support
Target: 3,228
Stop-Loss: Above resistance zone (just over the upper trendline)
---
pelas support boost 🚀 this analysis)

XAUUSD/GOLD Geopolitical conflicts have escalated again. Next week is a week of heavy news. How will the gold price focus next week? How to trade? Look at the news preview first.
1. Geopolitics, Russia-Ukraine conflict, Palestine-Israel conflict, Iran-Israel conflict.
2. ADP data, NFP data.
3. Tariff deadline.
The above three news are enough to cause drastic fluctuations in the gold price.
On Friday, the New York market followed my expectations. After rebounding around 3282, it fell back. Finally closed around 3274.
The impact of the weekend news is huge. From the news perspective, the opening price of next Monday will be higher than the closing price on Friday. In terms of operation, you can pay attention to buying at a low price after the market opens.

XAU/USD) bearish Trand analysis Read The captionSMC trading point update
Technical analysis of (XAU/USD) on a short-term timeframe, incorporating several key tools and concepts:
---
Overview of the Analysis
Price Level (Current): Around $3,273.40
EMA 200 (Blue Line): Around $3,337.95 (signaling broader trend)
Resistance Zone (Yellow Box): Between approximately $3,300–$3,320
Support/Target Zone: Around $3,231.11
RSI (Relative Strength Index): At 32.88, which is near oversold territory (below 30)
---
Interpretation of Chart Structure
1. Descending Channel:
Price is moving within a downward-sloping channel.
Suggests a bearish trend is in play.
2. Resistance Level (Yellow Box):
Price is expected to retest this area and face resistance.
Confluence of a supply zone and upper trendline, reinforcing its strength.
3. Projected Price Action:
Price may climb back up into the resistance zone.
A rejection is anticipated, leading to another leg down.
The target is around $3,231.11, which matches previous measured moves.
4. Measured Moves (Blue Arrows):
Highlights historical price drops of ~79 points.
Repeating this pattern suggests symmetry and continuation.
5. RSI Indicator:
Currently at 32.88: nearing oversold, but not quite.
No clear bullish divergence, so price could drop further.
---
Trade Idea Summary
Bias: Bearish
Entry Zone: Near $3,300–$3,320 (resistance)
Target: Around $3,231.11
Invalidation: If price breaks and holds above $3,337–$3,340 (EMA 200 and channel breakout)
Mr SMC Trading point
---
Caution/Considerations
Watch for false breakouts above the resistance zone.
Monitor RSI for potential bullish divergence that could invalidate the downside.
Be cautious around the U.S. economic news event icon, which might cause volatility.
plesse support boost 🚀 this analysis)

XAUUSD/GOLD/SellThe pressure from the bears is too great. In the end, the pressure from above was not broken. Instead, it broke out and fell after being under pressure. The stop loss was hit.
The current price is 3285. After gradually boosting the US dollar index. The trend of gold prices has continued to fall. More importantly, the tariff issue has been eased. At the same time, geopolitical factors are also orderly and stable. This is the news that caused the bears to attack.
History has not become the savior because of repeating itself. Of course, this is also an emergency. In some transactions, the extremely low probability of causing losses is a common problem in transactions. However, our analysis team has stabilized a high trading win rate.
Then the next trading plan is still to focus on the pressure from above. If the London market rebounds above 3300. It is still mainly selling. 3314 is an important level for short-term rebound, and we need to pay attention. Although there is no obvious sign of rebound yet, the release of short-selling pressure has been alleviated because the decline is slow. Today's main trading idea is still to sell at high levels.
The target is to focus on the position of 3264-3248. Remember the risk of buying at low levels. Do not trade independently.
XAUUAD Reversal Setup Short Trade Opportunity Below Resistance Current Price: 3,327.56 USD
Entry Point: 3,332.67 USD
Stop Loss: 3,342.45 USD
Take Profit Levels:
Target 1 (Downside): 3,294.45 USD (-1.17%)
Target 2 (Upside): 3,393.78 USD (+1.50%)
🔧 Technical Indicators & Tools
Trade Line: Upward sloping trendline connecting higher lows, supporting recent bullish structure.
Moving Averages:
Red: Short-term (likely 50-period EMA)
Blue: Long-term (likely 200-period EMA)
Price is still trading below the long-term MA, suggesting broader bearish pressure.
Resistance Zone: 3,334.96–3,341.30 — a key supply area marked in purple.
Support Zone: 3,294.45 — identified as a previous demand level.
⚖️ Risk-Reward Analysis
Short Setup:
Entry: 3,332.67
Stop Loss: 3,342.45 (Risk ~10 USD)
Target: 3,294.45 (Reward ~38 USD)
R:R Ratio ≈ 1:3.8, which is favorable for a short trade.
📌 Summary
Bias: Bearish intraday
Setup Type: Short-sell at resistance zone
Confirmation: Price rejection or bearish candle near 3,334–3,342 zone
Invalidation: Break and close above 3,351.06 (upper resistance)

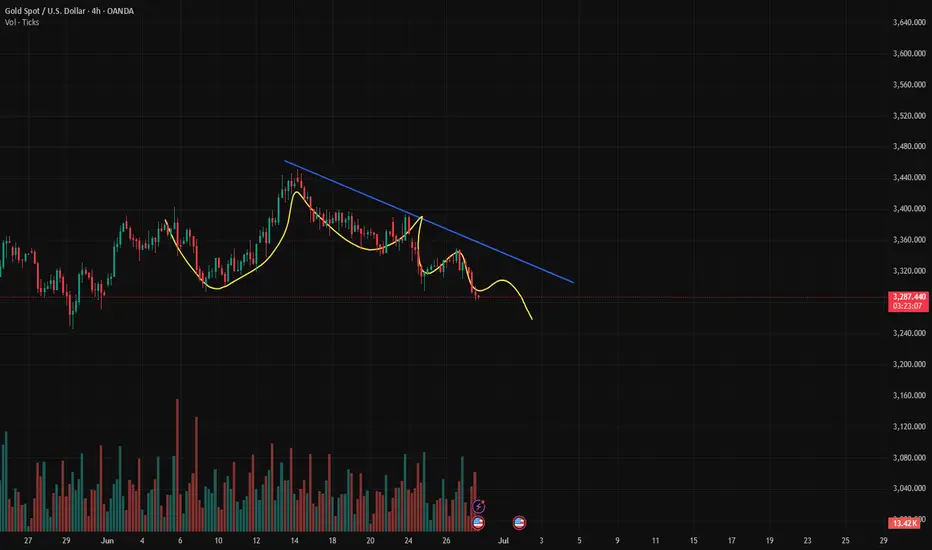
It’s the right time to short goldThe daily gold line presents a three-top gathering pattern. The historical trend shows that the 3290-3280 area has triggered technical pullbacks many times, all of which rebounded to around 3350. The current 4-hour chart trend line suppression level coincides with the Fibonacci 0.618 pullback resistance from the previous high of 3450 to 3300 in the 3350-3360 range. This area constitutes the core pressure zone. If the price fails to effectively break through and stand above 3360 when it probes this area again, it is highly likely to replicate the previous two resistance and fall patterns. At that time, short orders will be arranged based on the 3350 first-line resistance area, with the goal of breaking the key support of 3300 and further looking down at the 3280 and 3260 levels. The overall bearish tendency is maintained, and the resistance to rebound is a signal to enter the market and sell short.
Gold recommendation: Gold is short around 3345-3352, target 3330-3320

XAU/USD) Bullish trand Read The captionSMC trading point update
Technical analysis of Gold (XAU/USD) on the 1-hour timeframe, highlighting a breakout from consolidation supported by key levels and trend structure. Here’s the detailed analysis:
---
Technical Breakdown
1. Key Support Zone
Price has formed a strong base around 3,315–3,325, with multiple bullish rejections (green arrows).
This zone has acted as a demand level, reinforcing bullish structure.
2. Ascending Trendline Support
An uptrend line supports higher lows, showing momentum building to the upside.
3. EMA 200
Price is now challenging the 200 EMA (3,353.41) — a key dynamic resistance.
A successful breakout and retest above this EMA will likely fuel continued bullish movement.
4. Breakout & Measured Move Projections
The chart indicates a bullish breakout from a consolidation box (yellow zone).
Measured move targets based on the previous rally:
First target: 3,368.86 (1.17%)
Second target: 3,381.55 (1.75%)
5. RSI Confirmation
RSI (14) is around 57, showing bullish momentum but still below overbought—supporting further upside potential.
Mr SMC Trading point
---
Conclusion / Idea Summary
Bias: Bullish
Entry Zone: On pullback into 3,330–3,340 range or breakout retest above EMA 200
Targets:
3,368.86
3,381.55
Invalidation: Sustained close below 3,320 and break of the uptrend line
---
Please support boost 🚀 this analysis)

Analysis and layout of the latest gold trend in the evening📰 Impact of news:
1. The ceasefire agreement reached earlier did not take effect, and Trump believed that both sides violated the agreement
2. Federal Reserve Chairman Powell delivered a speech 3 hours later
📈 Market analysis:
After falling below the 3300 mark, gold hit the 3295 line and then rebounded. However, there are too many long orders at the current high level of gold, and the market will not rise easily. The current international situation is so tense, and gold is still slowly declining. It is difficult to rebound sharply in this situation. In the short term, focus on 3290-3280 below. If effective support is obtained, you can go long and look towards 3300-3310. If it falls below the support line of 3290-3280, the downward channel of gold will be opened and it is expected to reach 3265. At the same time, pay attention to the 3328-3338 resistance range on the upside. If the first rebound in the evening encounters pressure and resistance here, you may consider shorting.
🏅 Trading strategies:
SELL 3328-3338-3400
TP 3310-3300-3295
BUY 3290-3280
TP 3300-3310
If you agree with this view, or have a better idea, please leave a message in the comment area. I look forward to hearing different voices.
TVC:GOLD FXOPEN:XAUUSD FOREXCOM:XAUUSD FX:XAUUSD OANDA:XAUUSD

XAU/USD) Bullish reversal analysis Read The captionSMC trading point update
Technical analysis of Gold (XAU/USD) on the 30-minute timeframe, based on technical signals and price action behavior. Here's the breakdown
---
Gold Bullish Reversal Setup – Targeting 3,384
---
Key Technical Highlights:
1. Support Zone & Price Reaction:
Price has tested a strong horizontal support level (highlighted in yellow).
Multiple bullish rejection wicks indicate buying pressure at this zone.
The green arrows show successful support bounces, hinting at bullish intent.
2. Trendline Analysis:
Price bounced near the lower boundary of the falling wedge/downtrend channel.
An uptrend line convergence supports potential reversal.
A breakout above the short-term descending trendline is indicated.
3. EMA & Target Projection:
EMA 200 at 3,364.33 may act as dynamic resistance, the next short-term hurdle.
Target zone projected at 3,384.04, offering a potential move of +65.67 pts (~1.98%).
4. RSI Indicator:
RSI(14) is oversold (~29.93), signaling a potential reversal.
A bullish crossover may be forming, supporting upward momentum.
---
Trading Plan:
Entry Zone: Near current support area around 3,325
Target: 3,384
Stop Loss (Suggested): Below 3,300, under support structure
Risk/Reward: Favorable based on support hold and breakout projection
Mr SMC Trading point
---
Conclusion:
This setup suggests a short-term bullish reversal from a key support area, with confirmation likely if price breaks above the descending trendline and clears the 200 EMA.
Please support boost 🚀 this analysis)

Bearish Continuation Pattern Detected on GOLD/USD Bearish Continuation Pattern Detected on GOLD/USD 📉
📊 Chart Analysis Summary:
The GOLD/USD chart shows a clear bearish continuation pattern, following a rejection from a major resistance zone.
🔍 Key Technical Highlights:
🔺 Resistance Zone:
Strong resistance at 3,420 – 3,440 USD, marked by multiple rejections (🔴 red arrows).
Price formed a Bearish Harmonic Pattern (likely a Gartley or Bat), suggesting reversal from this resistance.
🔻 Bearish Momentum:
After the pattern completed, price broke below the minor support structure and is currently forming lower highs and lower lows, indicating bearish structure.
📉 Support Level:
Strong horizontal support zone around 3,298 – 3,300 USD, marked as “TARGET.”
This area was previously tested (🟠 orange circles) and now projected to act as a target level again.
🔄 Minor Retracement Zone:
Expecting a minor pullback to 3,347 USD (purple line) before potential continuation downward.
This zone aligns with the previous support turned resistance (classic SR flip).
🎯 Target Projection:
Based on the bearish impulse and measured move, the projected target is around 3,298.758 USD, which coincides with the previous support zone.
📌 Conclusion:
The price action suggests a high-probability bearish continuation, targeting the 3,298 USD zone unless the price breaks and holds above 3,347 USD. Traders may consider selling on rallies with a confirmation of rejection at resistance.
📉 Bias: Bearish
📍 Invalidation: Break and daily close above 3,347 USD
📉
📊 Chart Analysis Summary:
The GOLD/USD chart shows a clear bearish continuation pattern, following a rejection from a major resistance zone.
🔍 Key Technical Highlights:
🔺 Resistance Zone:
Strong resistance at 3,420 – 3,440 USD, marked by multiple rejections (🔴 red arrows).
Price formed a Bearish Harmonic Pattern (likely a Gartley or Bat), suggesting reversal from this resistance.
🔻 Bearish Momentum:
After the pattern completed, price broke below the minor support structure and is currently forming lower highs and lower lows, indicating bearish structure.
📉 Support Level:
Strong horizontal support zone around 3,298 – 3,300 USD, marked as “TARGET.”
This area was previously tested (🟠 orange circles) and now projected to act as a target level again.
🔄 Minor Retracement Zone:
Expecting a minor pullback to 3,347 USD (purple line) before potential continuation downward.
This zone aligns with the previous support turned resistance (classic SR flip).
🎯 Target Projection:
Based on the bearish impulse and measured move, the projected target is around 3,298.758 USD, which coincides with the previous support zone.
📌 Conclusion:
The price action suggests a high-probability bearish continuation, targeting the 3,298 USD zone unless the price breaks and holds above 3,347 USD. Traders may consider selling on rallies with a confirmation of rejection at resistance.
📉 Bias: Bearish
📍 Invalidation: Break and daily close above 3,347 USD
