Hecla Mining (HL) — U.S. Silver Leader with Critical-Mineral TaiCompany Overview
Hecla NYSE:HL is a top North American silver & gold producer, anchored by Greens Creek, delivering sustainable, efficient production and leverage to precious-metals upside.
Key Catalysts
Silver = U.S. Critical Mineral (Nov ’25): Elevates strategic importance amid demand from solar, semis, and electrification; global stockpiling tightens supply.
Scale Advantage: Largest U.S. primary silver producer, positioned to capture policy and industrial tailwinds.
Record Quarter: Q3 ’25 EPS $0.15 (~66% beat) alongside strong output and improved balance sheet metrics.
Growth Pipeline: Exploration approvals progressing; Polaris Project slated to begin development in 2026, supporting future resource expansion.
Why It Wins
Direct play on industrial silver demand + monetary hedge
Domestic supply premium as critical-mineral status reshapes procurement
Visible organic growth from sanctioned projects and exploration
Trading Plan
Bullish above: $14.00–$14.50
Target: $21.00–$22.00 — supported by critical-mineral catalysts, production momentum, and a widening silver demand gap.
📌 HL — prime U.S. silver exposure with policy, industrial, and exploration upside.
Goldmining

GoldXAUUSD
- Completed " 12345 " Impulsive Waves
- Change of Characteristics
- Bullish Channel as an corrective pattern in Short Time Frame and Long Time Frame
- Order Block
- Fibonacci Level - 78.60%

GoldXAUUSD
- Rising Wedge as an corrective pattern in Long Time Frame
- Change of Characteristics
- Completed " 12345 " Impulsive Waves
- Fibonacci Level - 38.20% / 50.00%
- Consolidation Phase

GoldXAUUSD
- Change of Characteristics
- Fair Value Gap
- Fibonacci Level - 61.80% / 78.60%
- Bullish Channel as an corrective pattern in Short Time Frame
- Order Block

GDX - Gold Miners ETF: Inverse Head & shouldersGold prices have surged to unprecedented levels in light of recent trade policy changes. The announcement by US President Donald Trump regarding a new 25% tariff on essential imports such as cars, semiconductors, and pharmaceuticals has created a wave of uncertainty among investors. This risk-off sentiment has driven many to seek refuge in safe-haven assets like gold.
Nevertheless, this upward momentum may encounter challenges if a trade agreement with China comes to fruition. A successful deal could alleviate global trade tensions, leading to a decrease in gold demand and possibly resulting in selling pressure.
However sustained high bullion prices could prove to be a significant advantage for gold miners. The GDX ETF is showing a persistent inverse head and shoulders pattern, indicating potential for further gains.

The US dollar and gold rose together, shorting on ralliesGold's price is currently still in an upward cycle boosted by the market's risk aversion. Yesterday, it fell to 3940 and rebounded to 3990. Today, it hit 4000 points at the opening and then retreated again. This is a common trend in recent times. Now every wave of rise must be accompanied by a pullback. At the same time, the US dollar index has been strengthening for several days. We need to be alert to the risk of selling after breaking through the 4000 mark. Furthermore, with the US dollar's continued strength, we must be wary of the risk of a sell-off after breaking through 4000. Market expectations for gold have already been reached, and given the uncertainty surrounding the US government shutdown, a correction in price driven by news is inevitable. Shorting at high levels is still the primary strategy.
Resistance levels: 4000, 4020
Support levels: 3977, 3962
For specific trading decisions, please follow my live updates. I will update my trading ideas and strategies daily. If you don't have a plan or strategy for gold trading and are struggling to achieve consistent profits, you can refer to and follow my updates for guidance and help you avoid mistakes.

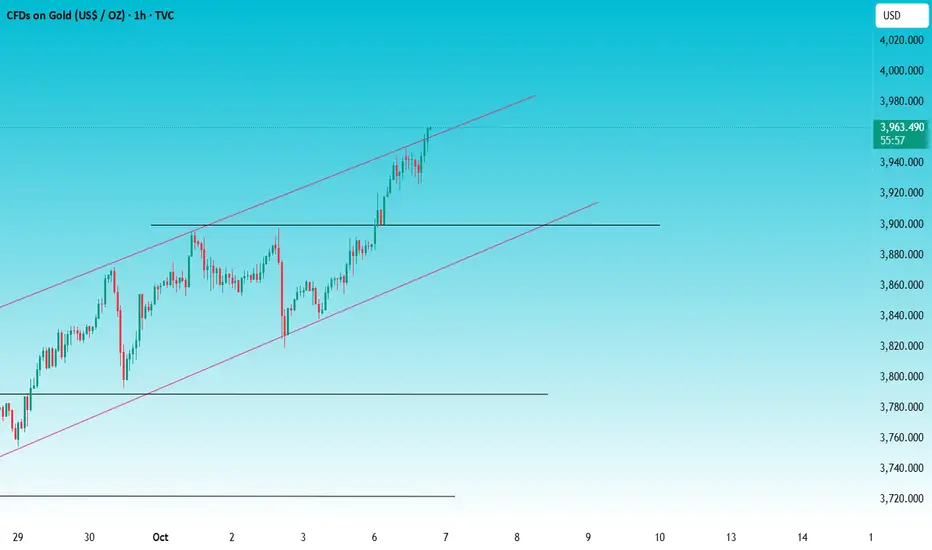
The 3975 resistance is effective, is gold going to fall?The current price of gold has moved out of the previous high-level oscillation range on the daily trend, and has not continued to rise at the 4-hour level. On the hourly level, after continuous high-level oscillations, the technical pattern has begun to gradually weaken. On the small-level cycle trend, the K-line has also begun to slowly maintain a weak trend along the short-term moving average.
The current market situation is just as we mentioned before. The bulls' momentum is obviously insufficient. We have made two consecutive short orders near the 3975 resistance level and both have made good profits. After multiple attacks on 3977 and failure to break through, gold has adjusted and has now fallen below the early low. Pay attention to the support of 3953-3950. If this position is broken, gold will continue to test the support of 3930-3920.
Resistance levels: 3977, 3995
Support levels: 3930, 3900
For specific trading decisions, please follow my live updates. I will update my trading ideas and strategies daily. If you don't have a plan or strategy for gold trading and are struggling to achieve consistent and stable profits, you can refer to and follow my updates for guidance and help you avoid mistakes.

Gold → Continuously hitting new highs, where will the bears go?After today's sharp opening, we shorted gold at 3946. After repeated testing of support at 3930, we took profit. Currently, gold continues to strengthen due to a variety of factors, including the US government shutdown, interest rate cuts, and geopolitical factors. However, the risks of chasing the price higher at this level outweigh the rewards. Gold has seen seven consecutive weeks of strong gains without a single pullback. If a pullback occurs, it would likely start at $100.
On the hourly chart, intraday pullbacks were mild and sustained, with the K-line chart maintaining a relatively strong trend along the short-term moving average. Smaller timeframes exhibited some divergence. Moreover, after gold fell back to 3930 and broke through the resistance level of 3950, it did not rise as much as before, which means that the current position is close to market expectations, and the bullish momentum is not as strong as before. We will continue to consider shorting gold on rallies in the evening.
Resistance levels: 3975, 3995
Support levels: 3930, 3900
For detailed trading decisions, please follow my real-time updates. I will update my trading ideas and strategies daily. If you don’t have a plan or idea about gold trading and cannot achieve sustained and stable profits, you can refer to and follow my updated content as a reference and guidance to help you avoid mistakes.
Gold is falling after rising and focusing on the support of 3930Gold continues its ascent, reaching new highs, posting seven consecutive weeks of strong weekly gains – a rare trend.
This surge is driven by factors such as the US shutdown, growing expectations of interest rate cuts, and geopolitical conflicts. Today's market opened with a surge, and this acceleration suggests continued upward momentum and an unstoppable bullish momentum. Gold's one- and four-hour charts are all bullish, with the moving averages diverging upward in a bullish pattern. Technically, the bulls have broken through the neckline, signaling another upward move.
Our short position entered at 3946 is currently making good profits. Pay attention to the support below 3930. If it falls below this level, we can look at the 3920 line. Keep an eye on support at 3930; a break below this level could see the 3920 level.
For specific trading decisions, please follow my live updates. I will update my trading ideas and strategies daily. If you lack a plan or strategy for gold trading and are struggling to achieve consistent profits, you can refer to and follow my updates for guidance and help avoid mistakes.
Gold surges again, do bears still have a chance?Gold prices surged at the opening bell on Monday! The ongoing US government shutdown has heightened uncertainty, and coupled with widespread speculation that the Federal Reserve will cut interest rates, gold opened the market with full steam, surging upwards and setting new all-time highs.
Technically, the bulls broke through the neckline and are now rising again. The indicator is already significantly overbought, so chasing the bulls at this point is irrational. Today's gains were primarily driven by news.
① The US government shutdown sparked another famous tirade against senators last Friday—the bipartisan temporary funding bills were completely rejected, leaving the door open for a shutdown. Congress is now adjourned until Monday, when the leadership plans to force a fifth vote on the House version of the bill to extend funding until November 21st. This doesn't represent a solution; it's clearly treating the vote as a "game to clear"—the question remains: can the shutdown be resolved on Monday?
② According to CME's "Fed Watch," the probability of the Fed keeping interest rates unchanged in October is 5.4%, and the probability of a 25 basis point rate cut is 94.6%. The probability of the Federal Reserve keeping interest rates unchanged in December is 0.6%, the probability of a cumulative 25 basis point rate cut is 14.5%, and the probability of a cumulative 50 basis point rate cut is 84.9%.
In October, the probability of the Fed keeping interest rates unchanged was only 5.4%, while the probability of a 25 basis point rate cut soared to 94.6%—a virtually guaranteed rate cut. Looking at December, the probability of keeping interest rates unchanged is even lower, at 0.6%, practically negligible. The probability of a cumulative 25 basis point rate cut is only 14.5%, while the probability of a cumulative 50 basis point rate cut is as high as 84.9%. Based on this trend, the Fed's next rate cut pace is likely to be even more aggressive than market expectations!
Last Friday, we set a stop-loss on our short position at 3902. Every rebound is bound to be followed by a pullback. If there's no support below, the market will fall further. In the short term, we will continue to short gold around 3940, waiting for the market to pull back.
For specific trading decisions, please follow my real-time updates. I will update my trading ideas and strategies daily. If you don't have a plan or idea for gold trading and can't achieve consistent and stable profits, you can refer to and follow my updates as a reference and guide to help you avoid mistakes.

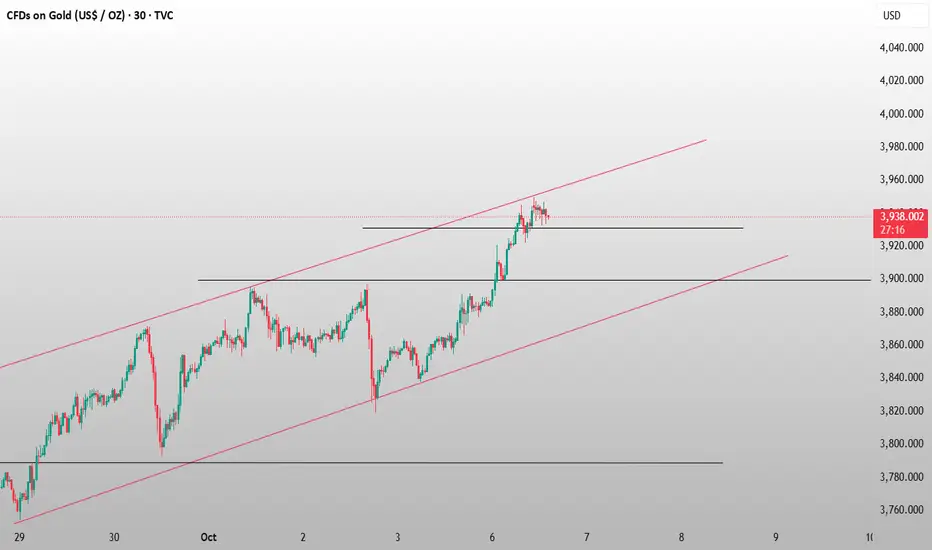
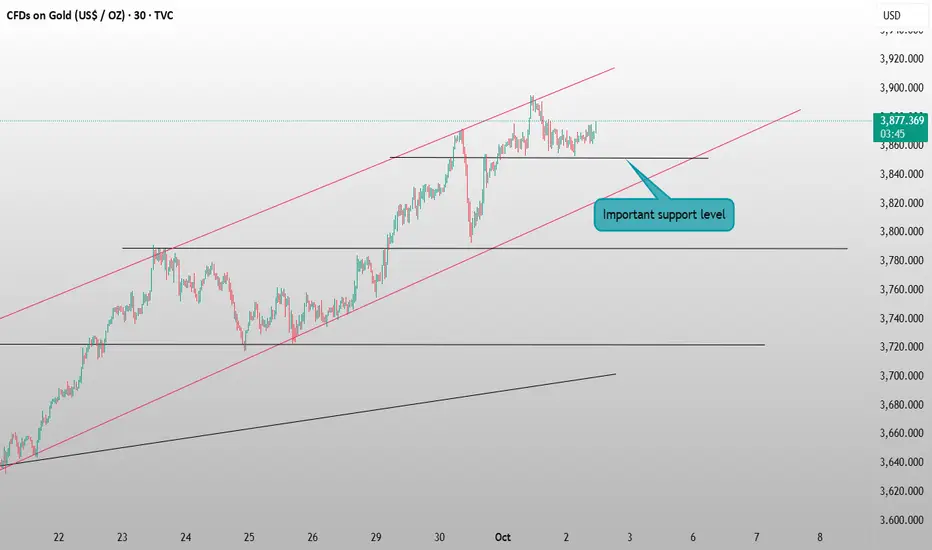
Gold adjustment is not over yet, continue to short at highsGold continued to fluctuate in today's Asian session, failing to initiate a strong rebound and instead fluctuating weakly. This suggests that gold's short-term correction has not concluded and may continue. Today's non-farm payroll report may be delayed, so without supporting data, short-term volatility is likely to continue.
Gold's 1-hour moving average has begun to turn upward, forming a double top pattern. Short-term bulls have yet to re-establish themselves at the gold neckline, indicating continued weakness. Gold rebounded several times but still failed to break through the pressure of 3865. Gold near 3865 in the European session is an opportunity to short on rallies.
Resistance levels: 3865, 3878
Support levels: 3843, 3828
For specific trading decisions, please follow my live updates. I will update my trading ideas and strategies daily. If you lack a gold trading plan or strategy and are struggling to achieve consistent and stable profits, you can refer to and follow my updates for guidance and help avoid mistakes.
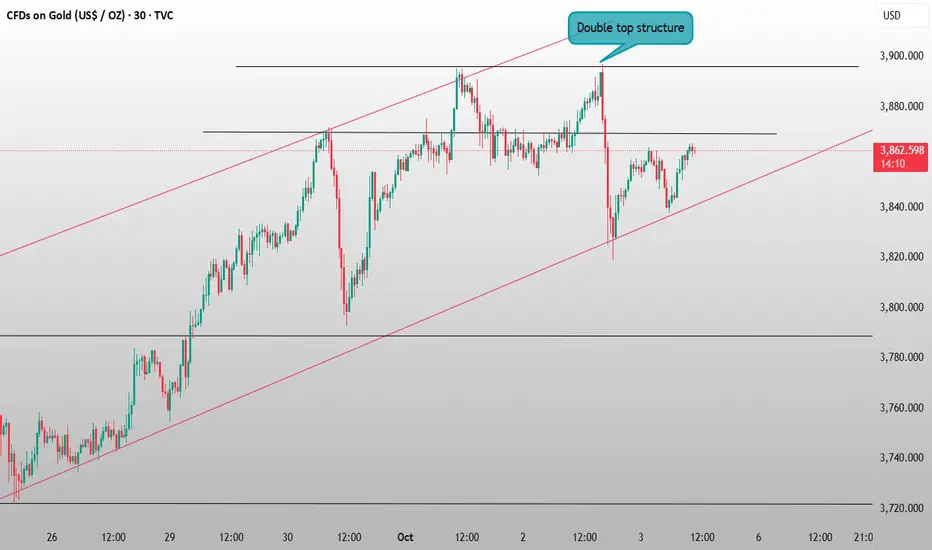
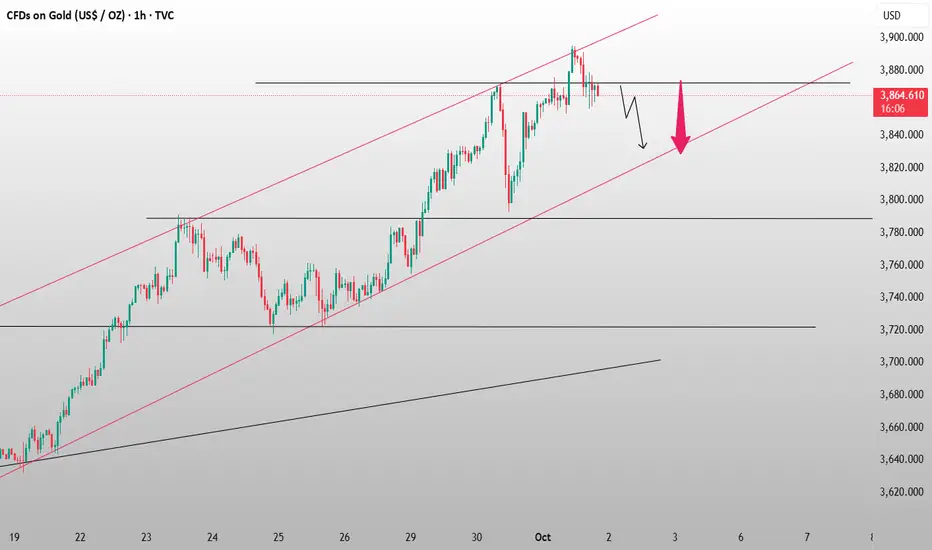
The adjustment is not over yet, continue to short on reboundYesterday, as expected, gold continued its upward trend before retreating, closing with a bearish candlestick pattern with upper and lower shadows. Over the past few days, the market has consistently shown a pattern of prices initially falling from a high before reaching a new high and then plummeting, or initially reaching a low and then breaking a new low before rebounding.
As shown in the above chart, downward support remains strong. Yesterday, after testing the lower limit of the rising trendline, the price began to rebound and is currently testing resistance at the middle limit of the hourly boll line. Today will see the non-farm payroll data. Due to the US government shutdown, there's still uncertainty about whether it will be released, and yesterday's initial jobless claims were also delayed. Regardless of whether the data is released tonight, technically, we can consider the 3895-3820 range.
Trading Recommendation: Short near yesterday's high, long near yesterday's low. Watch for a break of the 3868-3852 range in the Asian session.
Resistance: 3862, 3868, 3885
Support: 3852, 3843, 3828
For specific trading decisions, please follow my live updates. I will update my trading ideas and strategies daily. If you don't have a plan or idea for gold trading and can't achieve consistent and stable profits, you can refer to and follow my updates as a reference and guide to help you avoid mistakes.
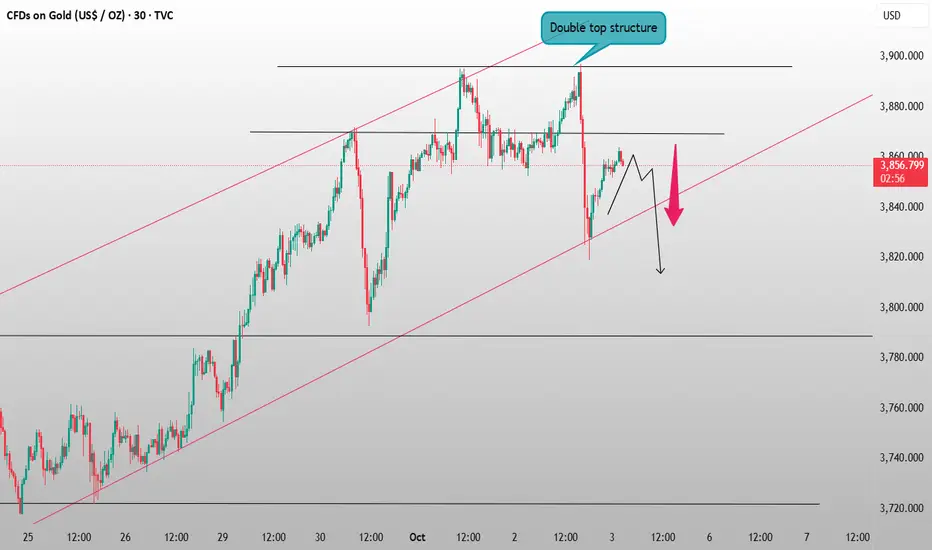
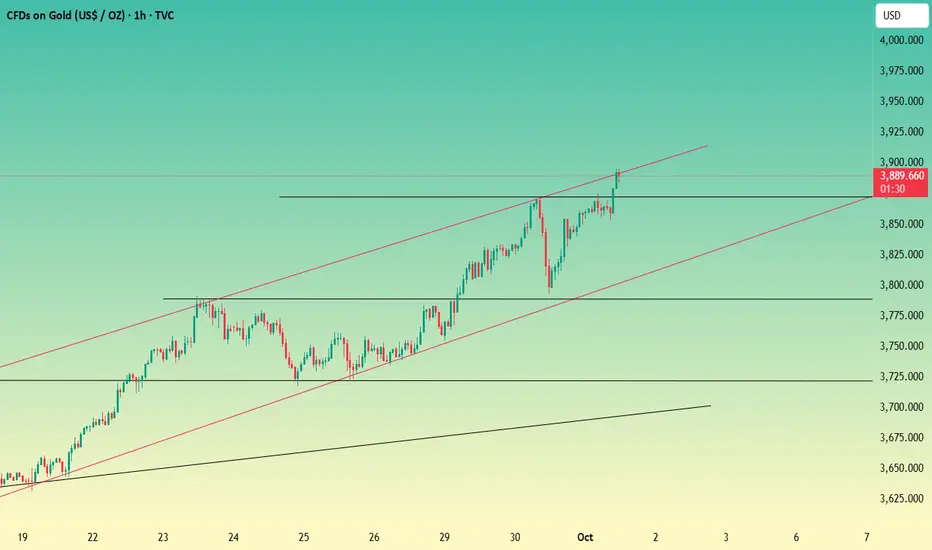
You can buy short orders on reboundWe began warning this morning that gold is about to start fluctuating. Shorting at short-term rebound highs is recommended. We've already achieved good returns by going short directly in the European session.
Gold's 1-hour chart shows the formation of a double top. It has now fallen below 3853 and is testing the initial support level of the uptrend. If this level is broken, it will fall further and test the support levels of 3810-3800. Continue shorting during a rebound in the New York market.
Resistance levels: 3853, 3972
Support levels: 3824, 3812
For specific trading decisions, please follow my live updates. I will update my trading ideas and strategies daily. If you don't have a plan or strategy for gold trading and are struggling to achieve consistent profits, you can refer to and follow my updates for guidance and help you avoid mistakes.

Gold → May rise and then fallToday's day is in a state of slow upward fluctuation, but the short-term bullish performance is not strong. Yesterday's daily line closed with an inverted line. Today, we can see a decline based on the high point of 3895. In the New York market, gold may rise and then fall. The support below is 3862-3852, and the strong support is 3828 to see the rise! If it unexpectedly breaks above 3895, consider going long with a small position!
Resistance levels: 3895, 3925
Support levels: 3853, 3828
For specific trading decisions, please follow my live updates. I update my trading ideas and strategies daily. If you don't have a plan or strategy for gold trading and are struggling to achieve consistent profits, you can refer to and follow my updates for guidance and help avoid mistakes.

Gold → Oscillating pattern, short at high levelGold prices hit a record high of 3895 yesterday before retreating. Unlike previous declines, yesterday's retreat didn't offer the same swift rebound as before. As prices gradually climbed, nearing $600, a divergence in funds among bulls began to emerge. Some investors began to take profits, leading to short-term profit-taking and a short-term correction.
Regarding today's market trends, in the short term, we should keep an eye on support at 3853, a key support point mentioned yesterday. At this time, we should look at it from the perspective of strong fluctuations. That is, the possibility of breaking the high again is not high, so we should arrange the layout around the fluctuation range of 3895~3828. As further breaks above this high are unlikely, we should prioritize range-bound trading between 3895 and 3828.
Resistance levels: 3882, 3895
Support levels: 3853, 3828
For specific trading decisions, please follow my live updates. I will update my trading ideas and strategies daily. If you don’t have a plan or idea about gold trading and cannot achieve sustained and stable profits, you can refer to and follow my updated content as a reference and guidance to help you avoid mistakes.
Pay attention to 3853, and sell short when the price goes high.Currently, gold is fluctuating and adjusting around 3870-72. We have made good profits by shorting gold at 3891. We have already notified the market to lock in profits a few hours ago. From the trend, we can see that the bullish momentum has weakened significantly. At this stage, we just need to wait patiently for gold to break through the support line of 3853.
Resistance: 3875, 3893
Support: 3853, 3828
Gold prices soar, where will the short positions go?Currently, gold is encountering resistance and falling back near 3893-3895, and the bullish momentum has weakened slightly. As mentioned earlier, the current price has reached our risk area. A large part of the reason for today's rise is that the US government has officially shut down. This kind of news-stimulated rise is not long-lasting. After encountering resistance, it will fall like a waterfall. The technical indicators have diverged and are overbought, and most funds cannot participate in long transactions in this extreme rising pattern. In order to increase liquidity, gold also needs a correction, so we consider continuing to short gold near 3893. To increase liquidity, gold also needs a pullback, so we are considering continuing to short gold around 3893.
Resistance: 3900, 3925
Support: 3872, 3843
Gold surged and then fell, continue to short at highsGold showed a trend of rising first and then falling today. The highest point reached around 3872 and then encountered resistance and pulled back. The lowest point reached around 3793 and then stabilized and rebounded upward. The gold daily level is a big positive line, and it is still in a bullish trend. It rose again after a deep correction today, indicating that gold needs to be adjusted. From the perspective of technical analysis at the one-hour level, the gold trend shows an obvious bearish engulfing pattern. For bulls, the market needs to go through a period of consolidation if the uptrend is to resume. Therefore, any rebound presents a shorting opportunity.
Resistance: 3845, 3868
Support: 3791, 3775

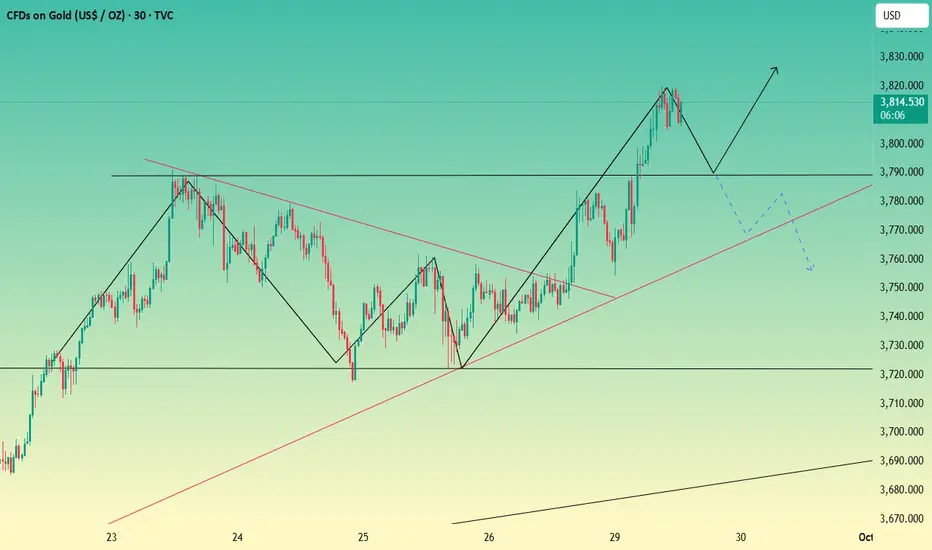
Gold breaks through 3800, should we go short or long?Looking back at the current upward cycle of international gold, the price started from a low of 3313 and has been steadily rising all the way relying on the bull trend. As of now, the cumulative increase has exceeded 500 US dollars. This increase is basically the same as the 500 US dollar band increase caused by changes in tariff policies. From the historical trend, after a similar increase, the market tends to enter the "momentum rebalancing" stage, especially when the price breaks through the key mark of 3810 US dollars, it will officially enter the short-term risk area. The riskiness of this zone stems primarily from the substantial profits accumulated from long positions initiated at $3,313. Some investors are taking profits at high levels, leading to a temporary increase in selling pressure. Based on historical gold fluctuations, after such surges exceeding $500, a typical technical correction typically begins at $100. The core function of this correction is to "digest profit-taking and repair overbought indicators" to accumulate momentum for the subsequent "second bull run", which is a necessary link in the trend continuation process.
Today, I'm considering shorting gold in the 3813-3818 resistance range, with the initial retracement target at 3800-3780.
Due to the rapid market fluctuations, please stay tuned to my channel for detailed trading tips, including execution details for both long and short-term trades. If you'd like, please share your current positions so we can analyze whether it's safer to hold on or adjust and change positions promptly.
Regis Long Term Breakout.Regis has just broken out of a multi-year cup and handle formation & is retesting the previous resistance as support.
If fundamentals remain good and with the price of gold entering its own bull run currently,
we should see solid gains over the coming years.
Last financial year they met their guidence for the first time in years and marks a positive turn around for the company.
If they continue to develop more reserves while hiting production goals they will continue to be strong.

Gold is about to face a stormGold fell continuously but found support around the 3,660 level and began to rebound—just as mentioned yesterday, the 3,658-3,662 range is a top-bottom conversion zone. As long as this level remains unbroken, the bullish trend is not over. However, given the upcoming interest rate decision, we remain bullish but will no longer chase highs, as we need to be cautious of a sudden trend reversal. Remember: the unchanged long-term trend does not mean there will be no corrections amid the uptrend. When most people start celebrating, we must maintain awe for the market. Focus on resistance around 3,685-3,690 and support around 3,658-3,662.
Below are my personal views on the interest rate decision:
It can be said that a rate cut at this meeting is almost a foregone conclusion; the only uncertainty is whether it will be 25 or 50 basis points.
A 25-basis-point rate cut with a hawkish tone (45% probability)
Currently, market expectations for a Fed rate cut are extremely high. The mainstream expectation on Wall Street is three 25-basis-point cuts in September, October, and December, totaling 75 basis points. If the Fed’s statement and Powell’s press conference fail to hint at a further rate cut outlook or implicitly approve a consecutive cut in October, this could well be interpreted as a "hawkish rate cut," and market expectations will tighten afterward. This will be the biggest risk of this meeting—there is potential for a "buy the rumor, sell the fact" move in the short term, pushing the U.S. dollar higher. Conversely, assets like U.S. stocks and gold may face selling pressure due to "bad news after good news," combined with profit-taking and technical overbought conditions.
A 25-basis-point rate cut with neutral-to-dovish wording (45% probability)
Compared with the Fed’s June projections, both the number and magnitude of rate cuts have increased, but Powell maintains ambiguous and neutral wording. This will fully align with current market expectations. In this scenario, the U.S. dollar will likely trade sideways in a lower range in the short term, while assets like U.S. stocks and gold will consolidate in higher ranges. The market will wait for new signals to seek a breakout.
An unexpected 50-basis-point rate cut (10% probability)
This scenario would be like a shot in the arm in the short term. Although most assets (except the weakening U.S. dollar) will benefit temporarily, it may trigger market concerns that the Fed has surrendered to political pressure and lost its independence, as well as deep worries about the U.S. economic situation. At the same time, a sharp U.S. rate cut will drastically narrow the interest rate differential with overseas markets, leading to a tendency for large amounts of U.S. dollar capital to flow out of the U.S. market—this will put short-term pressure on U.S. stocks. Therefore, this scenario may not be a real positive for U.S. stocks. In contrast, gold will benefit as safe-haven demand continues to be boosted.

Can gold continue to rise next week?With the right direction, the journey is not a problem. Time will prove your strength, and strength will win the future. Let trust become profit. The market is ever-changing, and following the trend is the best path. When the trend emerges, act accordingly; don't buy against the tide.
Gold had a relatively perfect week. After a slight pullback on Friday, it rose again. It found resistance around 3656-60 before oscillating and stalling. This level serves as a bridge between the past and the future. Next week's interest rate decision will be a key focus, and both market news and technical indicators are bullish for gold. Let's wait and see. If your current trading is not ideal, I hope I can help you avoid mistakes.
From the 4-hour analysis, the support below is 3628-30, and the short-term bullish strong dividing line is 3600. If the daily level stabilizes above this position, it can continue to maintain the rhythm of pulling back to low and buying in line with the bullish trend. The main strategy is to buy on dips.
I will remind you of the specific operation strategy during the trading session, so please pay attention to it in time.

Pullback for accumulation; bullish momentum remains promising.Gold broke upward against the resistance of the trendline, rising to a high of around 3,658. As indicated in the morning analysis, we have advised everyone to take partial profits first on positions entered below the 3,600 level to lock in gains. From the 1-hour candlestick chart, gold has consistently maintained a "gradual upward movement amid consolidation" rhythm, with lower lows continuing to move higher, and the stability of the trend structure is remarkable.
During a one-sided upward trend, the market's response to data is biased: bullish news will be amplified, while bearish news will be overlooked. One should not rely excessively on data for trading; more seasoned traders understand the logic behind the data and the current market environment.
For subsequent moves, when the price retraces to the hourly support level, those who have already taken profits can continue to follow up with long positions. We will closely track and analyze the market daily. If you lose your direction in such a market, you are welcome to follow us and leave a message for communication to obtain more targeted analysis and trading advice.
