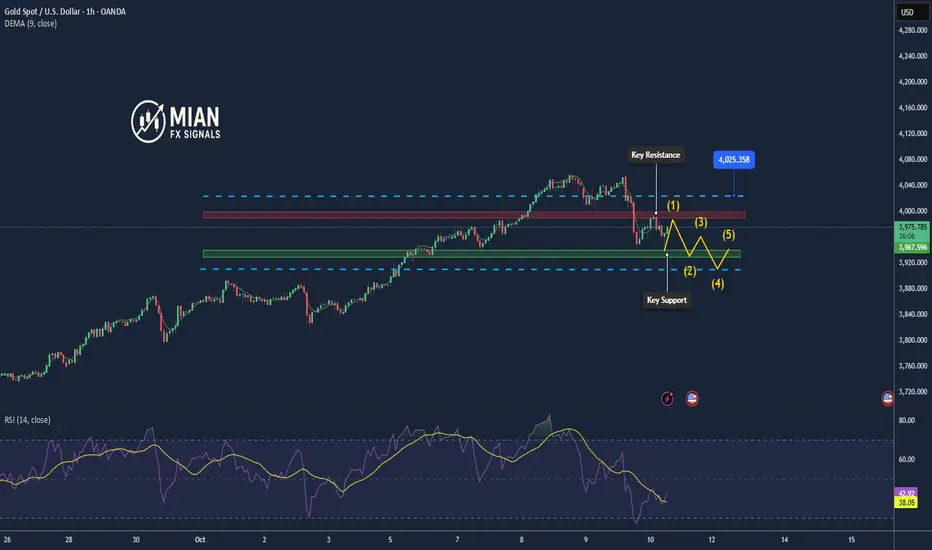
Gold rebounds from lows – key levels to watch: 4100 & 40081. Market Overview
Gold (XAU/USD) recovered from an early drop to $4054, now trading around $4069–$4070 as technical buying emerges near support. The market is consolidating after last week’s decline, with short-term momentum turning neutral.
2. Technical Analysis
• Resistance 1: $4100 – short-term top with EMA50 (H4) confluence.
• Resistance 2: $4135 – strong medium-term barrier.
• Support 1: $4045 – key intraday base.
• Support 2: $4008 – major medium-term floor.
• EMA20 (H1): $4078 acting as dynamic resistance.
• RSI (H1): recovering to 50 → neutral zone.
The overall structure remains slightly bearish, but candles show buyers defending the $4050 area effectively.
3.Outlook
Gold is in a technical recovery within a broader downtrend. A confirmed breakout above $4085–$4100 could target $4118–$4135.
Failure to hold above $4045 may reopen a path toward $4022–$4008.
4.Trading Plan
🔻 SELL XAU/USD : $4102–$4105
🎯 TP: 40 / 80 / 200 pips
🛑 SL: $4109
🔺 BUY XAU/USD: $4045–$4048
🎯 TP: 40 / 80 / 200 pips
🛑 SL: $4041
Goldoutlook

Gold Forecast — Market Turning BullishGold (XAU/USD) maintains a strong long-term bullish trend, supported by rising investor demand and global macroeconomic stability. After completing a healthy correction phase, the market is showing renewed strength, indicating a potential continuation of the broader uptrend.
Current price action reflects accumulation behavior among institutional traders, signaling confidence in gold’s long-term value growth. The consistent pattern of higher lows and steady momentum suggests that buyers are firmly in control, preparing for another upward expansion cycle.
From a fundamental perspective, global inflation concerns, a weaker U.S. dollar, and geopolitical tensions continue to support gold prices. Investors are increasingly seeking protection in safe-haven assets, which further strengthens gold’s long-term position in the market.
Technical structure and sentiment both align with a buy-side outlook, highlighting the potential for gold to extend gains as liquidity continues to build in the current price zones.
In summary, gold remains in a strong buying phase, with market data, investor sentiment, and macroeconomic indicators all favoring sustained upward momentum.
Keywords: Gold forecast, XAU/USD analysis, gold long-term trend, gold price outlook, bullish gold market, gold accumulation phase, forex gold trading, gold price prediction 2025.

Buy Pressure Building on GoldGold is displaying signs of buyer re-entry after a period of controlled downside movement. The recent liquidity sweep around the lower range indicates that short-term selling pressure has been largely absorbed, creating favorable conditions for a potential upward expansion.
Market activity suggests renewed interest from institutional participants accumulating within the current price zone. The consolidation phase appears to be forming a base, signaling the possibility of a directional shift as liquidity gradually migrates upward. Increasing momentum on the lower end of the range reflects confidence returning to the market, setting the stage for a possible continuation toward higher valuation areas.
The outlook remains constructive as long as current accumulation behavior sustains, with market sentiment leaning toward a recovery-driven advance in the near term.

GOLD (XAU/USD) – FINAL GRAND CYCLE ANALYSIS🟡 GOLD (XAU/USD) – FINAL GRAND CYCLE ANALYSIS
“The Rise of Real Money in a Failing Fiat World”
Elliott Waves | Fibonacci | Smart Money | Macro Fundamentals | Market Psychology
📅 Date: October 22, 2025
📍 Current Price: ~$4,039/oz
⏳ Time Horizon: 1970s to post-2050
🎯 Focus: Multi-decade Elliott Wave structure signaling the endgame for fiat currencies
🌐 SUPER CYCLE NARRATIVE – GOLD’S MONETARY METAMORPHOSIS
🔵 Wave I (1971–1980): The Rebirth of Real Money
Gold's first major secular rally began when the Bretton Woods system collapsed and President Nixon ended the U.S. dollar’s convertibility to gold in 1971. Gold soared from around $35 to nearly $875 by 1980. This wave was driven by runaway inflation, the oil embargo, and shattered confidence in fiat money.
🔴 Wave II (1980–1999): The Great Fiat Illusion
Following the 1980 peak, gold entered a brutal 19-year corrective phase, falling to the $250 zone. During this time, the U.S. dollar gained strength, Volcker’s interest rate hikes reined in inflation, and a new era of debt-based prosperity and stock market euphoria unfolded. Gold was dismissed, even by central banks who sold reserves. Structurally, this corrective phase formed a complex WXYXZ pattern , setting the groundwork for the massive Wave III rally.
🟢 Wave III (1999–~2033): The Fiat Reckoning Has Begun
This is the longest and most powerful supercycle wave and the one we are currently in. It is subdivided into five impulsive macro waves. As of now, gold is deep within Wave iii of III , the most explosive phase of the entire structure. The current rally is no longer driven by inflation fears but by existential doubts about the long-term viability of fiat currencies.
📈 Wave I of III (1999–2011): The Institutional Accumulation
Gold rose from around $250 to $1,920 over this period. Triggers included the dot-com bust, 9/11, the 2008 global financial crisis, and the launch of the first gold ETFs like GLD. This wave marked the beginning of institutional interest in gold as a systemic hedge.
📉 Wave II of III (2011–2015): The Disbelief Correction
Gold corrected nearly 45%, bottoming near $1,050. The narrative shifted — QE hadn't caused hyperinflation, the stock market was booming again, and faith in the dollar resurged. Retail abandoned gold, but institutional buyers quietly accumulated from newly created demand zones.
🚀 Wave iii of III (2015–~2026): The True Price Discovery Phase
This is where we are now. Since 2015, gold has exploded upward, driven by COVID-era QE, negative real interest rates, geopolitical instability, and major central banks accumulating gold for cross-border settlements outside the dollar system.
We are currently in the middle of this wave — micro wave (3) of iii — with price around $4,039. According to Fibonacci projections, this wave is expected to peak near $6,552 , corresponding to the 2.618 extension level . If bullish momentum continues, gold could overshoot toward $22,744 , matching the 3.618 Fibonacci extension and marking the likely top of macro Wave III.
In an extreme scenario where fiat trust collapses entirely, the 4.618 extension projects a possible target of $78,940 . All of these levels align with the upper bounds of the long-term logarithmic channel, validating both structure and projections. But most likely this target is for Wave V TOP .
🟣 Wave IV (Projected: 2026–2033): The Great Shakeout
After the parabolic run of Wave iii, a deep multi-year correction is likely. This correction — Wave IV — may retrace toward the long-term red trendline and could coincide with a temporary return to “faith” in fiat through reforms like CBDC rollouts or aggressive fiscal pivots.
This wave could resemble a WXY pattern or large ABC structure and may unfold alongside capital controls, deflationary pressure, and a resurgent tech or dollar narrative. However, this will likely be the last major buying opportunity before gold enters its final, euphoric revaluation.
🟢 Wave V (2033–2045+): The Final Blow-Off Top
Wave V is expected to be driven by an overt crisis of confidence in the global fiat system. Scenarios could include:
Mass adoption of gold-backed or commodity-tied digital currencies
Loss of global trust in the USD as the reserve currency
BRICS or emerging alliances introducing gold into cross-border settlements
Global central banks returning to physical gold as a monetary base
The upside potential here is monumental. The 4.618 Fibonacci extension already targets $78,940 , but under full systemic collapse or monetary reset conditions, gold could reprice toward $100,000–$250,000 per ounce — not as a bubble, but as a return to its role as sound, base-layer money.
📐 Fibonacci Milestones and Structure Alignment
Each major wave has closely respected its corresponding Fibonacci extension. Wave I topped around the 1.618 level ($1,887) . The ongoing Wave iii appears on track to reach the 2.618 level ($6,552) . From there, macro Wave III could stretch toward 3.618 ($22,744) . If Wave V extends fully, a 4.618 projection leads to $78,940 — all within the bounds of the established logarithmic trend channel. In a full-blown systemic reset, price could break even higher.
These levels are not speculative but grounded in structural alignment with Elliott wave geometry , Fibonacci mathematic s, and long-term institutional order flow .
🧠 Smart Money Concepts & Technical Validations
Smart money activity has left clear fingerprints across this cycle. Each break of market structure (in 2016, 2020, and 2023) confirmed higher time-frame bullish continuation. Institutional demand zones — especially during the 2018–2019 consolidation and 2022 pullback — were respected to the dollar.
This cycle isn’t retail-driven mania — it's a stealth institutional accumulation that’s now evolving into price discovery.
📊 Market Psychology Across the Cycle
Investor sentiment has followed classic psychology stages:
From 1999 to 2004, disbelief reigned: “Gold is dead.”
Between 2005 and 2011 came growing awareness: “Gold might work again.”
The 2011–2015 correction brought denial: “It was just a bubble.”
Hope returned in 2016–2020 as price quietly rallied.
From 2022 to 2026, euphoria dominates: “Gold will never go down.”
Wave IV will likely bring fear and capitulation between 2026 and 2033.
Finally, Wave V will ignite mania: “Gold to the moon!”
🚨 Final Synthesis: What This All Means
We are living through the largest repricing of monetary value in modern financial history. Gold is no longer just an inflation hedge — it’s becoming a hedge against the system itself . The structure on the chart doesn't just map price — it maps the collapse of fiat trust and the return of monetary sanity.
Gold is transitioning from:
A commodity hedge →
To a central bank hedge →
To a currency hedge →
And finally, to a system hedge
The current leg — Wave iii of III — is nearing its climax. After a correction in Wave IV, Wave V could take gold into previously unthinkable territory, not because gold changed — but because everything else did.
📌 Final Position Summary
We are currently in wave (5) of iii of III — the most powerful segment of the bull run
The next Fibonacci target is $6,552
The broader Wave III could peak near $22,744
After a correction (Wave IV), the final wave could send gold toward $78,940 , or even into the $100,000–$250,000 zone under extreme monetary reset conditions
This is not a mere forecast — it’s a macro-monetary blueprint for the coming decades.
🌊 "Those who understand the waves will ride them. Those who don’t will be swallowed by the tide." – FIBCOS
📘 Disclaimer: This is an educational market outlook based on technical and macroeconomic structure. It is not financial advice. Always do your own due diligence and risk management.
#XAUUSD #Gold #GoldAnalysis #ElliottWave #Fibonacci #SmartMoneyConcepts #PriceAction #TechnicalAnalysis #MarketStructure #Commodities #InflationHedge #MacroEconomics #CentralBanks #BRICS #MonetaryReset

Gold rebounds sharply but remains volatile – watch 4100 & 4180🟡 Market Overview
After plunging near $4,000/oz, gold quickly rebounded to around $4,138/oz. The rally is now facing resistance near 4,150, as selling pressure emerges again. Market volatility remains high following this morning’s sharp drop.
📊 Technical Analysis
• Support: $4,100 – $4,110 and $4,000 – $4,020
• Resistance: $4,170 – $4,180 and $4,200
• EMA20: price fluctuating around EMA, showing indecision
• Candlestick pattern: long lower wick near $4,000 confirms strong buying interest at major support
💡 Outlook
Gold is in a technical rebound phase, but rapid intraday swings are likely. Holding above $4,100 supports a continued recovery; breaking below $4,090 could trigger a return toward $4,050 or even $4,000.
________________________________________
🎯 Suggested Trading Plan
🔺 BUY XAU/USD: 4,100 – 4,097
🎯 TP: 40 / 80 / 200 pips
🛑 SL: 4,093
🔻 SELL XAU/USD: 4,177 – 4,180
🎯 TP: 40 / 80 / 200 pips
🛑 SL: 4,183

Gold faces a technical correction – watching 4185–4190 zone📊 Market Overview:
Gold (XAU/USD) fell sharply from 4260 to 4190 during the Asian–European sessions before stabilizing near 4195. Selling pressure came mainly from rising US bond yields and a stronger USD. However, the 4185–4190 support area may trigger technical buying in the upcoming US session.
📢Technical Analysis:
• Support: 4185 – 4178 – 4162
• Resistance: 4212 – 4230 – 4250
• Price remains below the EMA50 (H1), keeping the short-term bias bearish.
• Narrowing candles on H1 suggest market compression ahead of the US session.
• A close below 4185 could extend losses toward 4170–4160; holding above may trigger a rebound to 4210–4230.
💡 Outlook:
Gold is in a corrective phase with sellers still dominant. The 4185–4190 zone is a key short-term pivot for direction confirmation.
🎯 Trade Idea:
🔻 SELL XAU/USD : 4225–4228
🎯 TP: 40 / 80 / 200 pips
🛑 SL: 4231

Gold Breaks Out Above 4270, Targeting 43301️⃣ Market Overview
During the U.S. session, gold (XAU/USD) surged sharply, breaking above the key resistance zone of 4270–4280 and reaching 4323, its highest level of the week.
The main drivers were a weaker U.S. dollar and expectations that the Federal Reserve (Fed) may cut interest rates sooner than anticipated.
Additionally, rising geopolitical tensions in the Middle East and Trump’s latest remarks on Ukraine have strengthened safe-haven demand for gold.
2️⃣ Technical Analysis
• Main trend: Strong uptrend, breakout from the 4250–4280 consolidation zone
• Resistance: 4330 – 4345 – 4360
• Support: 4290 – 4275 – 4250
• EMA20 (H1): Strong upward slope, acting as dynamic support
• RSI (H1): Around 68, showing continued bullish momentum with a possible short-term correction
• Candlestick pattern: A bullish engulfing on the H4 timeframe confirms continuation of the uptrend.
3️⃣ Outlook
The current rally shows that buyers remain firmly in control, though after a strong breakout, gold may experience a technical pullback to 4290–4300 before advancing further toward 4330–4345.
As long as the price holds above 4290, the medium-term bullish trend remains intact.
4️⃣ Trading Strategy
🔺 BUY XAU/USD: 4299 – 4302
🎯 TP: 40 / 80 / 200 pips
🛑 SL: 4295
🔻 SELL XAU/USD: 4330 – 4333
🎯 TP: 40 / 80 / 200 pips
🛑 SL: 4337

Gold consolidates around 4264 – safe entries within narrow range🟡 Market Overview
Gold trades around $4264/oz, showing mild bullish pressure during the European session.
The market remains range-bound but buyers still dominate slightly.
Traders are awaiting upcoming Fed remarks and US PMI data for clearer direction.
📊 Technical Analysis
• Resistance: $4272 – $4275 - $4228
• Support: $4255 – $4252 - $4290
• Price stays above EMA50 (H1), maintaining short-term bullish bias.
• Neutral RSI suggests potential sideways accumulation before breakout.
💡 Outlook
Gold is stabilizing within a tight range.
The safe plan is to wait for H1 candle confirmation at either boundary:
• Buy near $4252–$4255 if support holds.
• Sell near $4272–$4275 if rejection occurs.
________________________________________
🎯 Trading Plan
🔻 SELL XAU/USD
Entry: $4272 – $4275
🎯 TP: 40 / 80 / 200 pips
🛑 SL: $4278
🔺 BUY XAU/USD
Entry: $4246 – $4243
🎯 TP: 40 / 80 / 200 pips
🛑 SL: $4240

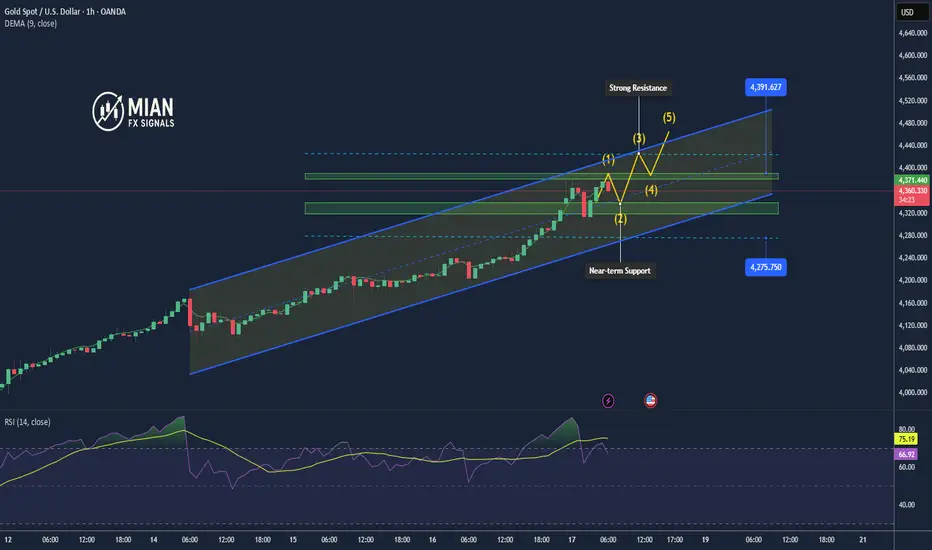
Uptrend Intact: Gold Eyes 4,400 After Sharp Pullback1. Market Overview
After reaching a new all-time high at 4,382, gold experienced a sharp correction down to 4,279, a drop of more than 100 USD/oz in a short time. However, strong dip-buying demand quickly emerged, helping the price rebound and trade back around 4,375, indicating that bullish sentiment remains dominant in the market.
The main drivers are expectations that the Federal Reserve (Fed) will cut interest rates earlier than expected, along with rising geopolitical tensions between major economies — reinforcing gold’s status as a safe-haven asset.
2. Technical Analysis
• Immediate Resistance: 4,382 – 4,390 (all-time high)
• Near-term Support: 4,340 – 4,320
• Major Support: 4,279 (recent correction low)
• EMA 50–100: Still trending upward, confirming that the main trend remains bullish.
• RSI (H1/H4): The overbought condition has been temporarily relieved after the correction, suggesting room for a new upward leg if price holds above 4,340.
3. Outlook
Gold is currently consolidating after a correction phase. If the price remains steady above 4,340, it is likely to continue toward 4,400 – 4,420.
Conversely, a break below 4,320 may trigger short-term profit-taking pressure.
4. Suggested Trading Strategy
🔺 BUY XAU/USD: 4,348 – 4,342
🎯 TP: 40 / 80 / 200 pips
🛑 SL: 4,335
🔻 SELL XAU/USD : 4,425 – 4,428
🎯 TP: 40 / 80 / 200 pips
🛑 SL: 4,431
Gold eases slightly after hitting new all-time high at 4242📊 Market Overview
Gold rallied to a new record high at $4242/oz earlier this morning before easing to around $4235/oz.
The surge was driven by safe-haven demand amid weaker U.S. Treasury yields and rising expectations that the Federal Reserve could begin rate cuts later this year.
Meanwhile, the U.S. dollar paused its recent uptrend, adding more support for gold during the Asian session.
🧭 Technical Analysis
• Trend: Strong Bullish
• Resistance: 4245 – 4250
• Support: 4228 – 4220 – 4210
• EMA20–EMA50: Upward divergence confirms strong bullish momentum
• RSI (H1/H4): Above 70 → signals possible short-term pullback
• Candlestick (H1): Minor correction signals appear, but no clear reversal yet
💡 Outlook
Gold remains in a firm bullish structure, though a short-term correction toward 4220–4225 is possible before the market retests the 4250 resistance zone.
As long as price stays above 4220, the uptrend remains intact and buyers maintain control.
🎯 Trading Plan
🔺 BUY XAU/USD: 4223 – 4220
🎯 Take Profit: 40 / 80 / 200 pips
🛑 Stop Loss: 4217

XAUUSD | Gold Holds Firm as Buyers Dominate the MarketGold continues to demonstrate a strong and orderly bullish structure, with momentum sustained by a combination of market confidence and macroeconomic positioning. The metal’s consistent upward drive reflects ongoing demand for safety amid lingering inflationary concerns and uncertainty surrounding global economic recovery. Institutional accumulation remains visible, suggesting that investors are positioning ahead of potential policy adjustments and currency fluctuations.
The recent moderation phase appears to be a controlled pause rather than weakness, indicating that buyers are maintaining control while the market digests prior gains. Should current stability in yields persist and geopolitical tensions remain elevated, gold could extend its advance in the medium term, reaffirming its role as a key hedge within diversified portfolios.

Gold surges to $4,218 – The bullish wave shows no sign of ending💹 Market Overview
Gold continues its impressive rally, now trading around $4,218/oz, marking a new all-time high.
The main catalyst comes from expectations that the Federal Reserve (Fed) may begin its rate-cutting cycle sooner than expected, following dovish comments from Chair Jerome Powell.
The U.S. dollar weakened further, and Treasury yields declined, boosting safe-haven demand for gold.
Additionally, geopolitical tensions in the Middle East and ongoing U.S.–China trade uncertainties continue to support buying interest in the precious metal.
📊 Technical Analysis
• Main trend: Strong uptrend, price remains above all EMA 20/50/100 levels, confirming solid bullish momentum.
• Key resistance: 4218 – 4225 – 4250
• Short-term support: 4205 – 4200 – 4185
• RSI (H1/H4): Still in the overbought zone (>75), signaling potential for a minor pullback in the short term.
• Volume: Rising along with the breakout — confirming strong and active buying pressure.
🔎 Outlook
Gold is currently in an extended bullish phase, with the 4200–4185 zone acting as key support.
As long as the price holds above 4200, the uptrend is likely to continue toward 4235–4250 in the next session.
However, traders should be aware of potential technical corrections due to overbought conditions.
🎯 Trading Strategy
🔺 BUY XAU/USD : 4206–4203
🎯 TP: 40 / 80 / 200 pips
🛑 SL: 4200

Gold → Ready for the Next Bullish WaveGold (XAUUSD) continues to gain momentum as shifting global conditions drive investors toward safer assets. The ongoing uncertainty in financial markets, coupled with renewed concerns over U.S. fiscal policy and interest rate adjustments, has strengthened gold’s long-term appeal.
Recent market behavior reflects consistent institutional demand, with traders positioning ahead of potential monetary easing cycles. As confidence in traditional currencies weakens, gold remains a preferred store of value for both investors and central banks.
Structurally, the market is maintaining a healthy uptrend, showing controlled corrections within a broader bullish framework. The latest price movements suggest that momentum is building for another upward phase, possibly targeting new historical zones if global instability persists.
In summary, gold’s outlook stays constructive — supported by both macroeconomic sentiment and steady technical momentum.
How do you see the XAUUSD trajectory evolving — continuation of growth or a major pause ahead?

Gold rebounds, uptrend intact1. Market Overview
After a brief dip to $4090, gold (XAU/USD) quickly rebounded strongly to around $4125, showing that buying pressure is still dominant.
Safe-haven demand remains solid as the USD stabilizes and U.S. Treasury yields ease slightly.
However, traders are now more cautious after the previous sharp volatility, keeping gold in a short-term accumulation phase around $4110–$4130.
2. Technical Analysis
• Near Resistance: $4132 – $4140
• Strong Resistance: $4155 – $4168
• Near Support: $4105 – $4090
• Deep Support: $4078 – $4060
• RSI (H1): 58 – Neutral, slightly bullish bias
• EMA20 (H1): $4110 – Trending upward, acting as dynamic support
• Price Structure: Higher low on H1 → confirms continuation of the bullish trend
3. Outlook
Gold remains in a strong bullish structure, and the recent decline is seen as a technical pullback for reaccumulation.
If the price holds above $4110, gold is likely to continue rising toward $4140–$4155 in the next sessions.
Conversely, a break below $4090 would signal a deeper correction toward $4075.
4. Trading Strategy
🔺 BUY XAU/USD
Entry: 4110 – 4105
🎯 TP: 40 / 80 / 200 pips
🛑 SL: 4100
🔻 SELL XAU/USD
Entry: 4150 – 4155
🎯 TP: 40 / 80 / 200 pips
🛑 SL: 4159

Gold weekly forcast with buy and sell levels Las week was the 16th week in a row that we made a profit 1650 pips from entry
full disclosure i closed at 600 pips
This analysis is based on the provided 1-hour XAUUSD (Gold Spot / U.S. Dollar) chart, which shows price action up to approximately October 11, 2025, 16:40 UTC+1. The chart includes Fibonacci Retracement levels applied to a recent strong down move (from 4058.111 down to 3943.547) and identifies potential entry/exit zones.
## Current Market Context (1-Hour Timeframe)
**Price Action:**
The chart shows a significant price drop from a recent high of approximately $4,058, sharply correcting to a low around $3,943. Since hitting the low, the price has been recovering, and the recent candles show strong bullish momentum attempting to push through resistance levels related to the retracement.
**Fibonacci Retracement:**
The retracement is drawn from the swing high (1 or 100%) at **$4,058.111** down to the swing low (0 or 0%) at **$3,943.547**. The current price is hovering between the 50% and 61.8% retracement levels, fighting to hold above the 50% level.
**Key Levels (Based on Fib Retracement):**
| Fib. Level | Price (USD) | Significance |
| :---: | :---: | :--- |
| 100% (High) | $4,058.111 | Major resistance, swing high. |
| 78.6% | $4,08.594 (Typo in OCR, likely $4,038.594 based on visual) | Strong resistance zone. |
| **61.8%** | **$4,014.347** | **Crucial reversal/continuation level (Golden Ratio). The price is currently near this level.** |
| **50.0%** | **$4,000.829** | **Psychological and technical midpoint ($\mathrm{$4,000}$).** |
| 38.2% | $3,987.310 | Minor support after bounce. |
| 23.6% | $3,970.584 | Minor support. |
| 0% (Low) | $3,943.547 | Major support, swing low. |
---
## Buy Levels (Bullish Bias)
A bullish scenario requires the current upward momentum to continue, breaking through the immediate resistance barriers.
**1. Immediate Confirmation Buy (Aggressive/Trend Following):**
* **Target Buy Zone:** **Above $4,024** (Marked as "Buy 4024" on the chart).
* **Rationale:** This area lies just above the 61.8% Fibonacci level ($4,014.347) and likely represents a small resistance zone or previous pivot point. A decisive close above $4,024 signifies strong control by buyers and targets a move toward the 78.6% retracement.
* **Potential Targets:** $4,038.594 (78.6% Fib), followed by $4,050 and the old high at $4,058.111.
**2. Retracement Buy (Conservative/Pullback):**
* **Target Buy Zone:** Near **$4,008** (Previous resistance/support area, near the 50% Fib or labeled Sell level). If the price holds above the 50% Fib ($4,000.829) after touching $4,024 and corrects back down.
* **Rationale:** Buying the retest of the $4,000–$4,008 psychological and technical support region, confirming the breakout above the 50% level.
---
## Sell Levels (Bearish Bias)
A bearish scenario involves the price failing to sustain the current rally and rejecting the key Fibonacci resistance levels, leading to a continuation of the prior downtrend.
**1. Immediate Confirmation Sell:**
* **Target Sell Zone:** **Below $4,008** (Marked as "Sell 4008" on the chart).
* **Rationale:** Failure to hold the 61.8% Fib and a break below the $4,008 level (which is slightly above the $4,000 psychological level/50% Fib) would confirm a rejection of the recovery attempt.
* **Potential Targets:** $3,994, $3,987.310 (38.2% Fib), and $3,970.584 (23.6% Fib).
**2. Continuation Sell (Strong Breakdown):**
* **Target Sell Zone:** A confirmed break and close below the **$4,000.00** psychological level, or specifically below the **38.2% Fib ($3,987.310)**.
* **Rationale:** A move below $3,987 would indicate sellers are aggressively resuming control, likely targeting the low established at $3,943.547.
---
## Technical Outlook Summary
| Scenario | Trigger | Immediate Resistance/Support | Key Target |
| :--- | :--- | :--- | :--- |
| **Bullish** | Sustained close **above $4,024**. | $4,038 (78.6% Fib) | $4,058 (Recent High) |
| **Bearish** | Confirmed move **below $4,008** (and 61.8% Fib). | $4,000 (50% Fib Support) | $3,987 (38.2% Fib) / $3,943 (Swing Low) |
$4,008 and $4,024 appear to be the crucial short-term flip zones determining the next major directional move on this 1-hour chart. The current price is consolidating just around the 61.8% retracement level, making the next few candles critical for confirming direction.

Gold hits new high at $4180, correction risk rising1. Market Overview
During the mid-day session on October 14, gold prices (XAU/USD) continued their upward momentum, reaching $4180/oz, setting a new all-time high.
The main drivers remain expectations of a Federal Reserve policy easing and strong safe-haven demand amid rising geopolitical tensions.
However, after breaking above $4175 and testing $4180, the market is showing signs of mild profit-taking, indicating that bullish momentum is temporarily slowing.
2. Technical Analysis
• Strong Resistance: $4180 – $4192
• Near Support: $4165 – $4158
• Deep Support: $4142 – $4130
• RSI (H1): 81 – Clearly overbought
• EMA20 (H1): $4158 – Acting as dynamic support
• Candlestick Pattern: Consecutive long upper wicks near $4175–$4180 → signal short-term correction pressure.
3. Outlook
Gold continues to hold a very strong bullish trend, but the risk of a technical correction is rising as the market becomes heavily overbought across multiple timeframes.
The $4180–$4192 zone now serves as a key short-term resistance area that may trigger selling pressure.
If the price fails to close an H1 candle above $4180, a pullback toward $4165–$4155 is likely.
Conversely, a break above $4192 with strong volume could push gold toward $4205–$4215 in the short term.
4. Trading Strategy
🔺 BUY XAU/USD: $4158 – $4155
🎯 TP: 40 / 80 / 200 pips
🛑 SL: $4152
🔻 SELL XAU/USD: $4190 – $4193
🎯 TP: 40 / 80 / 200 pips
🛑 SL: $4196

Gold rebounds – Market eyes the $4090–$4100 target📊 Market Overview:
After hitting a new record high at $4,078/oz, gold briefly pulled back to $4,067 before rebounding to $4,075, showing strong buying interest 💰.
Risk aversion remains elevated amid ongoing US–China trade tensions and geopolitical uncertainty.
🧭 Technical Analysis:
• Trend: Strong bullish on H1–H4
• EMA: Price remains above EMA20–50 cluster → short-term uptrend intact
• Resistance: $4,078 – $4,095
• Support: $4,060 – $4,048
• Candle pattern: Bullish rejection candle near $4,067 confirms active buyers
• Momentum: RSI near 68 – strong, not yet overbought
💡 Outlook:
Gold is retesting the $4,078 peak; if an H1 candle closes firmly above it, the next target lies at $4,090–$4,100 🎯.
Otherwise, a short-term pullback toward $4,060–$4,050 could occur before another rally attempt.
________________________________________
🔺 BUY XAU/USD
Entry: $4.069 – $4.072
🎯 TP: 40 / 80 / 200 pips
🛑 SL: $4.066

GOLD (XAUUSD): Bullish! IRL To ERL! Look For Buys!In this Weekly Market Forecast, we will analyze the Gold (XAUUSD) for the week of Oct. 13-17th.
Gold is bullish on all HTFs. Selling is not an option. Moving from IRL to ERL. Only buys are valid.
Enjoy!
May profits be upon you.
Leave any questions or comments in the comment section.
I appreciate any feedback from my viewers!
Like and/or subscribe if you want more accurate analysis.
Thank you so much!
Disclaimer:
I do not provide personal investment advice and I am not a qualified licensed investment advisor.
All information found here, including any ideas, opinions, views, predictions, forecasts, commentaries, suggestions, expressed or implied herein, are for informational, entertainment or educational purposes only and should not be construed as personal investment advice. While the information provided is believed to be accurate, it may include errors or inaccuracies.
I will not and cannot be held liable for any actions you take as a result of anything you read here.
Conduct your own due diligence, or consult a licensed financial advisor or broker before making any and all investment decisions. Any investments, trades, speculations, or decisions made on the basis of any information found on this channel, expressed or implied herein, are committed at your own risk, financial or otherwise.

XAUUSD: Correction failure, aiming for higher priceAfter a sizable dip following the retest of 4057, gold recovered quickly and broke higher after President Donald Trump said he is considering raising tariffs on Chinese imports up to 100%, a headline that jolted broader risk assets and added to geopolitical uncertainty.
Given gold’s safe-haven character and the recent instability across financial markets, a deep correction is unlikely for now. Instead, looking for potential buy entry during slight corrections is safer in the current situation.
Latest update: In today’s session, President Trump told reporters on Sunday (Oct 12) that the war in Gaza “has ended.”
📊 Trading Plan
⇒ With the news situation still unclear for us to know whether gold will decrease or continue to increase strongly, so in today's trading session we should only scalp trade when the price moves to support and resistance zones.
Key Levels
Margin Zone Resistance:
Resistance: ,
=> These resistance zones are derived from concentrated CME Long-call positioning and may elicit reactions if tested.
Margin Zone Support:
Support: ,
Strong Support:
Victor Dan @ ZuperView

Gold hits new ATH at $4,078 – Bullish momentum remains strong📊 Market Overview:
Gold extended its rally on Monday, October 13, reaching a new all-time high at $4,078/oz before retracing slightly to $4,060. Safe-haven demand driven by escalating US–China trade tensions and global uncertainty continues to support the precious metal. Gold ETFs recorded their strongest inflows in the past three weeks.
🧭 Technical Analysis:
• Main trend: Strong bullish (H1–H4)
• EMA: Price firmly above EMA20–50 cluster → sustained uptrend
• Resistance: $4,080 – $4,095
• Support: $4,050 – $4,032
• Candle pattern: Strong bullish rejection candle near $4,050 (buyers still dominant)
• Momentum: RSI holding above 65, no clear overbought signal yet
💡 Outlook:
Momentum remains solid; gold may retest $4,080–$4,100 soon, especially if the USD weakens during the US session. However, traders should stay cautious around this resistance area due to potential technical pullbacks.
🔺 BUY XAU/USD
Entry: $4,057 – $4,060
🎯 TP: 40 / 80 / 200 pips
🛑 SL: $4,054

Gold’s outlook after Friday’s newsA question came in on TradingView about gold’s outlook after Friday’s news.
My analysis methodology is built on a holistic review of exchange data, where options flow plays a central role — something long-time followers of my posts are already familiar with.
So here’s what Friday’s options flow is quietly telling us:
🔸 The bearish put spread (on November option series ) targeting lower levels from October 8th onward is still intact — suggesting downside sentiment remains in play.
Now, let’s be realistic:
Sophisticated players can always flip this position mid-flight by adding futures to hedge — turning it into a neutral or even bullish setup if the rally continues.
After all, we’re dealing with pros with deep pockets — and they don’t like losing money.
They’ll adjust. They’ll hedge. They’ll exit clean.
🔸 Second, Friday’s CME activity leaned bearish (screen attached)— or at least, profit-taking (fixing).
We see call strikes above current price either being closed or re-sold.
Volume is present — but open interest is flat, declining, or even negative.
That tells a story:
No new conviction for higher prices.
Just closing old upside bets.
📌 Bottom line:
The flow doesn't scream "crash coming right now" — but it does whisper:
"Be careful with the longs."

Gold vs Dollar – Bullish Confirmation & Risk Management PlanXAU/USD "The Gold vs US Dollar" - Metal Market Cash Flow Management Strategy ⚡ (Swing/Day Trade)
📊 Trading Plan:
✅ Bias : Bullish confirmation spotted as Hull Moving Average shows an upside pullback trend.
✅ Entry Idea : Flexible entry with layering strategy (scaling in with multiple limit orders) :
$3650
$3660
$3670
$3680
( You can add more layers depending on your risk and strategy preference. )
🛡️ Risk Management:
Suggested Protective Stop Loss : around $3630 (after breakout levels).
⚠️ Note : Please adjust SL based on your personal strategy and risk tolerance — this is not a fixed recommendation.
🎯 Target Outlook:
Short-term resistance expected near $3740 (where moving averages converge + overbought conditions may trigger profit-taking traps).
Idea: secure profits before market reversals.
⚠️ Note : Target levels are flexible. You can adjust according to your own plan and market conditions.
🔑 Key Points:
Hull MA Pullback → signals bullish continuation.
Layered Entry → improves average price & manages volatility.
Exit Discipline → respect your risk plan, don't rely solely on posted SL/TP.
🔗 Related Pairs to Watch (Correlation & Flow):
🟢 OANDA:XAGUSD (Silver/USD) → Often moves in tandem with gold, can confirm metal market strength.
🟢 TVC:DXY (US Dollar Index) → Inverse correlation with gold; weak USD = stronger gold.
🟢 FX:EURUSD → Euro strength usually aligns with gold bullish momentum.
🟢 FX:USDJPY → Safe-haven flows: when JPY strengthens, gold tends to follow.
✨ “If you find value in my analysis, a 👍 and 🚀 boost is much appreciated - it helps me share more setups with the community!”
#XAUUSD #Gold #Forex #DayTrading #SwingTrading #HullMA #TradingStrategy #RiskManagement #Metals #FXAnalysis #DXY #TechnicalAnalysis

Gold Under Correction, Set for Next Move📊 Market Overview
After reaching its historic high of $4059/oz, gold entered a deep correction phase.
Price dropped sharply to $3944, then rebounded technically to around $3990, but buying momentum quickly faded.
Currently, gold is hovering near $3950, reflecting a cautious sentiment around a critical support zone.
📈 Technical Analysis
• Short-term trend: 🔻 Bearish correction
• Key Resistance: 3995 – 4010 | next 4030
• Major Support: 3930 – 3915 | deeper at 3890
• EMA20/50 (H1): Price remains below both → bearish bias intact
• RSI (H1): Flat near neutral zone → no clear reversal yet
• Candlestick pattern: Lower highs on H1/H4 → downward momentum sustained
💡 Market Outlook
Sellers continue to dominate in the short term.
If gold fails to break above 4010, it may extend the decline toward 3915–3890 in the coming sessions.
However, that support area could attract strong buying interest, potentially triggering a rebound.
🎯 Trading Strategy
🔻 SELL XAU/USD: 4009 – 4012
🎯 TP: 40/80/200 pips
🛑 SL: 4015
🔺 BUY XAU/USD: 3898 – 3895
🎯 TP: 40/80/200 pips
🛑 SL: 3885