GOLD: Buyers In Control! Fundamentals Support Higher Prices!Pre-Market analysis for Tuesday Oct 7, 2025
Enjoy!
May profits be upon you.
Leave any questions or comments in the comment section.
I appreciate any feedback from my viewers!
Like and/or subscribe if you want more accurate analysis.
Thank you so much!
Disclaimer:
I do not provide personal investment advice and I am not a qualified licensed investment advisor.
All information found here, including any ideas, opinions, views, predictions, forecasts, commentaries, suggestions, expressed or implied herein, are for informational, entertainment or educational purposes only and should not be construed as personal investment advice. While the information provided is believed to be accurate, it may include errors or inaccuracies.
I will not and cannot be held liable for any actions you take as a result of anything you read here.
Conduct your own due diligence, or consult a licensed financial advisor or broker before making any and all investment decisions. Any investments, trades, speculations, or decisions made on the basis of any information found on this channel, expressed or implied herein, are committed at your own risk, financial or otherwise.
Goldoutlook

Gold climbs as buyers stay in control.📊 Market Overview
Gold (XAU/USD) extended its rise during the European session, breaking above the short-term resistance at $3,952 and is now trading around $3,963. The rebound from $3,940 support shows that technical buying remains strong, as traders expect the Fed to keep rates lower for longer.
🔍 Technical Analysis
• Immediate resistance: $3,965 – $3,970
• Major resistance: $3,980
• Support: $3,945 – $3,950
• EMA 50 (H1): trending upward, signaling short-term bullish momentum
• RSI (H1): around 63, showing room for further upside before overbought levels
If gold holds above $3,952, the short-term uptrend remains valid, with upside targets at $3,970–$3,980. However, a rejection candle near $3,970 may trigger a short correction back toward $3,950.
💡 Outlook
Short-term trend: Mildly bullish, but traders should watch for reaction near $3,970, a key level that could decide whether gold extends higher or retraces.
🎯 Trading Plan
🔺 BUY XAU/USD
• Entry: $3,955 – $3,952
• TP: 40/80/200 pips
• SL: $3,949

Gold holds above $3940 – Watching reaction at $3970📊 Market Overview
Gold (XAU/USD) continues to trade firmly within the $3938–$3946 range, maintaining strength after a brief pullback in the Asian session.
Market sentiment remains risk-off, with safe-haven demand supported by geopolitical tensions and expectations that the Fed could cut rates sooner.
The US dollar is slightly weaker, while lower Treasury yields are helping gold stay near its highest level since early October.
📈 Technical Analysis
• Main trend: Short-term uptrend remains dominant.
• EMA20 – EMA50 (H1): Bullish crossover with widening gap → strong continuation signal.
• RSI (H1): Holding between 68–72 → strong momentum, slight overbought signals possible.
• Candlestick pattern: Consecutive bullish candles with long lower wicks confirm steady buying interest.
Key resistance zones:
• $3955 – $3960 → Immediate resistance (recent local top)
• $3970 – $3985 → Major resistance, likely profit-taking zone for buyers
• $4000 – $4010 → Psychological resistance and potential overbought level
Key support zones:
• $3920 – $3910 → Near-term support, previous reaction zone
• $3895 – $3885 → Medium-term support, aligned with EMA50 (H4)
• $3855 – $3840 → Deep support, lower bound of previous consolidation
💡 Outlook
Gold remains in a stable uptrend with no clear weakness so far.
As long as the price holds above $3910, the bullish structure is intact.
Buyers can continue to buy the dip, while sellers should wait for a strong reversal pattern near $3970 – $3985 before shorting.
🎯 Trading Strategy
🔺 BUY XAU/USD: 3913 – 3910
🎯 TP: 40/80/200 pips
🛑 SL: 3907
🔻 SELL XAU/USD: 3982 – 3985
🎯 TP: 40/80/200 pips
🛑 SL: 3988

XAUUSD: Bullish momentum is sustainedOANDA:XAUUSD continues to push to new highs with no signs of weakening momentum . I do not expect a sharp decline in the near term, and at this time we should stand aside and continue to observe price action before making any trading decisions.
Price is approaching a large liquidity area (Margin Zone) , where CME participants accept trading at high value . Therefore, this is the objective price may reach in today’s session.
Contingency at this level hosts a sizable cluster of CME long calls , so price may overshoot the Margin Zone and tag 3976 before a minor pullback.
Margin Zone:
Strong resistance:
Key support:
The levels above are areas where price may react and potentially reverse. However, at present, trading in a high value area without structure confirmation is extremely risky.
⇒ We should stand outside in today’s session and wait for the next price action.
Please like and comment below to support our traders. Your reactions motivate us to produce more analysis in the future 🙏✨
Victor Dan @ ZuperView

Gold Consolidates Before Next Big Move📊 Market Developments:
After approaching $3,900, gold stalled due to profit-taking pressure. The market is currently in consolidation, waiting for fresh U.S. economic data.
📉 Technical Analysis:
• Near resistance: $3,900
• Stronger resistance: $3,940
• Near support: $3,800
• Stronger support: $3,760
• EMA 09: Price remains above EMA, confirming the primary uptrend.
• Candlestick / momentum: Short-term overbought signals suggest a possible pullback toward support before another push higher.
📌 Outlook:
Gold may range sideways and retest the $3,800 – $3,760 support area before heading back toward the $3,900 – $3,940 resistance zone.
💡 Trading Strategy:
🔻 SELL XAU/USD : $3,935 – $3,940
🎯 TP: 40 / 80 / 200 pips
❌ SL: $3,943
🔺 BUY XAU/USD: $3,760 – $3,763
🎯 TP: 40 / 80 / 200 pips
❌ SL: $3,757

Gold Holds Gains After Hitting 3,877 USD – Testing 3,880 Resista📊 Market Overview
Gold has climbed to 3,877 USD/ounce, approaching the short-term resistance at 3,880. The rally is supported by expectations of Fed rate cuts amid the ongoing U.S. government shutdown, boosting safe-haven demand.
📉 Technical Analysis
• Nearest Resistance: 3,880 USD/ounce
• Farther Resistance: 3,895 – 3,900 USD/ounce (psychological level, strong selling zone)
• Nearest Support: 3,862 USD/ounce
• Farther Support: 3,850 USD/ounce → if broken, risk of deeper correction toward 3,820.
• EMA 09: Price remains above EMA → bullish short-term trend.
• Candlestick / Volume / Momentum: Bullish candles with stable volume, momentum stays positive but is slowing down near 3,875–3,880.
📌 Outlook
If gold breaks above 3,880 decisively, the uptrend could extend to 3,895–3,900. Conversely, losing 3,862 would increase selling pressure, potentially pulling price back to 3,850.
💡 Suggested Trading Strategy
• BUY XAU/USD on retest of 3,862 – 3,865
• 🎯 TP: 3,880 – 3,895 – 3,900
• ❌ SL: 3,857

Gold Adjusts After Hitting 3,895 USD Peak📊 Market Overview:
Gold reached a record high of 3,895 USD/ounce before correcting down to 3,866 USD/ounce. This adjustment occurred after a strong rally driven by safe-haven demand amid U.S. political uncertainty and expectations of a Fed rate cut.
📉 Technical Analysis:
• Nearest Resistance: 3,900 USD/ounce
• Farther Resistance: 3,950 USD/ounce → psychological level and previous strong selling zone; if surpassed, the uptrend may continue.
• Nearest Support: 3,850 USD/ounce
• Farther Support: 3,820 USD/ounce → key level in case of a strong pullback, likely to trigger significant buying.
• EMA: Price is above EMA 09 → bullish trend.
• Candlestick / Volume / Momentum: Bullish candlestick pattern with increasing volume indicates strong buying pressure, but watch price reaction near resistance 3,900–3,950.
📌 Market Outlook:
Gold may continue rising if buying pressure persists and the Fed cuts interest rates. However, if the price fails to hold 3,850, it could test the farther support at 3,820.
💡 Suggested Trading Strategy:
BUY XAU/USD : 3,850 - 3847
🎯 TP: 40/80/200 pips
❌ SL: 3,844 USD

Gold Market Analysis – Sell Opportunity Emerging in XAU/USDGold has been climbing with strong momentum, but the current leg is showing signs of transition. After a period of consolidation, the market expanded upward, taking liquidity from previous highs and creating an extended run. This behavior often reflects the final stage of a bullish cycle before rebalancing begins.
What stands out now is the engineered path of price: a push into untested liquidity zones above, followed by a potential shift as large players unwind positions. Once liquidity is collected at the extremes, price tends to rotate back into inefficiencies left behind during the rapid climb.
This suggests gold is not simply trending higher, but moving through a liquidity cycle. The near-term structure favors a sweep of higher levels, then a corrective phase where price retraces to refill imbalances and reset order flow for the next directional move.

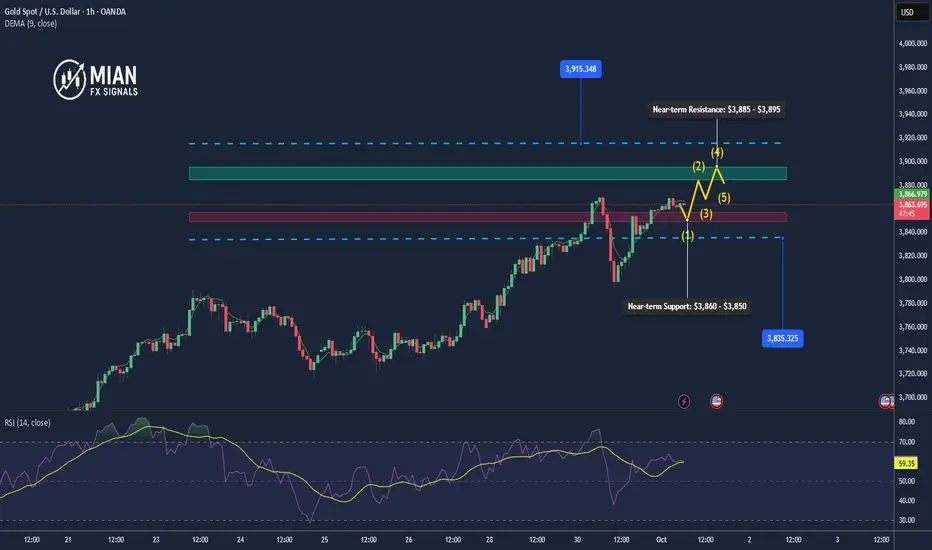
Gold Pulls Back After Hitting $3,895 – Consolidation Before 3900📊 Market Overview
Gold reached a new high at $3,895, approaching the psychological $3,900 level, before facing profit-taking pressure and retreating toward $3,885. The market shows caution when testing strong resistance, as the USD remains weak and safe-haven demand persists.
📈 Technical Analysis
• Near-term Resistance: $3,895 – $3,900
• Strong Resistance: $3,915
• Near-term Support: $3,873 – $3,870
• Strong Support: $3,860 – $3,850
• EMA20 (H1): Price remains above EMA20, keeping the short-term uptrend intact.
• H1 Candlestick: Long upper wick at $3,895 indicates strong selling pressure at resistance, raising the risk of a short-term pullback.
📌 Outlook
Gold maintains its short-term bullish trend, but the $3,895–$3,900 zone remains a key barrier. A breakout could push price to $3,915, while a correction to $3,880–$3,872 would be normal consolidation before further gains. A break below $3,872 may drive price toward $3,860.
🎯 Trading Strategy
🔺 BUY XAU/USD
• Entry: $3,872 – $3,869
• 🎯 TP: 40 / 80 / 200 pips
• 🛑 SL: $3,866

Short-term Bullish with Key Resistance Ahead📊 Market Overview
Gold is currently trading around $3,876.80/oz, after a strong rally in the previous session. Buying pressure remains stable as the USD shows signs of weakness, while safe-haven demand stays elevated. However, the market is cautious ahead of upcoming U.S. economic data releases.
📈 Technical Analysis
• Near-term Resistance: $3,885 – $3,895
• Strong Resistance: $3,915
• Near-term Support: $3,860 – $3,850
• Strong Support: $3,835
• EMA20 (H1): Price is holding above EMA20, indicating that the short-term uptrend remains intact.
• H1 Candlestick: Small-bodied candles suggest slowing bullish momentum, with potential for a technical pullback before resuming the trend.
📌 Outlook
Gold maintains a short-term bullish trend, but the $3,885–$3,895 zone will be a key challenge. A breakout above this level could drive price toward the psychological $3,900 mark and further to $3,915. Conversely, if profit-taking increases, price may retest the $3,860–$3,850 support zone.
🎯 Trading Strategy
🔺 BUY XAU/USD: $3,845 – $3,850
• 🎯 TP: 40 / 80 / 200 pips
• 🛑 SL: $3,840
🔻 SELL XAU/USD: $3,885 – $3,895
• 🎯 TP: 40 / 80 / 200 pips
• 🛑 SL: $3,900
XAU/USD 30 September 2025 Intraday AnalysisH4 Analysis:
-> Swing: Bullish.
-> Internal: Bullish.
Price printed as per yesterday's intraday analysis whereby I mentioned in alternative scenario that price could print higher.
Price is currently trading within an internal low and fractal high. CHoCH positioning is denoted with a blue horizontal dotted line.
Intraday Expectation:
Price to print bearish CHoCH to indicate bearish pullback phase initiation, price to then trade down to either discount of internal 50% EQ, or H4 supply zone before targeting weak internal high priced at 3,871.890.
Alternative scenario: Price could potentially print higher-highs.
Note:
The Federal Reserve’s sustained dovish stance, coupled with ongoing geopolitical uncertainties, is likely to prolong heightened volatility in the gold market. Given this elevated risk environment, traders should exercise caution and recalibrate risk management strategies to navigate potential price fluctuations effectively.
Additionally, gold pricing remains sensitive to broader macroeconomic developments, including policy decisions under President Trump. Shifts in geopolitical strategy and economic directives could further amplify uncertainty, contributing to market repricing dynamics.
H4 Chart:
M15 Analysis:
-> Swing: Bullish.
-> Internal: Bullish.
As per alternative scenario of yesterday's intraday analysis, price continued to push higher.
Price subsequently printed a bearish CHoCH before continuing with it's bullish momentum, however, I shall not classify this due to the very insignificant pullback. This has been marked in red.
Price is currently trading within an established internal range.
Intraday Expectation:
Price to trade down to either M15 supply zone, or discount of 50% EQ before targeting weak internal high priced at 3,871.890.
Alternative Scenario: Price could potentially target strong internal low as H4 TF enters it's bearish pullback phase.
Note:
Gold remains highly volatile amid the Federal Reserve's continued dovish stance, persistent and escalating geopolitical uncertainties. Traders should implement robust risk management strategies and remain vigilant, as price swings may become more pronounced in this elevated volatility environment.
Additionally, President Trump’s recent tariff announcements are expected to further amplify market turbulence, potentially triggering sharp price fluctuations and whipsaws.
M15 Chart:

9.30 Gold continues to hit new highsThe gold market continued to rise yesterday. It opened at 3759.9 in the morning and then fell back. The daily low was 3756.3 and then the market fluctuated and rose strongly. The daily high touched the daily high of 3834.2 and then consolidated. The daily line finally closed at 3833.9. The daily line closed with a saturated large bullish candle with a slight shadow. After ending this pattern, today's market retraced to more levels. In terms of points, the long positions at 3325 and 3322 below and the long positions at 3368-3370 last week and the long positions at 3377, 3385 and 3563 were reduced and the stop loss was followed up at 3650. Today's long positions at 3805 are conservative at 3802, and the stop loss is 3798. The target is 3838, 3845 and 3852-3855 pressure.
Gold rebounds, sideways 3740 – 3755📊 Market Developments
After dropping from 3754 to 3740, gold quickly rebounded and is now trading around 3753. Buyers have stepped in strongly at the support zone, but the overall trend has yet to break out.
📉 Technical Analysis
• Near resistance: 3755 – 3765
• Strong resistance: 3780
• Near support: 3740 – 3735
• Key support: 3700
• Price is fluctuating around the EMA50, showing short-term sideways movement, while the overall trend remains slightly bearish.
📌 Outlook
Gold continues to move within the 3740 – 3755 range. Buying pressure holds the price above 3740, but selling pressure emerges strongly at 3755. A clear breakout is needed to determine the next move.
🎯 Trading Strategy
🔻 SELL XAU/USD : 3762 – 3765
🎯 TP: 40/80/200 pips
🛑 SL: 3768
🔺 BUY XAU/USD : 3695 – 3700
🎯 TP: 40/80/200 pips
🛑 SL: 3692

Algo Games Begin Below 3748…🔱 GoldRush_Traders Forecast
🕰️ Based on 22:00 UK close (Thursday 25th Sep)
⚠️ Forecast the reaction — not just the level.
🔵 SCENARIO OUTLOOK:
✅ BULLISH:
• 3720–3736 holds firm
• Reclaim 3748 → Target 3757 / 3768
• EMAs re-stack bullish on 5m/15m
• NY continuation possible if DXY weakens
❌ BEARISH:
• Clean break below 3720 → 3708 / 3695 next
• EMA structure breaks down with volume
• DXY strength could force deeper flush
🔁 SIDEWAYS / TRAP:
• Range between 3732–3745
• Sweeps both sides before true move
• Algo bait during low liquidity zones
🧠 Tip: "Don’t trade the level – trade the reaction."

Gold Record Highs Under the Lens of ATAI VPA & VPRCGold Analysis Report
In recent days, as gold has reached new historical highs, two analytical tools have been used to assess the market conditions:
- ATAI Volume analysis with price action V 1.03
- ATAI Volume Pressure Analyzer (VPA)
It is important to emphasize that the gold market is heavily influenced by global economic and political events, and precise volume data is not publicly available. The only volume data considered here comes from OANDA. For this evaluation, a 70-day period has been chosen to study the broader behavioral and volume pattern of gold over the past two months.
Bull Trap Risk Detection (ATAI Volume analysis with price action V 1.03)
In this indicator, Bull Trap detection is based on the interaction of price behavior and order-flow volume. The logic is as follows:
1. Bull Sweep (False Breakout with Long Wick)
- If price exceeds the recent high (`high_level`) but closes back below it, and the upper wick of the candle makes up a sufficiently large fraction of the total range, then a Bull Sweep is detected.
- Formula:
upper_wick_ratio = (high - max(open, close)) / (high - low)
Condition: upper_wick_ratio >= trap_wick_threshold (e.g., 0.6)
2. Bull Break
- If the close is above the breakout level without a long wick, it is treated as a Bull Break.
3. Mismatch Condition
- If the candle is bullish (close > open) but delta ≤ 0 or seller ratio > 50%, then there is a mismatch between price action and order flow.
- Formula (simplified):
mismatchBull = (close > open) and (delta <= 0 or seller_ratio > 0.5)
4. Dominance Inversion
- If buyer volume ranks highest in the lookback window, but cumulative seller volume is greater than buyer volume while the candle is bullish, a dominance inversion occurs.
- Condition:
domInvBull = (rank_buy == 1) and (sum_sell > sum_buy) and (close > open)
5. Low Volume Breakout
- If a bullish breakout occurs with total volume less than the average total volume, then the breakout is flagged as low-volume.
- Condition:
lowVolBull = isBullBreak and (TF_tot < avg_tot)
The module assigns scores to these conditions:
- Sweep: +2
- Break: +1
- Mismatch: +2
- Dominance Inversion: +2
- Low-volume Break: +1
If total score ≥ trap_score_risk (default = 3), then a Bull Trap Risk is flagged. If, within `trap_confirm_bars`, price reverses and closes back below the breakout level, then Bull Trap Risk Confirmed is displayed.
Complementary View (ATAI Volume Pressure Analyzer – VPA)
The VPA indicator, with its left (C→B) and right (B→A) wings and offset capability, allows a parallel evaluation of flow balance. In the current gold chart, the right wing (B→A) reflects weakness on the buyers' side, reinforcing the Bull Trap risk detected by the previous indicator. This alignment strengthens the probability of a bearish scenario.
However, the extent of any downward path will depend on the pivotal price levels where the largest buy and sell volumes were registered over the past 70 days. These are represented by points B1 and S1, clustered around the 3409 USD level.
Notes
- On lower timeframes, accuracy in buy/sell volume calculation depends on the data window. Here, a 1-minute timeframe was selected, which provides ~74 days of buy/sell flow data.
- Gold remains highly sensitive to political and economic news globally.
- This analysis is based solely on mathematical calculations and volume/behavioral pattern recognition. It must not be interpreted as investment advice of any kind.

GOLD (XAUUSD): Bullish! Continue To Buy! In this Weekly Market Forecast, we will analyze the Gold (XAUUSD) for the week of Sept. 22 - 26th.
Gold is bullish on all HTFs. Selling is not an option. Wait for a pullback, and jump on the uptown train! Dips are your friend, so be patient and wait this market to take a breather.
Selling is only valid when there is a bearish break of structure. Until that happens, buy it, my friend.
Be wary of the pullback, as that move is likely to be corrected, but that would set up a great long opportunity!
Enjoy!
May profits be upon you.
Leave any questions or comments in the comment section.
I appreciate any feedback from my viewers!
Like and/or subscribe if you want more accurate analysis.
Thank you so much!
Disclaimer:
I do not provide personal investment advice and I am not a qualified licensed investment advisor.
All information found here, including any ideas, opinions, views, predictions, forecasts, commentaries, suggestions, expressed or implied herein, are for informational, entertainment or educational purposes only and should not be construed as personal investment advice. While the information provided is believed to be accurate, it may include errors or inaccuracies.
I will not and cannot be held liable for any actions you take as a result of anything you read here.
Conduct your own due diligence, or consult a licensed financial advisor or broker before making any and all investment decisions. Any investments, trades, speculations, or decisions made on the basis of any information found on this channel, expressed or implied herein, are committed at your own risk, financial or otherwise.

Gold Price Today: XAUUSD Sets Stage for Continued Bullish ExpansGold (XAUUSD) Market Report – September 21, 2025
Gold remains positioned near 3,685, with recent price behavior showing a structured climb despite short bursts of volatility. The market is cycling through phases of expansion and retracement, where each corrective leg has been followed by renewed upward momentum. This rhythm signals that buyers are steadily maintaining control of the broader trend.
The current setup reflects a market that is rebalancing efficiently. Short-term pullbacks are being absorbed quickly, keeping pressure aligned toward the upside. The sequence of structural shifts on the chart points to a continuation of this momentum, suggesting that higher valuations are within reach if the present flow persists.
Overall, gold’s tone is constructive, characterized by resilience and sustained demand. The pattern unfolding indicates a market preparing for further expansion, with the potential for continuation into higher ranges in the sessions ahead.

GOLDGOLD if gives us a correction here and stay above 3600 then we have a potential for 3750 and above.
Disclosure: We are part of Trade Nation's Influencer program and receive a monthly fee for using their TradingView charts in our analysis.

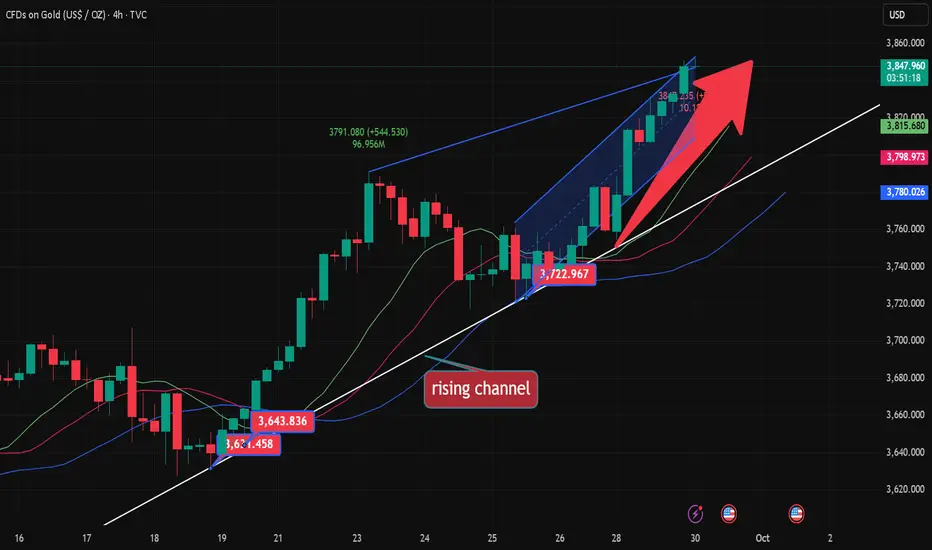
Strategic Long-Term Perspective on GoldGold has delivered a strong bullish cycle after weeks of accumulation. The past phase showed a contracting range where liquidity was built up and multiple structural shifts occurred, signaling preparation for expansion. Once price broke out of that range in late August, momentum accelerated, leading to a clean and sustained rally into September.
The recent move highlights how market flow continues to favor the upside, with each correction acting as a re-accumulation zone rather than a trend reversal. Institutional order flow remains visible, supporting higher valuations as price respects bullish market structure.
Currently, gold is stabilizing after the sharp leg upward. This pause suggests a phase of healthy consolidation, likely absorbing liquidity before attempting the next impulsive wave higher. Overall sentiment remains constructive, with bullish continuation the dominant narrative unless a major structural shift occurs.

Gold Breaking Limits – Trend Speaks for ItselfGold Breaking Limits – Trend Speaks for Itself
Gold Market Outlook
Gold continues to demonstrate a well-structured bullish cycle, characterized by steady momentum and clean trend development. The market has transitioned from a prolonged consolidation phase into a sustained directional move, where each breakout is validated by controlled retracements. This reflects strong participation and confidence from larger players.
The sequence of market shifts and break-of-structure signals highlight how short-term pullbacks are consistently absorbed, turning into fuel for further expansion. Price action is orderly, with no signs of erratic volatility, showing that buyers remain in control and liquidity is being managed efficiently.
Overall, gold is moving in line with the broader macro sentiment. The rhythm of accumulation, expansion, and continuation suggests that the current cycle has not yet exhausted its potential. While interim pauses are expected, the structural integrity of the trend continues to favor upside development over the medium term.

GOLD NEXT MOVE 3500 or 3700 ?Gold Have A Resistance And Support
Support 3656 / 3653
If Gold Break The 3653 Then Next Target 3500
Resistance 3671 / 3669
If Gold Break 3671 Next Target 3700
Follow Us For More Trades

Gold Holds Above $3,620 – Uptrend Strengthens📊 Market Overview:
Gold continues its rally, trading above the $3,600 psychological level, supported by strong safe-haven demand, growing expectations of a Fed rate cut, and ongoing geopolitical risks. Analysts, including Goldman Sachs, have even suggested potential upside toward $5,000/oz if confidence in Fed independence weakens.
📉 Technical Analysis:
- Resistance: $3,630 – $3,640
- Support: $3,600 (key psychological level)
- Indicators: MA, RSI, MACD, and STOCH all show strong bullish momentum, reinforcing the continuation of the uptrend.
📌 Outlook:
Gold remains in a bullish short-term trend. A clear breakout above $3,640 could open the path to $3,650+, while any pullback is likely to find strong buying interest near $3,600.
💡 Trading Strategy:
🔺 BUY XAU/USD near $3,607 – $3,610
🎯 TP: 40/80/200 pips
❌ SL: $3,604
🔻 SELL XAU/USD if price rejects $3,642 – $3,645
🎯 TP: 40/80/200 pips
❌ SL: $3,647

Gold Rally at Its Peak – Correction on the Horizon?Gold Rally at Its Peak – Correction on the Horizon?
Gold (XAUUSD) Technical–Fundamental Market Report
Over the past weeks, gold has shown a significant transition in market structure. After a prolonged distribution and corrective phase through late July into mid-August, price action shifted decisively into a strong bullish cycle. The early downtrend was marked by repeated breaks of structure to the downside, reflecting selling pressure and controlled liquidity grabs.
From late August onward, gold transitioned into accumulation, where price consolidated, absorbed liquidity, and built momentum. This was followed by a clear breakout phase, marked by multiple bullish break-of-structure signals. The market demonstrated aggressive upward expansion, driven by momentum and strong order flow, suggesting institutional positioning.
Fundamentally, this aligns with the current macro backdrop: gold often gains strength when investors anticipate monetary policy easing, inflationary risks, or geopolitical tensions. The consistent bullish run reflects a flight-to-safety narrative, supported by capital inflows.
Currently, price action shows extended bullish movement nearing exhaustion, with signs of potential short-term corrective pressure. The dotted projection suggests a retracement phase could be expected after testing higher liquidity zones, a natural reaction to overextended momentum.
