Gold Analysis
Gold is in bullish channel and close to resistance area.
Daily candles closes are good although they have shadow from top but weekly candle is gonna close with a good body.
Check for confirmation in 15 min timeframe to join buyers.
Stay tuned for our next updates.
Goldpattern

GOLD (XAU/USD) — London → NYPrice is consolidating below descending resistance after the impulsive sell off. London open is failing to reclaim 4290 – 4295, keeping structure bearish. Current range looks corrective (bear flag).
~New York market will bring high impact USD data so expecting volatility.
~Sell entries below 4295 or current price.
~Rejection here keeps focus on 4256 → 4245 liquidity.
Treat upside pushes as sell-side liquidity tests unless price reclaims and holds above 4295.
Tips : Favor reaction trades, not prediction wait for NY to show acceptance or rejection at key levels.

XAU/USD Bullish Structure Activated – Premium Swing Setup Ahead🏆 XAU/USD GOLD BREAKOUT BLUEPRINT 📈
Swing Trade | Bullish Momentum Confirmed
═══════════════════════════════════════
📊 TRADE SETUP AT A GLANCE
🟢 Asset: XAU/USD (Gold vs U.S. Dollar)
📍 Strategy: Swing Trade | Moving Average Breakout
⚡ Bias: BULLISH | Momentum Confirmed
📊 Timeframe:
⏰ Setup Type: Technical Breakout + Price Action
🎯 ENTRY STRATEGY
✅ Entry Zone: Flexible Entry Levels
Market Order or Limit Orders acceptable
Align with current support/resistance structure
Confirm breakout candle closure above moving averages
💡 Confirmation Signals:
Price breakout above key moving average (MA)
Volume confirmation
Support hold above
🛑 RISK MANAGEMENT
Stop Loss Level: 4,050.00 ⛔
Strategic placement below swing low
Protects against false breakout
IMPORTANT: Adjust SL based on YOUR personal risk tolerance & strategy
Risk/Reward Ratio: Minimum 1:2 recommended
⚠️ Disclaimer: This is MY suggested level only. You have complete discretion to set your own stop loss based on your trading plan, account size, and risk management rules.
🎖️ PROFIT TARGETS
Primary Target: 4,260.00 🚀
Strong resistance zone identified
Overbought levels approaching
Key technical barrier zone
📌 Target Rationale:
Resistance confluence
Previous rejection zone
Risk:Reward alignment
⚠️ Disclaimer: This is MY suggested target only. You retain full control over your take-profit levels. Exit at YOUR predetermined levels based on your strategy, profit goals, and market conditions.
💼 RELATED PAIRS TO MONITOR (CORRELATION ANALYSIS)
📍 USD INDEX (DXY) - Strong Inverse Correlation ⬇️
Why Watch: Gold is priced in USD. Weaker dollar = Stronger gold
↓ DXY pressure supports XAU/USD upside
↑ DXY strength threatens gold rally
Key Level: Watch 104.50 - 105.00 zone
📍 EURUSD - Inverse Dollar Relationship ⬆️
Why Watch: Euro strength indicates dollar weakness, bullish for gold
↑ EURUSD strength = Tailwind for XAU/USD
↓ EURUSD weakness = Headwind for gold
Key Level: Watch 1.1000 - 1.1100 support
Correlation: 0.75+ inverse (very strong)
📍 GBPUSD - Inverse Dollar Relationship ⬆️
Why Watch: Similar to EUR; British Pound weakness/strength affects gold demand
↑ GBPUSD strength = Supportive for XAU/USD
Key Level: Watch 1.2700 - 1.2800 zone
Correlation: 0.70+ inverse relationship
📍 US 10Y YIELD (TNX) - Inverse Relationship ⬇️
Why Watch: Rising yields = Stronger dollar + Higher opportunity cost for holding non-yielding gold
↑ TNX pressure = Headwind for gold
↓ TNX decline = Tailwind for gold
Key Level: Watch 4.20% - 4.50% threshold
Impact: Direct fundamental driver
📍 S&P 500 (SPX) - Risk Sentiment Correlation ⬇️
Why Watch: Risk-off = Flight to safety (gold rallies); Risk-on = Equities rally (gold declines)
⬆️ SPX weakness = Typically bullish for gold (safe-haven demand)
Key Level: Watch 6,800 - 6,850 support zone
Correlation: -0.30 to -0.50 (inverse; moderate)
📍 OIL (WTI/BRENT) - Inflation Proxy ⬆️
Why Watch: Oil/inflation expectations influence real rates and gold demand
↑ Oil strength = Inflation concerns = Bullish for gold
Key Level: Watch $75 - $80 zone
Correlation: 0.40+ positive
🔑 KEY CORRELATION POINTS
DXY (Dollar Index) moves in the OPPOSITE direction to gold with a -0.85 correlation (very strong inverse). This is the primary driver—when the dollar weakens, gold strengthens, and vice versa.
EURUSD & GBPUSD both show strong inverse correlations at -0.75 and -0.70 respectively. Euro and Pound strength indicate dollar weakness, which supports gold upside as secondary support signals.
TNX (10-Year Yield) maintains a -0.80 inverse correlation. Rising yields strengthen the dollar and increase the opportunity cost of holding non-yielding gold, while declining yields support gold appreciation. This is a fundamental driver of gold price action.
SPX (S&P 500) has a moderate -0.40 inverse correlation reflecting risk sentiment. When equities decline (risk-off), investors flee to safe-haven assets like gold. When stocks rally (risk-on), gold typically retreats as capital rotates to higher-yielding assets.
Oil (WTI/Brent) shows a +0.40 positive correlation. Rising oil prices often signal inflation concerns, which supports gold demand as an inflation hedge and real asset store of value.
📋 PRE-TRADE CHECKLIST
✅ Moving average breakout confirmed?
✅ Volume supporting the move?
✅ DXY weakness OR USD decline confirmed?
✅ 10Y Yield below 4.50% zone?
✅ Risk/Reward ratio minimum 1:2?
✅ Your personal SL/TP levels SET?
✅ Position size calculated per YOUR risk?
✅ Economic calendar clear for next 24hrs?
Happy Trading! 🚀📈
Risk What You Can Afford to Lose | Trade Smart | Manage Risk

Gold further downside next weekGold price had closed below 5 day moving average for the past 3 days, this would be a sign for further downside. This is also the third time the gold price is unable to break above 4250 area.
There should be further attempts to try to break above, in the mean time, momentary retracement should be on the cards next week.
This retracement might be to gather further strength to break to the upside later.
Trading strategy -> continue to buy on dip, control small lot size.

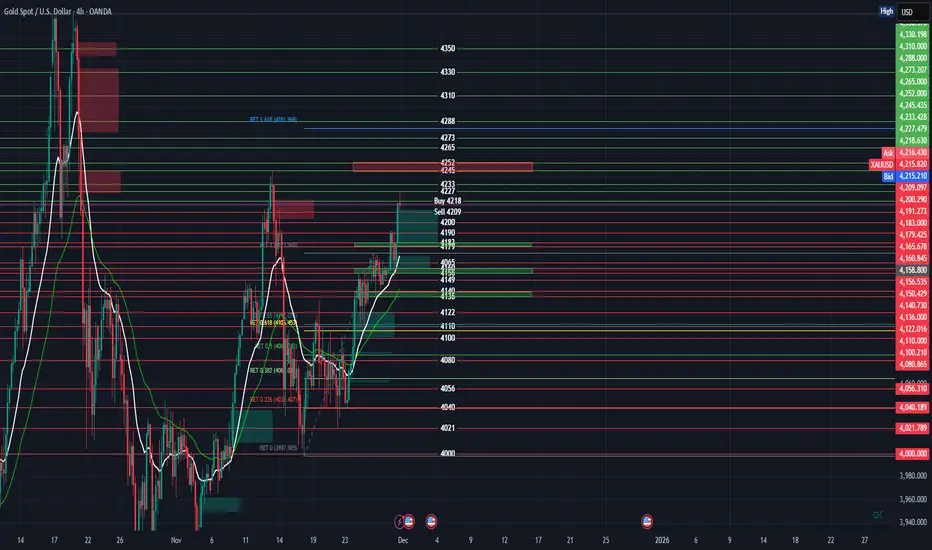
Gold weekly chart (4 hour) with buy and sell entriesChart Overview: XAU/USD 4-Hour
Current Trend: The market is in a corrective phase (bearish pullback) following an aggressive parabolic rally to a high of ~4381.
Momentum: Bearish. The White Moving Average (likely a shorter period, e.g., 20 or 50) has crossed below the Green Moving Average (likely a longer period, e.g., 200), signaling downward momentum.
🔴 Potential Sell Entries (Red Zones)
Major Resistance / Supply Zone: 4245.00 - 4252.00
Technicals: This red shaded box represents a Bearish Order Block (Supply Zone). Price previously broke down from this level with impulsive red candles, leaving trapped buyers. When price retraces to this area, these buyers often sell to break even, and institutional sellers reload shorts.
Secondary Sell signal (Text on chart): The label "Sell 4209" suggests a breakout trade. If price loses the 4209 local support, it confirms a continuation of the lower-low structure.
Suggested Take Profits (TP):
TP 1: 4165 (First Green Zone)
TP 2: 4136 (Second Green Zone)
TP 3: 4105 (0.618 Fibonacci Golden Pocket)
🟢 Potential Buy Entries (Green Zones)
Zone 1: 4160.00 - 4165.00
Technicals: This is the first area of structural support. It aligns with previous consolidation tops before the massive breakout. It acts as a "flip zone" (resistance turned support).
Zone 2: 4136.00 - 4140.00 (Stronger Support)
Technicals: This is a stronger Demand Zone. It sits just above the significant Fibonacci levels. If the correction deepens, this is the area where institutional algorithms often step in to defend the larger uptrend.
Text Signal "Buy 4218": The label "Buy 4218" on your chart suggests a momentum reversal trade—essentially waiting for the price to reclaim the immediate resistance before going long.
Suggested Take Profits (TP):
TP 1: 4210 (Local deviation)
TP 2: 4245 (Testing the bottom of the Red Supply Zone)
TP 3: 4280 (continuation of trend)
Summary Strategy
Short Term: The bias is Bearish as long as price is below the Moving Average crossover. Look for rejections at the 4245 red box to Sell.
Medium Term: Watch for bullish reversal patterns (doji, hammer candles) inside the green 4136 - 4165 zones to catch the next leg up of the macro bull run.
GOLD Overall Structure (1D Timeframe)✅ 1. Overall Structure (1D Timeframe)
• A descending corrective channel (yellow lines)
• Major rejection at the channel top
• Price making lower highs (LH) → still bearish structure
• Price currently sitting below the mid-range of the channel
This means:
👉 Gold is still in a corrective downtrend, not bullish yet.
👉 High probability the market wants to fill lower OBs before any breakout.
________________________________________
✅ 2. Key Areas I Highlighted
🔷 1D TF FVG (4,107–4,150) – Major Resistance
• This zone is extremely important.
• Price has failed here multiple times already.
• As long as price is below this → bearish pressure continues.
This is the “breaker” level for bulls.
________________________________________
🔴 1D OB Zones Below (Demand Areas)
I mapped the OB zones correctly:
1️⃣ OB: 3,990 – 3,950
• First liquidity target
• Already almost tapped/mitigated
• Still valid for another reaction
2️⃣ OB: 3,929 – 3,885
• Stronger demand
• Highly likely to get tapped if the rejection continues
• My trendline bottom also aligns here → confluence
3️⃣ OB: 3,800 – 3,700
• If price breaks deeper into channel
• This is the next liquidity layer
These OBs line up perfectly with my descending channel.
________________________________________
Extreme Liquidity Below
I noted:
• 3100
• 3000
• 2600
These are macro liquidity harvest levels, NOT near-term.
Price falls here only if:
• Channel breaks down
• Major macro bearish shift occurs
→ Not likely in the next few weeks unless massive catalyst.
________________________________________
✅ 3. Updated Structural Reading (Using New Drawing)
A. Price recently failed to break the upper channel
This supports more downside.
B. I drew an ABC correction
The new chart also still shows:
• A → B → C decline likely forming
• Potential completion at the lower trendline
This supports a drop before any rally.
C. My white projection (V-shape recovery)
This large bullish projection is valid ONLY if:
• Price touches lower OB
➡️ 3,929 – 3,885
• And then breaks back above
➡️ 4,150
Only then the big bullish run can start.
________________________________________
📉 4. Most Likely Path (Updated With New Chart)
Based on my new structure:
Primary Scenario (70% probability)
Price drops to the lower OB:
→ 3,929 – 3,885
Possibly even wick into:
→ 3,800 – 3,700
Then:
Strong bounce → retest 1D FVG (4,107–4,150)
If rejection again → continuation inside channel.
________________________________________
Bullish Scenario (30% probability)
For my yellow arrow to be valid:
1. Price must touch the lower OB
2. Then form a strong reversal
3. Then break upward out of the descending channel
4. Then close above 4,150
5. Target becomes: 4,380 → 4,800
This matches my yellow long-term projection.
________________________________________
🎯 5. Key Levels to Watch (Updated)
Immediate Support
Level Significance
3,990 Weak OB – might not hold
3,950 First real support
3,929 – 3,885 🔥 Strong OB + channel bottom confluence
Immediate Resistance
Level Significance
4,107–4,150 🔷 Strong 1D FVG (must break for bulls)
4,200 Channel breakout level
4,380 First macro target
________________________________________
⭐ 6. Simple Final Summary (Very Clear)
My new chart indicates:
✔️ Market still bearish inside descending channel
✔️ Price likely drops to 3,929–3,885 OB
✔️ This is the best zone for bullish reversal
✔️ Bulls must break 4,150 to confirm trend change
✔️ If breakout happens → target 4,380–4,800
✔️ If OB fails → deeper channel drop to 3,700 OB
I drew the structure correctly. The analysis fully matches my levels.

Gold - Pattern that Pays
Gold - Pattern that Pays
The chart really speaks for itself.
◻️ The 100 DSMA (blue line) has been a great level for buying / bouncing of price.
◻️ Price falls during corrections to the 100 DSMA.
◻️ Pennants show price compression until price revisits 100 DSMA & then price continue upwards.
◻️ Its important to understand that at some stage in the future, the pennant will fail, price will fall out of the bottom of the pennant, which is where your stop should be placed. This is a real possibility after such a big gold run.
◻️ Breakouts from the upper part of the pennant (orange circles) are another great place to double down on a position, and appears to be a good confirmation of continued upside.
Keep the "cost of mistakes low" with your SL.
My stop loss will be 10% under the 10 DSMA line. I do not automate this because stop loss hunting by exchanges is rife this past several years. So I will manually bow out at approx. 10% price drop from entry, unless I believe it is a stop/liquidation sweep. Given my positions are a small 2 - 3% of my portfolio I am fine having high conviction and willing to lose 10% on these high conviction plays.
Furthermore, it is highly likely gold is on a multi year secular bull market, however, it is probable that we are entering a period where Gold stalls for a few years, so... this is an opportunity to stack and hold Gold for that 2 - 3 year timeframe.
The above chart is to trade on weekly and monthly timeframe, however there is an argument to build a long term stack, in the event a 2 - 3 year correction / sideways move materializes. Gold could be a good place to stack profits from other trades over a 12 - 36 month timeframe, for those of you that are seeking to park profits into some long term safety that gains....for those of you patient enough to execute that
Stay Patient and keep you mistakes cheap
P

Rejected at (OB) $4013–$4020, next days 10th-14th target $3,885🧭 Overall Structure
The chart shows a potential bearish setup.
I have drawn a descending pattern (A-B-C-D) with rejection from an Order Block (OB) around $4,013–$4,020.
The white arrow projects a downward move toward 3,885.
🔍 Key Technical Elements
1. Order Blocks (OB)
Upper OB (~4,150–4,120): Higher timeframe supply zone; strong resistance if price rallies.
Current OB (~4,013–4,040): Recently rejected here — price reacted and failed to make a new higher high → confirms seller pressure.
2. Break of Structure (BOS)
A previous BOS occurred to the downside, suggesting bearish momentum took control after a temporary bullish leg.
3. Trend Lines (Yellow Dashed)
The upper TL connects lower highs → consistent downtrend.
The lower TL (support) was recently tested and might break soon — signaling bearish continuation.
4. Pattern
A–B–C–D harmonic-like pattern completed near the order block, often signaling a sell opportunity when it aligns with rejection zones.
Price formed a lower high (LH) at point C and another at D → confirms trend weakness.
5. Candlestick Rejection
“Rejected” and “Hammer” labels near point D and OB zone show failed bullish attempts → adds confluence for short.
🎯 Bearish Targets
TP1: 3,950 (nearest support)
TP2: 3,930 (previous low)
TP3 (Major): 3,885 (strong historical support zone)
⚠️ Invalidation
If price closes above 4,040–4,060 (OB zone), bearish setup invalidates.
That would mean liquidity grab and possible push toward 4,100–4,150 OB.
🧩 Summary
Bias Entry Zone Confirmation Targets Invalidation
Bearish 4,010–4,020 OB zone Rejection + lower high 3,950 → 3,930 → 3,885 Close above 4,060
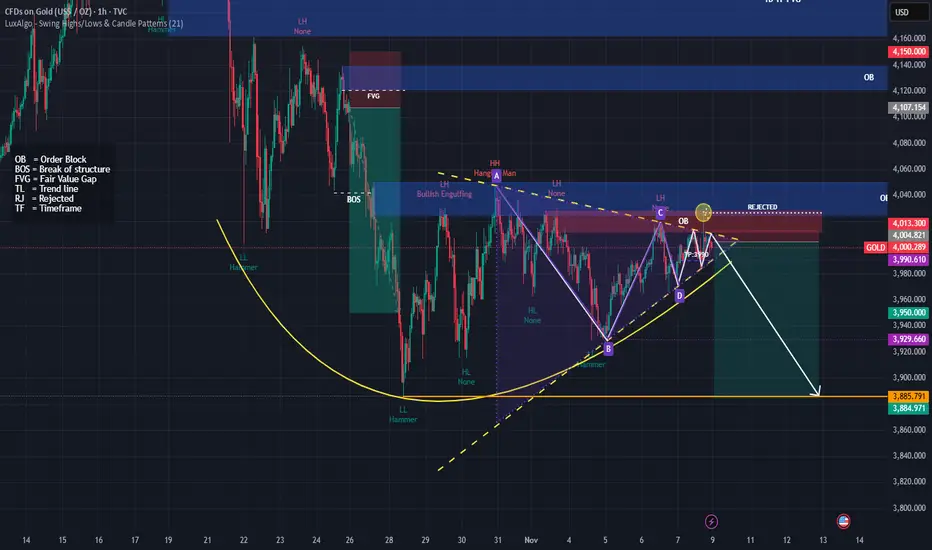
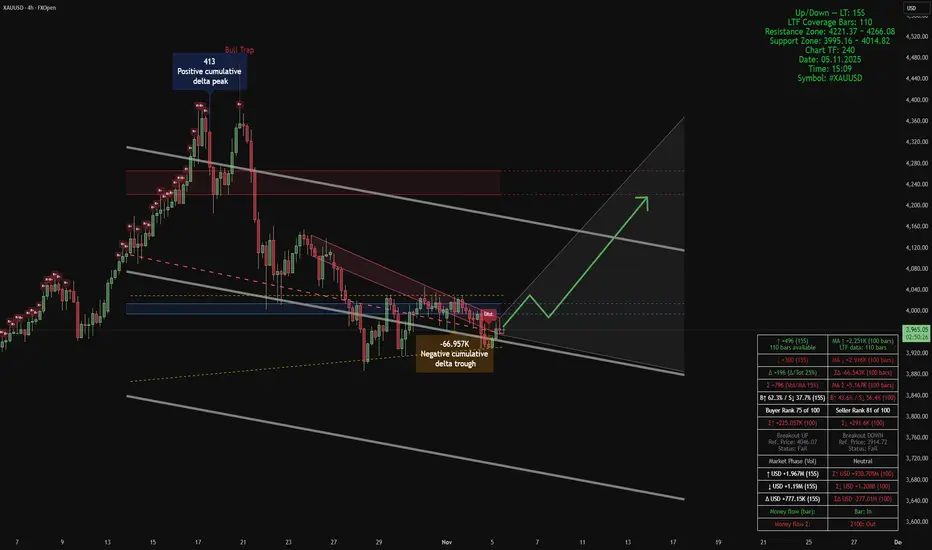
Chart Analysis (XAUUSD, 4H), Smart Volume–Structure Matrix Smart Volume–Structure Matrix | Smart Money Flow & Dynamic Blocks
This chart combines four complementary analytical modules, each providing a unique perspective on market structure and smart money flow:
- Smart Money Support/Resistance: Identifies buy/sell volume-based zones of accumulation or distribution.
- ATAI Volume (Breakout/Phase/OB-OS): Detects directional volume pressure, market phases (Accumulation/Distribution), and overbought/oversold extremes.
- Smart Money Dynamics Blocks (Pearson Matrix & P25 HL2): Measures price correlation and regression-style parallel bands.
- Volume Pressure (Wings & Angles): Calculates normalized momentum angles using ATR to assess directional bias.
Together, they form a multidimensional framework for detecting smart money flow, trend shifts, and potential reversals.
Chart Analysis (XAUUSD, 4H)
Price is trading within a compressed descending channel between red dynamic resistance lines and the lower P25 HL2 band. It is currently consolidating near the Smart Money support zone around 3995–4015. The 4221–4266 range marks the key resistance where a breakout could confirm a mid-term trend reversal.
Volume analysis shows a cumulative delta trough forming at the lower boundary — a sign of seller exhaustion. The ATAI module shows improving buyer ratio and declining sell pressure, suggesting an early phase of re-accumulation. Pearson Blocks indicate an R+ alignment near support, confirming correlation with recent bullish microstructure.
Main Bias: Bullish Reversal.
- Trigger 1: 4H close above the blue pivot line (mid-range) and breakout from the descending wedge.
- Trigger 2: Positive delta confirmation and buyer ratio ≥ 55% on LTF.
- Targets: 4060–4080 → 4140 → 4210–4260 (structural resistance target).
- Invalidation: 4H close below 3995 (breakdown under lower HL2 band).
Alternative Scenario: Short-term continuation of bearish pressure if breakout fails and new delta low forms. In that case, pullbacks toward the blue pivot will act as short-selling opportunities down to the lower band.
Risk Management: Place stops below the last swing/HL2 band with ATR buffer. Scale out at each target and move stops to breakeven after the first objective.
Summary: Confluence of Smart Money Support, Delta trough, R+ Pearson, and HL2 band contact creates a high-probability reversal setup with favorable risk-to-reward. Confirmation requires breakout and positive delta shift. Structural target remains 4210–4260.
Gold will continue to test lower lowsThis is what I think: we have an ascending wedge pattern that usually results in a bearish downward breakdown.
The next support level will test 3800 area.

XAUUSD: Strong recovery, will gold continue to make new highs?OANDA:XAUUSD had a significant correction in the trading session at the end of last week, for most of yesterday's trading session we have not seen too strong bullish momentum.
However, during the New York Session, gold rose sharply under the push of large cash flows and with the emergence of some unsettling news, typically the fact that China could pay 155% tariffs if there is no agreement before November 1 (President Trump).
Looking at the options market in today's trading session, most traders are still apprehensive as the price is trading above the peak of 4350 – 4370 (calculated through the price of CFDs). However, most of the market is involved by longcall contracts, so I assess that in today's trading session, the price will continue to above $4400/ounce.
Some key levels that we need to pay attention to in today's trading session:
Resistance: ,
Support:
Support:
Strong support:
Margin Zone support:
Fair value gap (FVG):
Margin Zone + Strong suport + FVG => This will be a strong support zone in today's trading session
Always be patient and wait for the price to reach the support and resistance zones above and get confirmation. Do not place limit orders or enter orders when the price is increasing or decreasing sharply.
Take advantage of the above support and resistance zones and trade short-term when the price reacts at these support and resistance zones => Take profit when the price moves from 10 to 20 prices since entering the order at the support and resistance areas.
Wait for reactions such as Engulfing candles, Doji,... at the support and resistance zones.
Always set stop loss when trading and manage risks closely.
Note: Price may spike through support or resistance levels and then reverse. Therefore, it is crucial to patiently wait for the candle to close before entering a trade.
Victor Dan @ ZuperView

XAUUSD: Has gold made a peak?OANDA:XAUUSD had a strong correction day at the end of last week with strong selling pressure, the rhythm of recovery does not make too much sense when the price is still sideways in the range of 4220 – 4270.
In previous corrections, we have seen that the price has always recovered strongly immediately, however in the current situation, the price has not made any attempt to rise again => Reinforce the fact that the price has made a peak and started a short-term correction.
In the Options market, there has been a large number of Longput contracts and Longcall contracts are gradually being withdrawn from the market , so I think the price will not be able to rise in today's trading session.
Some key levels are important in today's trading session:
Resistance: ,
Strong support:
Daily balance:
Daily balance is the temporary equilibrium level of the market in today's trading session, if the price breaks this balance, the price will look for lower value areas.
Always be patient and wait for the price to reach the support and resistance zones above and get confirmation. Do not place limit orders or enter orders when the price is increasing or decreasing sharply.
Take advantage of the above support and resistance zones and trade short-term when the price reacts at these support and resistance zones and take profit when price moves 10 to 20 prices from support and resistance zones.
Wait for reactions such as Engulfing candles, Doji,... at the support and resistance zones.
Always set stop losses when trading and manage risks closely.
Victor Dan @ ZuperView

XAUUSD: Correction failure, aiming for higher priceAfter a sizable dip following the retest of 4057, gold recovered quickly and broke higher after President Donald Trump said he is considering raising tariffs on Chinese imports up to 100%, a headline that jolted broader risk assets and added to geopolitical uncertainty.
Given gold’s safe-haven character and the recent instability across financial markets, a deep correction is unlikely for now. Instead, looking for potential buy entry during slight corrections is safer in the current situation.
Latest update: In today’s session, President Trump told reporters on Sunday (Oct 12) that the war in Gaza “has ended.”
📊 Trading Plan
⇒ With the news situation still unclear for us to know whether gold will decrease or continue to increase strongly, so in today's trading session we should only scalp trade when the price moves to support and resistance zones.
Key Levels
Margin Zone Resistance:
Resistance: ,
=> These resistance zones are derived from concentrated CME Long-call positioning and may elicit reactions if tested.
Margin Zone Support:
Support: ,
Strong Support:
Victor Dan @ ZuperView

GoldXau usd daily analysis
Time frame 4hours
Long position Risk rewards ratio=1.5👈Short position Risk rewards ratio>4.2👈

XAUUSD: Caution advised ahead of NFP releaseOANDA:XAUUSD current bullish momentum is weakening, and traders are extremely cautious ahead of the upcoming Non-Farm Employment Change, which is expected to be USD-positive , accompanied by gradually emerging profit-taking pressure from investors. Therefore, I expect gold to have a significant correction soon after completing the upward move above the area.
You can read my previous analysis here:
There has been the appearance of long put contracts from CME traders being deployed into the market , which is a move to guard against a potential decline in gold in the future.
However, this is only the market’s preparation, and at present there is no sign of a reversal .
Continue to look for buy setups toward Targets 1 and 2. Pay attention to the Margin zone, where CME traders are concentrating a large number of contracts, which may cause price to reverse.
Key resistance:
Key strong support: ,
Margin zone:
Wait for confirmation of a Buy (Pull) signal from MagnetOsc Turbo on the lower timeframes after price breaks above the resistance zone and pullback. Place the stop below the most recent M5 swing low when the entry signal appears.
Continue to look for buy setups toward Target 1 & Target 2, while closely watching for reversal signal.
Please like and comment below to support our traders. Your reactions motivate us to produce more analysis in the future 🙏✨
Victor Dan @ ZuperView

Gold Futures Bullish Setup – Entry at Demand Zone1. Channel Formation
The price is moving inside a rising parallel channel (blue lines).
Recently, the price broke below the midline (dashed blue) of the channel, indicating short-term weakness.
2. Trade Setup: Long (Buy) Position
The chart indicates a bullish outlook, expecting a price reversal from the demand zone.
🔹 Entry Zone
Entry Price: ₹116,251 – ₹116,277
This is marked with a grey zone, which aligns with a support area and previous consolidation.
🔻 Stop Loss (SL)
Stop Loss Price: ₹115,705 – ₹115,729
Placed just below the lower boundary of the support zone to protect against a false breakout.
🎯 Target (TP)
Target Price: ₹119,331 – ₹119,338 (LABA target point)
This lies above recent highs and near the upper boundary of the channel, suggesting continuation of the bullish trend.
3. Risk-Reward Ratio
The blue shaded box indicates a reward zone.
The trade has a favorable Risk-Reward Ratio (RRR) > 2:1, which is considered a strong setup.
🧠 Interpretation & Strategy
The red curved arrow indicates expected price action: a short-term pullback into the demand zone, followed by a bullish bounce toward the target.
The structure suggests a buy-the-dip opportunity within an ongoing uptrend.
⚠️ Key Takeaways
Component Value (INR)
Entry Zone 116,251 – 116,277
Stop Loss 115,705 – 115,729
Target 119,331 – 119,338
Trend Bullish inside channel
Risk/Reward Favorable (>2:1)
✅ Conclusion
This setup represents a bullish continuation pattern. If price revisits the highlighted demand/support zone, and forms bullish reversal candles (e.g., hammer, bullish engulfing), it could offer a high-probability long entry toward the upper end of the channel near ₹119,338.

XAUUSD: The last bull run?FXOPEN:XAUUSD keeps grinding higher, but the structure suggests this may be the last impulse of the current move. I expect price to complete the advance into the large liquidity pocket at before a sharper correction, as upside momentum has started to fade.
You can read my previous analysis here:
CME flow shows heavy long-call positioning around 3867. A failure back below 3867 would likely open a deeper pullback.
That said, there is still a Margin Zone/liquidity pool at actively traded by CME participants, so price may push through 3867 toward before reversing.
Watch 3828 (prior session POC) — price can react and bounce from 3828 without visiting the deeper supports.
Key support: ,
Margin Zone:
Trading Plan
Sell: Look for strong sell signals from Quantum Vol-Delta on the M5/M1 timeframes inside .
Buy: If price pulls back into the key supports, wait for Quantum Vol-Delta to confirm buyers returning → Enter on the candle close.
Risk management:
Stop loss: below/above the most recent 5m timeframe swing low/high or beyond the respective support/resistance zone.
Move to break-even at +1R (R:R = 1:1).
Please like and comment below to support our traders. Your reactions motivate us to do more analysis in the future 🙏✨

XAUUSD: Trend is your friend, follow it!Price remains in a strong uptrend with no clear signs of momentum weakness yet. That said, this appears to be the final leg of the current advance, so chasing highs is risky. I prefer to stand aside for now and wait for price-action confirmation of a top.
1) Analysis
Price has broken above the prior high at 3.791, but the Superior RSI has not reached the overbought zone and is showing early signs of divergence on 1h timeframe.
The area is a high-activity auction zone on CM E, from here I expect a short pullback into lower supports.
Key support: , , .
2) Primary Scenarios
Scenario A (bearish): If price breaks below and drives into lower supports, then 3.818 will likely mark the swing high, and a deeper correction should follow.
Scenario B (bullish extension): If price respects the support zone and breaks above 3818 then I expect price to at least top at 3866 where CME traders place a large amount of auction contracts and start a correction.
Please like and comment to support our traders. Your feedback motivates us to produce more analysis in the future 🙏✨

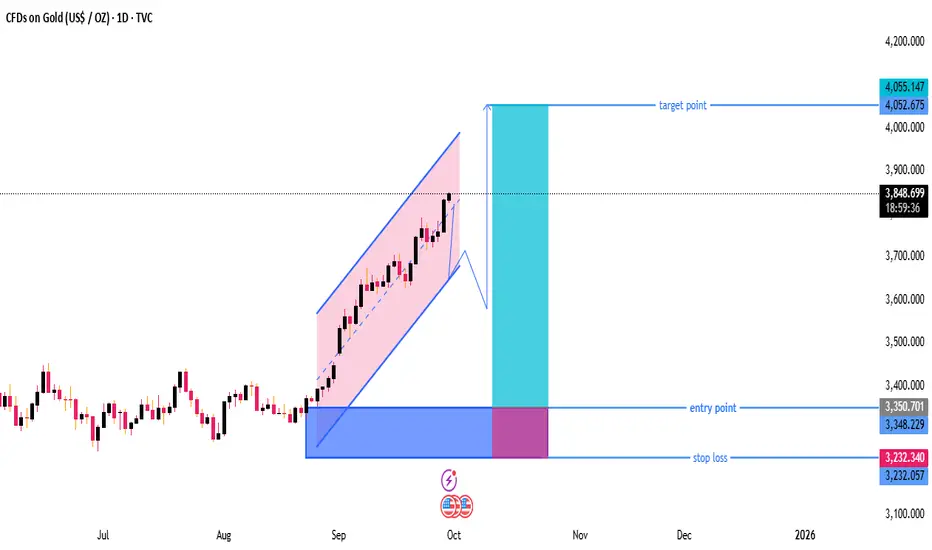
Gold Daily Chart – Buy-the-Dip Setup Towards 4,050 Targethe chart shows XAU/USD (Gold) on a daily timeframe.
Price is currently trading around 3,848, within a rising parallel channel.
A possible pullback from the channel top is indicated before a move higher toward the target.
---
Key Levels & Zones
Entry Point:
Around 3,350 zone marked as the ideal buy area.
This is near the lower support region of previous consolidation.
Stop Loss:
Placed around 3,232, which is below key support.
Good for risk management — avoids staying in trade if price breaks structure.
Target Point:
Around 4,052 – 4,055, aligning with the measured move from the breakout of the channel.
This gives a strong risk-to-reward ratio (roughly 2.5:1).
---
Technical Structure
Trend: Strong uptrend – price respecting ascending channel.
Momentum: Higher highs and higher lows confirm bullish market structure.
Possible Scenario:
1. Short-term pullback expected to lower boundary or breakout retest zone.
2. Continuation move upward toward target (around 4,050).
---
Trading Plan Based on Chart
Wait for Pullback: Don’t buy at current level; price might retrace before next leg.
Enter near 3,350: Ideal long position entry point.
Stop Loss: 3,232 (safe under last swing low).
Target: 4,052–4,055 (previous high / projected channel top).
---
Summary
✅ Bias: Bullish (Buy-the-dip strategy)
📈 Entry: ~3,350
⛔ Stop Loss: ~3,232
🎯 Target: ~4,050
📊 Risk/Reward: Favorable — approx. 1:3
This setup is swing-trade friendly and follows trend continuation logic.
How to accurately grasp gold trading opportunities?The market keeps falling, but we have no worries about taking profits. 3720 is the key short-term support level. Once it is effectively broken, gold is expected to accelerate its downward trend. For two consecutive days, we publicly suggested to arrange short orders near 3780 and 3760. Now the market has fallen sharply to the 3725 line, and we have achieved steady profits again. For two consecutive days, we accurately arranged short orders at the intraday high and steadily realized profits.
At present, gold is no longer in a unilateral upward trend, and the technical side has entered a repair stage. The operation idea is mainly to follow the trend, and the focus is on grasping the rhythm of bulls and bears. The most frequently asked questions recently are whether a big drop has begun and whether gold has peaked. From a structural point of view, although the daily line has been under pressure continuously, it closed in the negative yesterday and even formed a tombstone K-line pattern on the previous trading day, indicating that the short-term has encountered obvious suppression, but this cannot directly determine that the major trend has peaked. The weekly line is still dominated by bulls, and the short-term repair market has not destroyed the overall upward trend.
In terms of operation strategy, we still insist on shorting on rebound and long on pullback as a supplement. The lower support of the 4-hour chart focuses on the 3715-3700 area, and the upper pressure focuses on the 3760-3770 range. It is not advisable to blindly chase orders at the middle oscillation position. It is recommended to watch more and do less, and wait patiently for the key points to be confirmed before entering the market to seize the high winning rate opportunities.

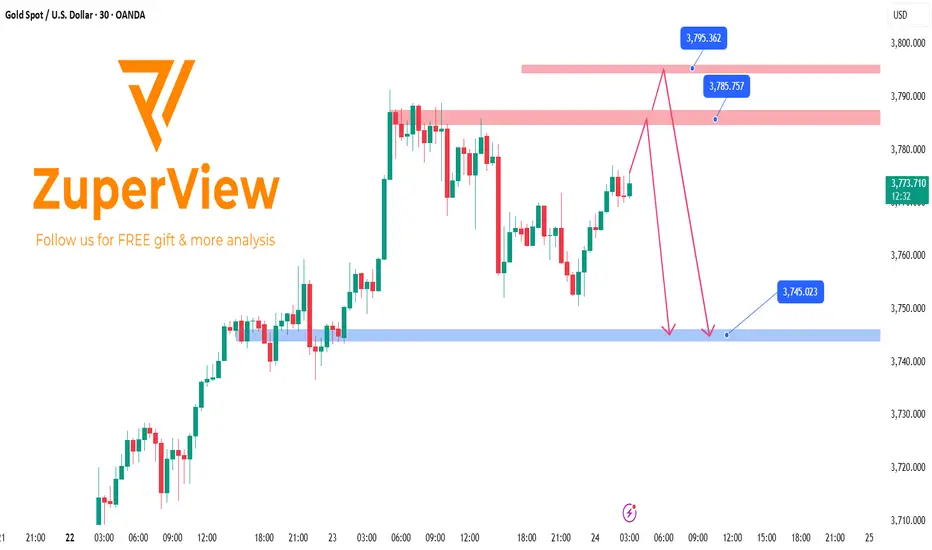
XAUUSD: Could 3790 Be the Top?After the 3740 → 3790 rally, upside momentum has weakened . Therefore, 3790 is likely a temporary top , and a short-term pullback may begin from here. However, we cannot rule out a retest of the top area or even a marginal higher high today before a sharper correction develops.
📉 Analysis
• After the push to 3,790 , price rotated within 3,778–3,788 and then broke the lower bound (3,778) on high volume . This supports the view that a swing high formed at 3,790 . However, price is currently drifting higher on lighter volume , so a retest of the top or even a marginal higher high before the pullback remains possible.
• Resistance zones: 3,784.5–3,787, 3,794–3,796 .
• Key support zones: 3,746–3,744, 3,723–3,718.
📊 Trading Plan
• Wait for reversal signals with heavy volume at the marked support/resistance zones.
• Highest-probability trigger: an 5m engulfing candle with high volume when price taps these levels.
Example: As in ENTRY 1 , if an 5m engulfing candle prints with high volume (as indicated by Superior Volume ) at a marked support/resistance zone, entry on the candle close .
• Entry on the signal and place the stop just above the signal candle (or above the resistance zone ). Move to break-even at +1R .
WILL GOLD BREAK THE BOX : LETS ASK FROM GOLD Hello
Iam Expect From gold that i will see it will break the consolidation box
Buy Gold When Its Break The Box And Continuation Buying Gold
Gold Give A Bullish FVG So We Are Expecting Bullish Momentum
Gold Buy At Bullish FVG And 3376 / 3370 Buy Zone
Manage Your Trade , Good Luck With Your Trading

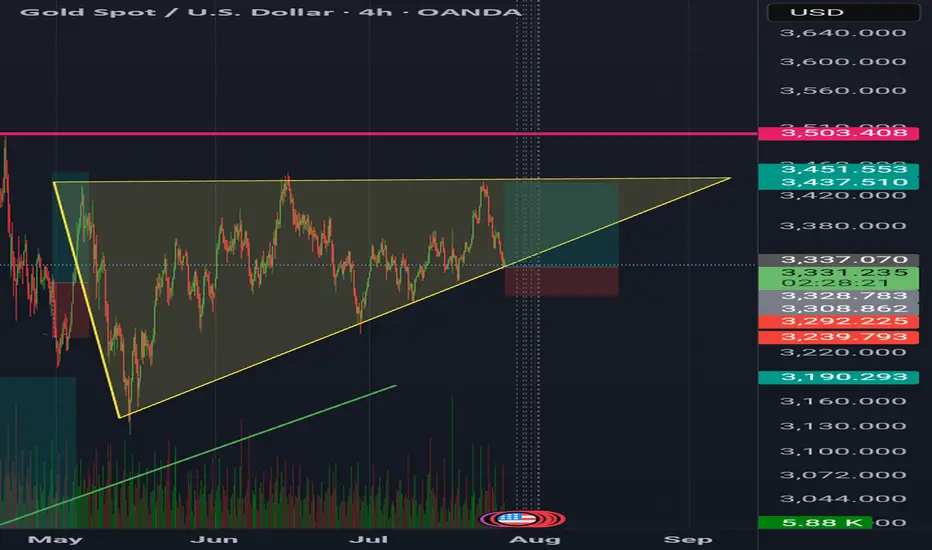
GoldXau usd daily analysis
Time frame 4 hours
Gold is moving up and down in the yellow triangle, you can see on the chart
I think Gold move up to 3450 $ and if we have no positive news, it will drop to the down side. This analysis has good benefit and Risk rewards ratio is 3
On the other hand if Gold break the 3320 $ my analysis is faild and must listen to the economic news