Trump's tariff news stimulates gold to explode!
📌 Driving Events
Gold prices rose for the third consecutive day and are expected to close higher this week. The trend turned in favor of gold buyers as tariff tensions intensified. US President Trump announced new tariffs, exacerbating concerns about a trade war.
📊Personal Comments:
Signs of instability in Trump's trade policy have once again hit investor confidence, reviving safe-haven demand for gold. In the absence of any top US economic data, the market will continue to focus on trade headlines. Weekend fund flows may also drive gold price movements.
⭐️Set Gold Price:
🔥Sell Gold Area: 3360-3369 SL 3374
TP1: $3355
TP2: $3342
TP3: $3325
⭐️ Note: Labaron hopes that traders can properly manage their funds
- Choose a lot size that matches your funds
Goldpattern
Gold accumulates and breaks through 3350 points
⭐️Personal comments:
Gold price rebounded around 3350. There was no important news and bank holidays in the US session on Friday, so it rebounded in the short term
⭐️Set gold price:
🔥Sell gold area: 3365-3367 SL 3372
TP1: $3355
TP2: $3342
TP3: $3330
🔥Buy gold area: $3311-$3313 SL $3306
TP1: $3325
TP2: $3338
TP3: $3350

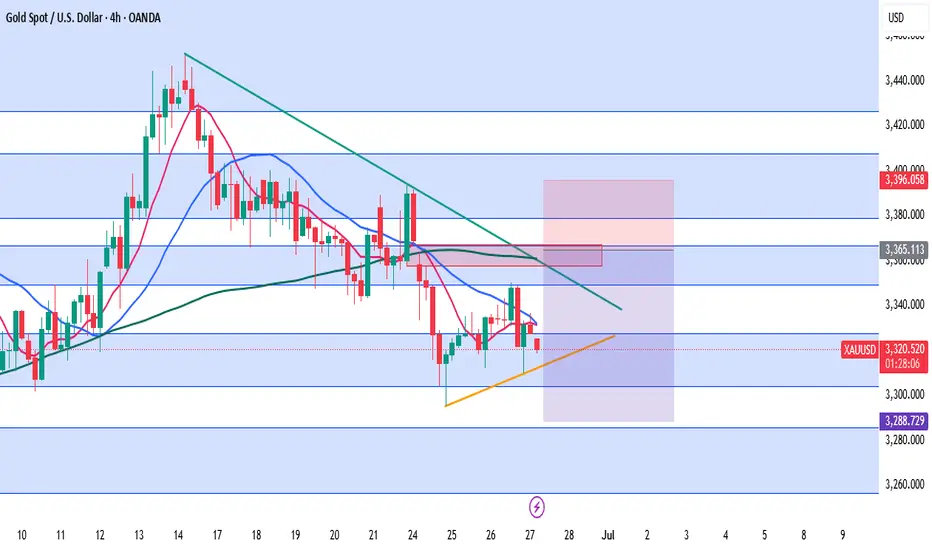
XAUUSD – Key Inflection Zone Before Core PCE Price Index m/mGold opened today with a bearish gap, once again struggling to stay above the 3327–3305 support zone, the same range where it hovered yesterday. While the price did form a higher low and higher high structure on the lower timeframes, this move still lacks the strength to signal a proper reversal—rather, it looks more like a minor consolidation ahead of tonight’s US GDP and Unemployment Claims release.
At this point, gold is trapped between two key forces:
A resilient resistance zone formed by the downtrendline, unfilled gap from earlier this week, and confluence of MA50 & MA200
A rising minor support trendline, creating a tightening range and indicating that the next breakout may provide a clearer direction.
⚠️ Technical Outlook
As long as gold remains below 3366–3367, the prevailing downtrend structure remains valid. Any rally into that zone should be viewed cautiously, especially if accompanied by weak volume or rejection candles. However, if gold manages to break and close H4 above 3367, it could trigger a short-term correction toward 3396 or even higher, aiming to fill the previous gap.
But so far, the momentum remains bearish, and lower highs continue to dominate the mid-term structure.
🔽 Trade Idea (Cautious Swing Trade)
Due to the wide stop-loss required, we recommend using reduced position size to maintain proper risk management.
🔵 Sell Area: 3358 – 3367
❌ Stop Loss: 3396 (above the trendline and prior key high)
🎯 Take Profit 1: 3331
🎯 Take Profit 2: 3306
🎯 Take Profit 3: 3289
🧠 Risk Level: Moderate to High (Lot size should be adjusted)
R3: 3379
R2: 3366
R1: 3350
Pivot: 3327
S1: 3305
S2: 3286
S3: 3256
Gold may usher in new opportunities
Key fundamental drivers
- Middle East tensions and nuclear negotiations Despite the ongoing tensions, Iran's signal of restarting nuclear talks has reduced risk aversion, triggering an intraday sell-off in gold, and the market has digested the reduced possibility of escalation of the conflict. The turbulent situation in the Middle East remains a trigger for market volatility, and any downgrade/escalation signals may trigger sharp fluctuations in gold prices.
- Fed policy and rate cut bets The Fed kept interest rates unchanged this week, but Powell's "data-dependent" stance has raised market expectations for a September rate cut to 60%. A dovish meeting statement could push gold prices above $3,400, while a delayed rate cut signal could drag gold prices to $3,350.
Short-term outlook
In the short term, gold prices may fluctuate between $3,350 and $3,450, and a breakthrough depends on:
- Upside catalyst: Escalating tensions in the Middle East + weak retail sales data may push gold prices to $3,450.
- Downside risks: Fed hawkish signals + fading geopolitical risks could push prices to $3,300.
Key event risks
- June 19: Fed policy meeting (expected to be dovish)
- June 21: US CPI data (inflation indicator to measure the timing of rate cuts)
- Middle East situation: progress in nuclear negotiations and conflict dynamics
💰Strategy Package
Set gold price:
🔥Sell gold area: 3390-33396 SL 3400
TP1: 3380 US dollars
TP2: 3375 US dollars
🔥Buy gold area: $3374-$3366 SL $3360
TP1: 3390 US dollars
TP2: 3400 US dollars

GOLD is in Retracement GOLD is in bullish trend and it can make a retracement so that would be around 3260

With bulls and bears in a stalemate, where will gold go?Gold fell under pressure around 3384 in the early trading on Thursday, and then rebounded after falling to 3361. The highest in the European session reached around 3403, and then fell back due to resistance. The US session accelerated its decline, reaching a minimum of 3339, and then rebounded in the late trading, closing in the negative on the daily line. The daily trend continued to fluctuate in a positive and negative cycle. On Thursday, it rose and fell, closed in the negative and fell below the 5-day moving average.
Today, we will focus on the resistance position of 3405. Whether it can break through will determine the strength of the bulls in the future market. The risk of continuous negative daily lines cannot be ruled out. The support below is the key points of 3330 and 3300. The 4-hour fluctuation range is locked at 3385-3335. The fluctuation space in the Asian and European sessions is limited. It is recommended to sell high and buy low. For stable trading, it is recommended to go long in the 3340-3350 area. The overall bullish trend has not changed, and the impact of non-agricultural data is limited. It is expected that gold will most likely rise and fall. Remember not to chase the rise and sell the fall, and wait patiently for opportunities.
Steady trading, precise attack!

Gold – Structural Bull Bias - One Leg Down Still Anticipated?Overview:
Gold has shown renewed bullish momentum, recently testing the 3360+ zone. While the rally appears impulsive, system-based structure mapping suggests it may still be part of a broader setup — not the true breakout.
We're observing a possible ABCDE triangle structure, where price is either concluding Wave-C or initiating Wave-D. If this scenario holds, the market could revisit levels below 3044, possibly toward 2950–3000, before completing Wave-E and resuming the larger bullish move.
This aligns with a potential 3-Drive bearish trap, where current highs serve to attract buyers before a deeper liquidity move unfolds.
❗ If the 3-Drive pattern is invalidated and price sustains above 3366, the downside leg may already be complete — meaning Wave-E might be in progress.
🔍 Market Intention
Signs of liquidity hunting above 3360 hint at unfinished business by Smart Money (SM) - drawing in late buyers.
Market may be positioning to sweep lows before revealing its actual direction.
🎯 Action Zone
Anticipate rejection or weakness in the 3360–3370 resistance zone.
If a lower high confirms here → potential downside toward the 3040–2950 zone.
If price breaks and holds above 3366 impulsively, it may signal early Wave-E continuation.
Bullish setups become favorable below 3044, where liquidity is likely absorbed — confirmation from the system remains key before acting.
📌 System-Based Order Limits (4H–Daily Confluence)
Bias >Entry Zone >Stop Loss (SL) >Take Profit (TP)
Sell Setup >3354.33 >3364.14 >3342.15
Buy Setup >3345.86 >3336.05 >3358.04
📌 System-Based Order Limits (Daily–Weekly–Monthly Confluence)
Levels derived based on structured order-flow logic. Not financial advice. Use them as context for anticipation and invalidation.
🔹 Daily Order Limits
Bias Entry Level Stop Loss (SL) Take Profit (TP)
Buy 3350.95 3281.20 3399.82
Sell 3302.39 3372.14 3253.52
🔸 Weekly Order Limits
Bias Entry Level Stop Loss (SL) Take Profit (TP)
Buy 3335.02 3192.49 3434.89
Sell 3235.80 3378.33 3135.93
🔻 Monthly Order Limits
Bias Entry Level Stop Loss (SL) Take Profit (TP)
Buy 3374.47 3097.33 3568.65
Sell 3181.54 3458.68 2987.36
🔁 How to Use This Information
Anticipation Zones: These are not "trade calls" — rather, they’re zones of interest where Smart Money might act.
Cross-Validation : Look for price reactions around these levels aligned with structure, volume, and bias thresholds.
Invalidation Clarity: If price breaks and holds above/below the SL levels, reassess the current wave position or pattern unfolding.
🧠 Final Insight
Including these order levels allows traders to:
Frame entries based on their preferred timeframes
See how short-term setups may align or contradict macro levels
Plan decisions more systematically, reducing emotional entries
🧠 Decision Framework
Instead of reacting emotionally, allow structure to lead the logic.
Let the market show its hand — real confirmation comes after traps are complete.
The true opportunity lies after the liquidity event, not during it.
> Timing Consideration: > When price moves past the Red, Grey, Green, and Blue dynamic levels , it signals a potential shift—prompting readiness for entry. However, action should only be taken once a Buy/Sell order signal appears and is confirmed by the next closed candle. This ensures structured execution and prevents premature entries.
💡 This scenario is structured based on system rules, not prediction. Market intent unfolds dynamically — understanding the setup allows better anticipation and discipline.
The key-level to watch for Grey, Green and Blue dynamic level for guides:
Daily TF
Weekly TF
Monthly TF
As of the time writing this update – the micro cycle and key-level are relevant for watch:
2H TF
M45 TF
M15 TF

Gold Trends and Trading StrategiesThe gold market continued to fluctuate yesterday, and the price was repeatedly under pressure at the key position of 3250. At the weekly level, gold prices tried to rebound after bottoming out on Friday, but the upper short-term moving average formed technical suppression, and the daily line closed with a cross star with long upper and lower shadows, and the long-short game was fierce. From a technical perspective, the 4-hour chart shows a descending channel pattern. The price rebounded after testing the lower track of the channel many times, but it has never effectively broken through the 3250 central axis suppression. The hourly chart shows that the market maintains a rhythm of shock correction. The current daily line has two Yins and one Yang, but it has not effectively broken the previous low. It is expected that the bottoming and rebounding mode may continue today. In terms of operation, it is recommended to pay attention to the 3260-3200 range, and rely on the upper and lower edges of the channel to implement a high-altitude low-multiple strategy.
Gold operation suggestions:
1. Short near the rebound of 3247-3252, target 3230-3220.
2. Go long near the retracement of 3206-3215, target 3230-3245.

Gold’s 3200 mark is the key!Due to the ceasefire between India and Pakistan and the easing of the Sino-US trade war, gold opened directly and fell below 3280 and 3260 successively, so the decline of gold will continue.
From the gold hourly chart, the focus below is on the 3200 integer mark. If it falls below 3200 and cannot effectively stabilize, then gold will have a big double top here, and the next decline will extend to around the 3000 integer mark. On the contrary, if the 3200 mark is not broken, then the bulls will fight back, at least they will fill the gap again
So in terms of operation, it is not recommended to chase the short now. If you want to go long on gold, you can wait for it to fall back to the 3200-3210 area and stabilize before buying

After gold falls sharply, how should you trade in the short termAfter gold fell below 3400 today, it ushered in a big decline, falling directly below the key position of 3350. Since gold breaks down, let’s take advantage of the trend and go short
Since the bullish volume of gold market has been released, the bullish trend of gold needs to be repaired in the short term before it can rise further.
Trading idea: short gold near 3347, stop loss 3360, target 3327

Thinking and practical skills for winning in the 3360-3400 rangeAffected by the news, gold fell sharply at the opening. Successfully won. According to the trading strategy, we gave gold a wide range of fluctuations in the 3360-3400 range, which will not change much. It can be operated within the range during the day. The trading strategy analysis is accurate, and the key points are accurately grasped to enter the market, which brought us good returns during the day. The short-term rhythm is accurately grasped! Brothers who followed the trading plan should have also made very good profits. 🍻🍻🍻

GOLD / XAUUSD: Breaking the down channel (correction wave)Therefore, if the 21-day SMA holds in the event of a weak US Non-Farm Payroll (NFP) report, a rebound toward the immediate static support-turned-resistance at 3260 could occur.
A sustained move above that level would encourage Gold buyers to push further toward the former channel support, now acting as resistance, at 3405.

Gold continues to fluctuate widely, mainly long at low levelsAs gold broke below the 3300 mark in the European session, the market once again tested the 3270 first-line support, which is the edge of the lower track of the channel.
rading idea: Go long gold near 3270, with a strict stop loss of 3267 and a target of 3300

Gold bulls are not strong enoughGold has begun to form an inverted V reversal pattern in the 1-hour moving average. If the 1-hour moving average of gold begins to turn, then gold may have a deep adjustment. If there is no strong risk-averse news for gold, then adjustments are inevitable. Gold is at least volatile in the short term. Don’t chase too much easily. Pay attention to the pressure near 3450.
Trading idea: short gold near 3446, stop loss 3456, target 3426

GOLD, Is it 5th Wave?1. Sharp Movement, Steep Trade Angle
2. Length of 3rd Wave is equal to 5th Wave
3. Ascending Channel TGT is completed
4. Divergence in the Price Movement
5. Nifty Price Movement - It is at a breakout point. The Correlation between 2 asset classes is approximately Negative 0.30 to 0.35 post Covid
If this is the case, then price may not move beyond 1 Lakh
This will be a great opportunity to book the profit in gold; it may correct to 70000 or below in the next few months.

GOLD WEEKLY CHART MID/LONG RANGE ROUTE MAP UPDATEDWeekly GOLD Analysis: 17th February 2025
Hello Traders,
Here’s a weekly chart analysis of GOLD, offering an in-depth look at recent market trends and future outlook. Since October 2023, our consistent tracking has achieved 100% target accuracy, as shown by the Golden Circle markers on the charts. Let’s break down the highlights and what’s next.
Recap of Last Week’s Successes
Weekly Chart Highlights:
* EMA5 crossed and settled above Entry ✅ 2735 reached
* Bullish Target TP1: 2877 ✅ Achieved
* GoldTurn Levels at 2875 activated twice ✅ Reached
What’s Next for GOLD? Bullish or Bearish?
After hitting ENTRY LEVELS at 2735 and TP1 2877, we saw a small close above 2877 last week, leaving 3018 open as a potential target. We mentioned that an EMA5 lock would confirm this movement.
While EMA5 hasn’t locked yet, the close from last week provided a solid push upward, gaining over 500 pips. The long-term gap remains open, with more movement likely after last week’s candle body close.
Key Level: 2735 remains a critical zone.
GoldTurn Levels at 2875 and 2735 are active, and the price may revisit these levels before bouncing back to reach TP1 and beyond.
Recommendations & Strategy:
* Focus on EMA5: Watch its behavior around 2877 for key signals on short- and long-term trades.
* Support Levels: GoldTurn levels at 2875 and 2735 are vital for identifying reversal points and prime dip-buying opportunities.
* FVG Support: A range between 2835 and 2850 is also supportive.
For precise entry and exit points, check our daily, 12H, 4H, and 1H analyses for clearer market guidance.
We’ll continue to provide daily updates, insights, and strategies on our TradingView and YouTube channels every Sunday. Don’t forget to like, comment, and share to support our work and help others benefit!
The Quantum Trading Mastery

Road to 3200Gold had a strong 4hr timeframe rejection from the 2960-2980 zone.
Also had a triple bottom in the same area.
Showing super strong signs of another bullish run.
Gold is making the strong move up to the 3140 area once 3100 is broke.
Should get a small rejection off the 3140 zone before a strong push up to a new all time high.
Next all time high goal is 3200 🚀
Short Notes:
•Run up to 3140 (Small rejection/load up zone)
•Then Load up zone 3110-3100
•Take Profit area 3200
As always, trade safe during these high volatility times and go crush it!💰

XAUUSD Weekly Swing Trade Setup (Targeting New Highs)
Entry 2990
Last week's price action in XAUUSD was dramatic. Initial surges, driven by tariff announcements, propelled the pair to record highs. However, this was followed by a significant correction, leaving the market in a state of uncertainty as we enter the new week.
Considering the current market context (tariff implications, upcoming US economic data, central bank commentary) and the potential for continued volatility, this swing trade idea is indeed ambitious.
The Core Strategy:
We are anticipating a further decline in XAUUSD to a major support level. The key to this trade will be observing a strong rejection at this support, indicating renewed buying pressure. The ultimate goal is to capitalize on this potential rebound and ride the momentum towards making new all-time highs.
Key Considerations for the Coming Week:
Identify the Major Support Level: Pinpointing this level is crucial. It could be a significant previous swing low, a key Fibonacci retracement level, or a strong psychological barrier. Careful technical analysis is required to determine the most probable zone.
Confirmation of Rejection: We will be looking for clear bullish price action at the identified support. This could include bullish candlestick patterns (e.g., engulfing bar, pin bar), positive divergence on momentum indicators, or a break of a short-term downtrend line.
Risk Management: Given the ambition of targeting new all-time highs after a significant correction, robust risk management is paramount. This includes setting a well-defined stop-loss order below the identified support level to protect capital in case the rejection doesn't materialize. Position sizing should also be carefully considered.
Potential Catalysts: Be aware of the upcoming economic data and central bank commentary, as these events could significantly impact price action and either support or invalidate this trade idea.
Patience is Key: This is a swing trade, and the anticipated move may take time to develop. Avoid premature entry and wait for clear confirmation of the rejection at the support level.
In essence, this is a contrarian swing trade based on the expectation that the underlying bullish drivers for gold will reassert themselves after the recent correction. We are aiming to buy low at a significant support level with the high-conviction target of reaching new all-time highs.
Disclaimer: This is a potential trade setup idea and not financial advice. Trading Forex involves significant risk, and you could lose your capital. Conduct thorough research and analysis before making any trading decisions.

Gold is still weak, rebound can still be shortedThe 1-hour moving average of gold still continues to cross downwards, and the strength of gold shorts has not weakened; gold rebounds are still mainly short selling. Although gold rose after covering the gap for one hour, the upper shadow line soon fell. Gold is still weak overall, and gold is under pressure near 3050 in the short term.
Trading idea: short gold near 3042, stop loss 3052, target 3022
The above is purely a sharing of personal opinions and does not constitute trading advice. Investments are risky and you are responsible for your profits and losses.

Gold continues to fall, what will happen next week?After the gold price fluctuated sharply at the high level in the past two days, gold finally broke down on Friday. In fact, the market was too active in the past two days, and the overall volatility was very large. In fact, it was still a little difficult to trade. Although the overall outlook is bearish, the rebound amplitude is actually not small each time. Now sometimes it rebounds more than 20 US dollars in a few minutes, so it may continue to fall after a loss. Now that the gold daily high is covered by dark clouds, how should we trade next week?
The gold 1-hour moving average has formed a death cross downward, so the gold shorts still have power, and the short-term gold can only rebound. After the rebound, the shorts will continue, and then the gold will enter a shock. After the high-level plunge of gold, the shorts will be more dominant in the short term. Unless there is a big positive news, it is difficult for gold to rise directly. The resistance for gold's rebound is 3076. If it is under pressure, then gold's rebound will mainly continue to be short on highs.

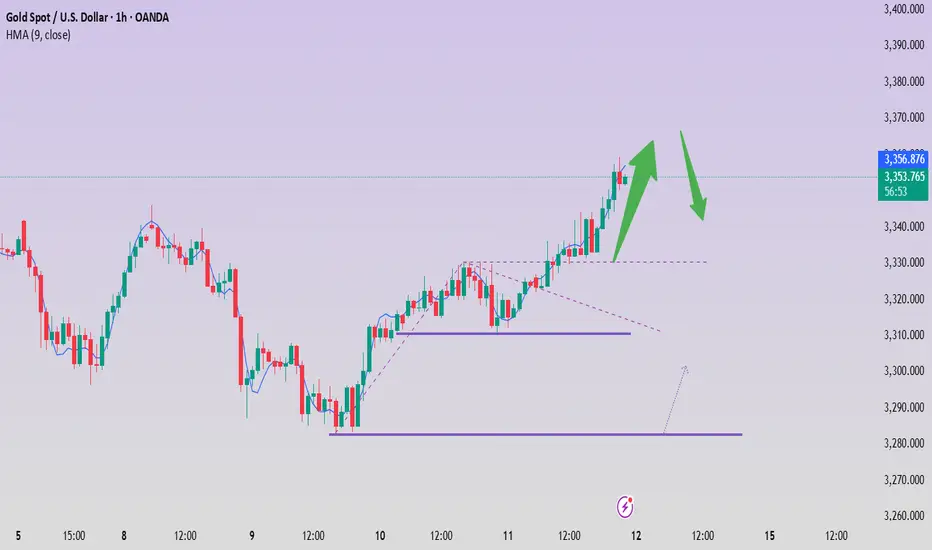
GOLD Bullish Trend Continues After FVG Test🟢 GOLD is maintaining strong bullish momentum after successfully testing a Fair Value Gap (FVG). A Break of Structure (BOS) confirms the uptrend, with higher lows forming—a clear sign of continuation.
📊 Analysis:
✅ Bullish Trend: The price structure confirms an uptrend with higher highs and higher lows.
✅ Fake Reversal Break of Structure (BOS): A key level has been broken, signaling reversal but based on current momentum that follows it shows Buyers continued strength.
✅ FVG Test Success: Price respected the Fair Value Gap, reinforcing buying pressure.
✅ 🎯 Target: , aligning with .
✅ 📈 Momentum: Strong upward drive suggests further gains ahead.
🔮 Potential Scenario:
The price is likely to continue climbing, forming a new higher high toward the target level.
📢 Confirmation Signals to Watch:
📌 Volume: Increasing volume on bullish moves.
📌 Candlestick Patterns: Bullish signals at key support levels.
📌 Moving Averages: Price holding above critical moving averages.
📌 🚨 Disclaimer: This is not financial advice. Trade responsibly and conduct your own research.
🔗 Tags:
#GOLD #XAUUSD #Bullish #TechnicalAnalysis #TradingView #FVG #BreakOfStructure #TrendAnalysis #PriceAction #MarketAnalysis

What reason do we have to go short?Gold hit a high and then fell back to meet the support of the moving average. Can you make money by going long on gold above 3130? In a bullish trend, just do what bulls should do and don’t worry too much about gold peaking. The market will give a signal when gold peaks. At present, we continue to do more in the trend.

You can't make money from such a simple market?After gold stepped back, it hit a new high again. Gold bulls continued to be strong. Gold broke through 3127 again, so the bulls are even better.
The gold 1-hour moving average continues to cross upwards and diverges. The support of the gold 1-hour moving average has moved up to 3096, but gold is now far away from the moving average, so wait patiently for adjustments and then step back to continue to buy. The gold 1-hour lowest yesterday fell to around 3100 and then stabilized again, so today gold will continue to buy on dips above 3100.
Trading ideas for reference:
Go long near gold 3110, sl: 3100, tp: 3130
