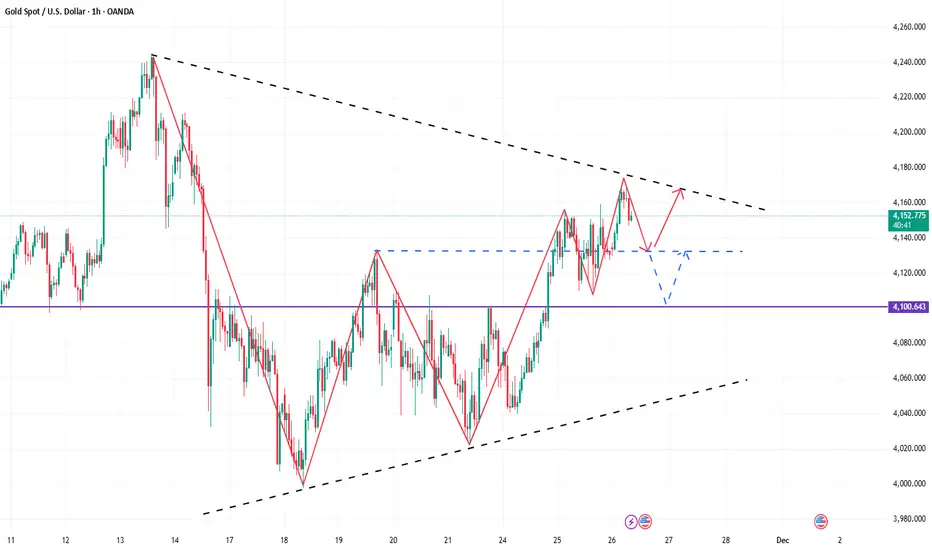
Seeking high-probability trading opportunities in gold.Gold Price Trend Analysis: Looking at the 4-hour chart, gold is currently showing a trend of both higher highs and higher lows. However, using a Fibonacci retracement level, gold is facing resistance at the 0.618 Fibonacci retracement level, specifically around 4155, which triggered a decline. However, it found support at the 4110-4100 area, a previous support level, ultimately closing above 4110. Therefore, today we need to pay attention to the support levels at 4110 and the psychological level of 4100. Long positions can be considered. Looking at the MACD indicator, the fast and slow lines were previously converging, but diverged yesterday as expectations of a Fed rate cut increased. This divergence may continue during the US session today. We need to watch for a break above 4155; if it breaks, a move towards 4180-4200 is expected.
The 1-hour moving averages continue to trend upwards, maintaining a bullish alignment. Reviewing the day's gold price movement, the overall trend remains upward, with a short-term pullback from the 4150-4160 area. It's important to note that gold has seen minimal pullbacks throughout its upward breakout. Even the pullback in the European session only tested the 4110 level before resuming its upward climb. The short-term upward trend remains intact. In the US session, consider buying on dips above 4100. The key resistance level is the same as on the 4-hour chart, at 4155. However, today's price action didn't see a pullback to 4100; instead, it fell to 4110 before rebounding. Therefore, it's highly likely that gold will surge upwards in the evening, breaking through 4155. The key level to watch then becomes 4180, which is the resistance of the previous trendline on the daily chart. In summary, today's gold trading strategy is to primarily buy on dips and secondarily sell on rallies. The key resistance level to watch in the short term is 4160-4180, while the key support level is 4110-4100. Please follow the recommendations carefully.
Goldplan

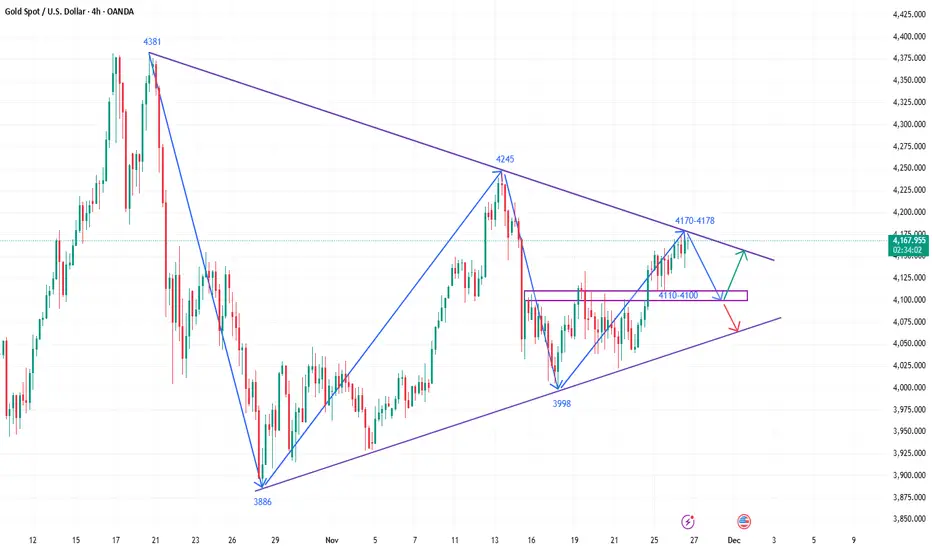
Analysis of key technical levels and trading strategies for goldGold traded in a range-bound pattern during yesterday's European and American sessions, closing with a bearish doji candlestick on the daily chart. This indirectly indicates the continued struggle between bulls and bears in the short term. Without a sustained upward trend, the range-bound trading is likely a way to digest excess energy from both sides. After opening higher, it reached a high of around 4169. Continuing from yesterday, the downward channel formed by the previous historical high will likely shift slightly lower to around 4170-4180. This level is crucial for the future direction of the market. A break above this level could potentially push the price up to 4200. Conversely, if this level holds, it would suggest that the current rise is not driven by bulls but rather a prelude and correction by bears to prepare for a potential further decline. The current support level is around 4110-4100, and the intraday price action will be particularly important. If gold breaks through the resistance level today, the bullish momentum will continue. Conversely, the bearish correction may also come to an end. If gold rebounds to around 4165-4180 today, consider shorting with a target of around 4150-4130.
The strategy of shorting gold was accurate.Today's bottoming strategy clearly indicated that gold should be shorted around the 4165-4180 resistance zone. From the opening to the afternoon, the market provided countless opportunities. We placed three short orders in the 4165-4180 area in our strategy, all of which were completed according to the rhythm, structure, and plan. The timing was perfect.
Gold Technical Analysis: The gold market is exhibiting a volatile and fluctuating trend. From a daily chart perspective, the current gold price is showing a wide-range fluctuation pattern, ultimately closing with a doji candlestick. Gold traded in a volatile manner on Tuesday, ultimately closing with a doji candlestick on the daily chart. Looking at the technical pattern formed by connecting recent highs and lows, the current gold price is generally trading within a triangle consolidation range, and this range is gradually narrowing. In the short term, it is necessary to continue to monitor the consolidation rhythm and wait for the market to choose a clear direction. The key resistance level to watch is around 4170-4180, while the short-term support level is around 4140-4120.
From a technical perspective, although the 5-day and 10-day moving averages have formed a golden cross, the short-term trend shows a divergence between the 5-day moving average moving upwards and the 10-day moving average moving downwards. This reflects the intense short-term battle between bulls and bears, and the possibility of continued price fluctuations. In intraday trading, the 4110-4100 area, where the 5-day moving average is currently located, should be the primary focus, as this level will serve as a crucial short-term support reference. Overall, today's gold trading strategy is recommended to primarily focus on selling on rallies and secondarily on buying on dips. The key resistance level to watch in the short term is 4170-4180, and the key support level is 4110-4100. Please stay tuned.

XAU/USD maintains bullish momentum–waiting for breakout at 4180🌍 Market Overview
Gold is currently trading around 4,170 USD, continuing its strong upward momentum.
Main drivers:
• USD weakness → money flowing into gold
• Falling bond yields
• Softer Fed expectations → higher demand for safe-haven assets
Gold continues to maintain a bullish structure, forming higher highs and higher lows.
________________________________________
📊 Technical Analysis
🔽 Key Support Zones
• 4148 – 4160 (new support after breakout)
• 4128 – 4135 (stronger support if deeper correction occurs)
🔍 Holding above 4148 is crucial to maintain the bullish trend.
🔼 Resistance Zones
• 4180 (near-term resistance – potential rejection)
• 4195 – 4200 (strong psychological resistance)
⚡ Current Momentum
• Price is above all short-term EMAs → BUYers are dominating
• Increasing volume → steady bullish pressure
• No clear reversal signals around 4164 yet
________________________________________
🔎 Outlook
Main trend: BULLISH
Scenarios:
• A pullback to 4148–4160 before rising would be ideal.
• A breakout above 4180 on H1 close → price may extend toward 4200.
• A break below 4148 → deeper correction toward 4135.
🎯 Trade Ideas
🔺 BUY XAU/USD – Trend-Following Setup
• Entry: 4151 – 4148
🎯 TP: 40 / 80 / 200 pips
🛑 SL: 4145
🔻 SELL XAU/USD – Counter-Trend (Only with rejection candles)
• Entry: 4195 – 4198
🎯 TP: 40 / 80 / 200 pips
🛑 SL: 4201

The bullish trend is back; seize the opportunity today.Gold prices briefly retreated to around 4040 after opening yesterday before trending upwards. The high has now reached 4155, a daily gain of approximately $115. The daily candlestick closed as a nearly full-bodied bullish candle, demonstrating a strong upward trend and raising market expectations for continued bullish momentum. This is especially true given yesterday's bullish breakouts through various resistance levels, with both momentum and strength showing signs of further strengthening. However, it is important to note that the downward trend formed by connecting the previous high and the second-highest point still exists, posing the biggest challenge to the bulls. Key resistance is concentrated in the 4160-4180 area, which will become a watershed between bulls and bears. If gold breaks through strongly and stabilizes above this level, it will likely continue to test the 4200 level. If it encounters resistance and falls back in this area, it means that this rise is more of a correction before a downtrend, rather than a true trend reversal. Support below is in the 4130-4110 area, which is an important retracement point and an extreme support level for the day. Given the current overall bullish structure, this area remains the core reference zone for gradually placing long orders during the day.

GoldXAUUSD
- Change of Characteristics
- Fair Value Gap
- Fibonacci Level - 61.80% / 78.60%
- Bullish Channel as an corrective pattern in Short Time Frame
- Order Block

Gold Extends Uptrend as USD Weakens📊 Market Developments:
Gold is trading around ≈ USD 4,145/oz. Expectations of a US interest-rate cut are weighing on the US dollar, which in turn is supporting the rise in gold.
📉 Technical Analysis:
• Key Resistance: ~ USD 4,190
• Nearest Support: ~ USD 4,070
• EMA: Price is currently above the 9-period EMA, suggesting bullish momentum for the short term.
• Candlestick/volume/momentum: Recent candles show modest upward movement with no strong breakout yet — watching for either a clear break above resistance or a rejection and pullback.
📌 View:
Gold could rise in the short term if price holds above ~USD 4,145 and breaks ~USD 4,150 – signalling further upside. Conversely, if price is rejected at resistance and breaks down support around ~USD 4,070, a correction is likely.
________________________________________
💡 Suggested Trading Strategy:
BUY XAU/USD at: ~ USD 4,133-4,130/oz
🎯 TP: 40 / 80 / 200 pips
❌ SL: ~ USD 4,126
SELL XAU/USD at: ~ USD 4,190-4,193/oz
🎯 TP: 40 / 80 / 200 pips
❌ SL: ~ USD 4,196

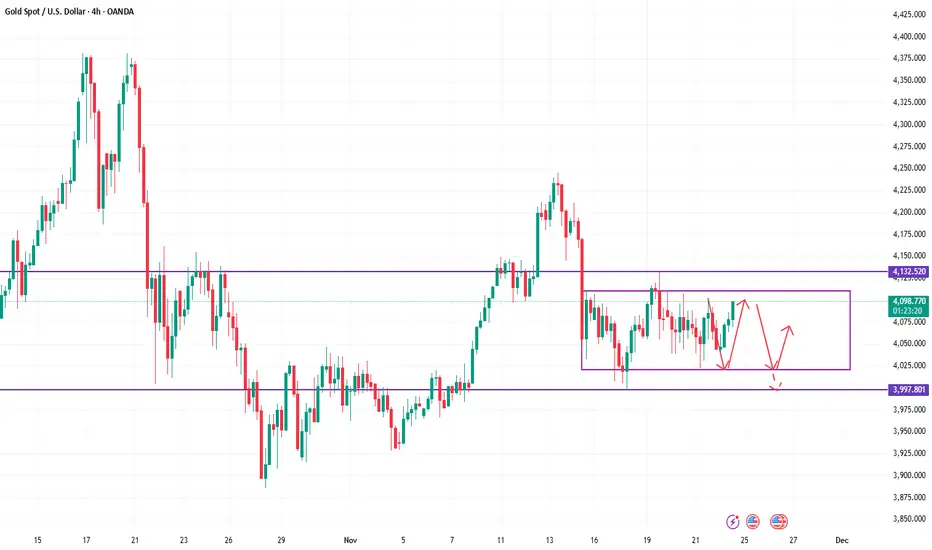
The time is right to operate on the upper and lower rails.When gold prices rebounded to around 4095-4110, they encountered significant resistance. This price level is likely a key technical resistance area. It could be the starting point of the previous price decline (i.e., the previous high), an important psychological level, the upper Bollinger Band on the daily chart, or a significant Fibonacci retracement level, such as the 38.2% or 50% retracement level. Near this price level, selling pressure will significantly increase. From a candlestick pattern perspective, this could manifest as a bearish engulfing pattern, an evening star pattern, or consecutive upper shadows, all indicating that the upward momentum is gradually weakening. Therefore, placing short orders in batches around 4090-4110 is advisable, anticipating a pullback after the price encounters resistance and then tests the lower support levels.
The 4030-4020 area forms a strong support level within the current trading range. This level may be a low point platform formed by previous pullbacks, the lower Bollinger Band on the daily chart, or the location of the upward trend line. When the price pulls back to 4030-4020, it will attract bullish funds to enter the market to buy on the dip, while short sellers will also choose to take profits, thus forming buying support. From an indicator perspective, if the price touches the 4030-4020 area, the Relative Strength Index (RSI) may enter the oversold zone (e.g., below 30), signaling an impending price rebound. Therefore, placing long orders near 4030-4020 is an attempt to speculate on a rebound to the upper part of the trading range after the price finds support here. The stop loss is set below 4020 to prevent a larger pullback if the support level is effectively broken.
In summary, the gold market is currently oscillating within the 4030-4020 and 4095-4110 ranges. Trading strategies should revolve around a "sell high, buy low" approach. When the price approaches the upper limit of the range, look for shorting opportunities, targeting the lower limit; when the price approaches the lower limit, look for long opportunities, targeting the upper limit. This strategy often yields good results when the market lacks significant fundamental news. Specifically, short gold around 4095-4110, targeting around 4050; and long gold around 4030-4020, targeting around 4070.
How to grasp the convergence of the golden triangle pattern?Gold Price Trend Analysis: After rising on Monday, gold closed with a doji on Tuesday and continued its upward trend today, reaching a high of around 4173. Overall, the market remains relatively strong. On the larger timeframe, the weekly chart shows solid support at the MA10 level, while the daily chart shows a tendency to form a triangle pattern. The upper edge of this triangle, around 4170-4180, will likely provide short-term resistance. Furthermore, considering the Thanksgiving holiday in the US market later this week, market activity is expected to be low. Therefore, range-bound trading is currently a suitable strategy for gold, but it may not be ideal for trading. This special timeframe could easily trigger a high degree of market manipulation, leading to abnormal price fluctuations.
Gold Technical Analysis: Looking at the 4-hour chart, the triangle consolidation pattern for gold remains unchanged. The downward trendline resistance is around 4170-4180. Only a decisive break above this trendline resistance will allow for further upward movement and a new round of opportunities. Otherwise, it will remain in a consolidation phase. On the 1-hour chart, gold is expected to continue its high-level consolidation today. The key support level to watch is the 5- and 10-day moving averages around 4110-4100. On the upside, the first resistance level to watch is 4170-4180. The possibility of testing 4200 depends on both technical and fundamental factors. Specifically, if gold holds above the moving averages throughout the second half of the week and provides further bullish fundamental catalysts, it might attempt to reach 4200 in the second half of the week. However, the uncertainty brought by the holiday season should be carefully considered in the second half of the week. In summary, today's gold trading strategy is to primarily sell on rallies and secondarily buy on dips. The key resistance level to watch in the short term is around 4170-4180, while the key support level is around 4110-4100. Traders must follow the trend, manage their positions and stop-loss orders carefully, strictly set stop-loss orders, and avoid holding losing positions.
XAUUSD _1h
Bullish Scenario: If price broke the top yellow resistance range line and candle close with a good body and no shadow on top we can open long position to the red line dynamic which sellers are there.
Bearish Scenario: If price broke the bottom yellow support line, candle close strong with good body and covered the previous low too, it is gonna be an interesting short position.

Short first, then go long. The rhythm was perfectly in place!The bottoming strategy suggested buying low and selling high in gold, and the expected pullback from the 4155 resistance level materialized. Buying near 4110 also precisely hit the low point, resulting in immediate profits. Those who followed the strategy reaped good gains. The intraday strategy of first selling and then buying gold perfectly executed.
From the current gold price structure, the price is gradually completing a shift from strength to weakness within a consolidation pattern. The current upward trend resistance remains concentrated in the 4160-4180 area. Only a decisive break above this trendline resistance will open up further upside potential and usher in a new round of continuation opportunities. Conversely, if it fails to break through, this area may still become a consolidation resistance at the end of a triangle pattern. Therefore, even with an overall bullish bias, it is not recommended to blindly chase the market in the middle. On the 4-hour chart, short-term support is around 4115-4100, while resistance remains around 4160-4180. Trading strategy should be based on the strength of the price action, buying low and selling high at opportune moments.

Seize the opportunity to short sell at high levels.Technically, gold closed last week in a range-bound manner, and short positions once again yielded good profits. Shorting in the 4080-4100 range, focusing on selling at higher levels, offered considerable profit potential. Given the overall bearish structure on the 4-hour chart, the strategy of buying low and selling high within the lower range, relying on strong resistance and support (primarily shorting), was also favorable for those who went long. However, given the overall bearish trend, going long against the trend is generally cautious and should be avoided, especially chasing rallies in the middle. There's not much to say technically; the overall strategy remains to patiently sell on rallies. Intraday, if there's another rebound, shorting in batches within the 4080-4100 range can be considered.

XAUUSD – Reading the Market’s Secret Intentions🌐 MARKET CONTEXT
Gold begins the new week with compressed volatility yet maintains a bearish overall structure on H1. Price continues forming Lower Highs → Lower Lows, suggesting Smart Money is still distributing at premium zones while accumulating at deep discount pools.
Current Market Drivers
USD strength remains stable → keeping gold under pressure
Market awaits midweek USD data → early sessions may be liquidity-driven
Institutional flows show no strong bullish commitment yet
Bias for the day:
🔻 Bearish until price reclaims key premium zones with a valid CHoCH.
🔺 BUY setups valid only at deep discount liquidity pools (3996, 4030).
📉 TECHNICAL ANALYSIS (Liquidity + SMC Structure)
Market Structure
H1 Trend: Bearish
Key premium zone above: 4146–4148
Mid-range equilibrium: 4060–4080
Discount demand clusters: 4030 & 3994
Liquidity Observation
Buy-Side Liquidity (BSL):
Above 4146
Above 4071 liquidity wick
Sell-Side Liquidity (SSL):
Below 4030
Below 3994 (major liquidity pocket)
Imbalances / FVG
Strong bearish FVG at 4146–4148
Minor imbalance at 4068–4071
Clear discount imbalance at 4032–4030
Deep liquidity vacuum near 3996–3994
🔑 KEY PRICE ZONES (Clear, Compelling Explanations)
1️⃣ 4148–4146 → Premium Liquidity Trap – Main SELL Zone
This zone contains:
Unmitigated H1 Supply Zone
Heavy BSL resting above recent swing highs
Major bearish FVG fill
➡️ A classic liquidity-engineered premium trap where Smart Money sweeps breakout buyers before reversing aggressively.
2️⃣ 4068–4071 → Mid-Range Liquidity Sweep – SCALP SELL Zone
Features:
Clusters of intraday stops from earlier longs
A small FVG acting as inducement
Positioned near equilibrium → perfect for fakeouts
➡️ Expect quick wicks and sharp rejections, ideal for short, high-precision scalps.
3️⃣ 4032–4030 → Discount Reaction – SCALP BUY Zone
This area offers:
Clean SSL located just beneath
Micro Demand Zone
A common reversal point during bearish cycles
➡️ Excellent for fast BUY scalps with tight risk, especially during London manipulation.
4️⃣ 3996–3994 → Deep Discount Reversal – GOLD BUY Zone
A high-value accumulation zone:
Contains significant higher-timeframe SSL
Aligns with deep-discount structure
Frequently used by Smart Money to reload long positions
➡️ If price taps this zone, a strong bullish rebound is very likely.
⚙️ TRADE SETUPS (High Precision Entries)
✔️ SELL GOLD – Main Premium Short
Entry: 4148–4146
Stoploss: 4154
TP1: 4120
TP2: 4080
TP3: 4030
Logic: BSL sweep → FVG mitigation → bearish displacement.
✔️ SELL SCALP – Mid-Range Sweep
Entry: 4068–4071
Stoploss: 4077
TP1: 4050
TP2: 4038
Logic: Engineered liquidity → immediate rejection expected.
✔️ BUY SCALP – Discount Liquidity Reaction
Entry: 4032–4030
Stoploss: 4024
TP1: 4045
TP2: 4068
Logic: SSL sweep → CHoCH likelihood → intraday rebound.
✔️ BUY GOLD – Deep Discount Long
Entry: 3996–3994
Stoploss: 3988
TP1: 4020
TP2: 4060
TP3: 4140
Logic: Strong institutional accumulation zone → potential formation of H1 higher low.
🧠 SESSION NOTES
Avoid trading mid-range to reduce chop exposure.
Best moves form after liquidity sweeps in London or during NY displacement.
Confirm entries with M5/M15 CHoCH + displacement.
Never buy inside premium zones; never sell inside deep discount zones.
🏁 CONCLUSION
Gold maintains a bearish structure, favoring SELL setups at premium liquidity traps 4146–4148 and 4068–4071.
BUY setups remain valid only at strong discount zones 4030 and 3994, where liquidity supports a clean bullish reaction.
Let liquidity form the trap. Then strike with precision.

Economic growth concerns may be overstated.Gold Technical Analysis: Last week, gold traded in a range. Monday saw a decline, Tuesday saw a dip to a weekly low near 3998 before rebounding to a positive close, Wednesday saw a rise followed by a fall, resulting in a small-bodied positive candle with a long upper shadow, and Thursday and Friday saw doji candles. The weekly chart ultimately closed with a small negative candle with upper and lower shadows, indicating continued short-term consolidation. Looking at the intraday chart, Friday saw another doji, reaching a high near 4101. The previous high of 4110 was not broken, and after a quick rise, the price returned to around 4050, clearly showing a tug-of-war between bulls and bears. This week, the market has been relatively quiet, with no major data releases. Given the limited movement in gold last week, consistently trading in a range from relatively low to high levels, a clear trend is not yet emerging.
Since the daily chart showed a pullback from around 4132, each subsequent decline has been followed by a rebound after testing the bottom. Therefore, this is a strong rebound, not a reversal. However, without a major positive catalyst, the previous resistance level of 4110 will be difficult to overcome. The rebound last Friday, followed by another surge driven by news, has likely extended the adjustment period. Today, Monday, there are no major news catalysts, and the consolidation and fluctuations at the weekly and weekly levels are not yet over. Therefore, the trading strategy for gold today remains range-bound, continuing the 4000-4130 range. The trading strategy is to maintain a short-selling approach, paying close attention to key levels. For now, gold is unlikely to experience significant price movements; a market stimulus is needed to break out with strong directional momentum. In summary, the recommended trading strategy for gold today is primarily to sell on rallies, with buying on dips as a secondary approach. The key resistance level to watch in the short term is 4100-4130, and the key support level is 4030-4000. Please follow the trend closely.

Gold's bullish and bearish trends were perfectly timed this weekGold Technical Analysis: Gold prices have been fluctuating between 4000 and 4110 in recent days, lacking a clear direction. This volatile market requires both caution and opportunity searching. Neither long nor short positions are inherently wrong; the key is precise entry points. Based on this week's closing price, gold reached a high of 4101 before retracing and closing at 4065. Next week, continue to monitor the range-bound movement. The monthly chart for gold may close with a doji, and next week will likely see continued range-bound trading. The weekly chart also shows a doji, indicating no clear direction. While the overall trend remains bullish, the pullback is not yet complete. Looking at the weekly chart alone, next week we temporarily recommend buying low and selling high within the 4110-4020 range until it is broken. A break above this range could lead to 4130-4150 or even 4200, while a break below could target 4000-3980. Strong support is at 3930, with an extreme low around 3886. The daily chart closed with a doji on Friday, so continue with a range-bound trading strategy on Monday.
Looking at the 4-hour chart, it is currently consolidating near the end of a triangle pattern. Once it breaks out effectively, there is an estimated profit potential of nearly $250. Before the breakout, operate within the trading range. Go long near the lower edge of the range around 4020 and go short near the upper edge around 4110. Go short a little earlier, around 4100. On the hourly chart, the moving averages are crossing upwards, indicating a bullish alignment. Currently, 4020 is a key short-term support level. If it holds, it will likely remain within the range. A break below this level could see strong support at the 4000 mark. The 4110 level also presents significant resistance; several attempts to break through have failed. However, this level is expected to gradually narrow over time. The longer the consolidation period, the stronger the subsequent breakout. The fundamentals of the bull market remain unchanged, and there is still room for further upward movement. In summary, the recommended trading strategy for gold is to primarily buy on dips and secondarily sell on rallies. The key resistance level to watch in the short term is around 4100-4110, while the key support level is around 4020-4000. Traders must follow the market closely, manage their positions carefully, and strictly adhere to stop-loss orders. Avoid holding losing positions. For specific trading instructions, please refer to the bottom notifications.

XAUUSD – Consolidation Before Possible Upside ExtensionGold has been fluctuating within a broad corrective phase, and recent swings suggest buyers may attempt to regain control if the current stabilisation continues. A continuation to the upside becomes a viable scenario should momentum support a renewed push in the coming sessions.
Disclosure: We are part of Trade Nation's Influencer program and receive a monthly fee for using their TradingView charts in our analysis.

XAUUSD 4H – Liquidity Map & Smart Money Outlook🌐 MARKET CONTEXT
Gold continues to trade within a bearish intraday structure, forming consistent Lower Highs → Lower Lows on the M30 timeframe. Price has been reacting strongly at Premium areas where Buy-Side Liquidity (BSL) accumulates, while showing clean rebounds at deeper Discount levels where Sell-Side Liquidity (SSL) resides.
Current Market Sentiment
USD remains steady → maintaining downward pressure on gold
Smart Money prioritizes selling at Premium and accumulating at Discount
Midweek environment → prone to liquidity sweeps before true expansion
Bias for the day:
🔻 Bearish bias, favor SELL setups at Premium zones
🔺 BUY only at deep Discount with CHoCH confirmation
📉 TECHNICAL ANALYSIS (SMC + LIQUIDITY STRUCTURE)
Market Structure
M30 trend: Bearish
Mid-range equilibrium: 4110–4175
Premium liquidity zone: 4378–4380
Deep discount zone: 3882–3884
Imbalances & Liquidity
Major bearish FVG: 4378–4380
Mid-level liquidity pocket: 4238–4240
Strong SSL levels: 3996 and 3882
🔑 KEY PRICE ZONES (Clear & Compelling Explanations)
1️⃣ 4380–4378 → Premium Liquidity Trap – MAIN SELL ZONE
This zone contains:
Buy-Side Liquidity from previous breakout attempts
An unmitigated M30 Supply Zone
A major FVG expecting full mitigation
➡️ Smart Money often drives price into this premium pocket to hunt liquidity before reversing sharply.
2️⃣ 4240–4238 → Mid-Range Liquidity Sweep – SCALP SELL ZONE
A highly reactive intraday level:
Holds clustered stoplosses from intraday traders
Sits near equilibrium → ideal area for engineered fakeouts
Often creates sharp wicks before reversing
➡️ Perfect for quick SELL scalps with minimal drawdown.
3️⃣ 3998–3996 → First Discount Reaction – SCALP BUY ZONE
This zone includes:
A clean SSL cluster just below
A sensitive micro Demand Zone
A common CHoCH reaction area on M30
➡️ Great for fast BUY scalps with tight risk.
4️⃣ 3884–3882 → Deep Discount Reversal Base – MAJOR BUY ZONE
This zone is extremely important:
Sits at the structural low on M30
Contains heavy Sell-Side Liquidity
Aligns with a higher-timeframe Order Block
➡️ If price taps here → strong reversal potential, possibly forming the weekly low.
⚙️ TRADE SETUPS (Detailed Execution Plan)
✔️ SELL GOLD – Main Position
Entry: 4380–4378
Stoploss: 4386
TP1: 4355
TP2: 4300
TP3: 4240
Logic: BSL sweep → FVG fill → strong bearish rejection expected.
✔️ SELL SCALP – Intraday Liquidity Sweep
Entry: 4240–4238
Stoploss: 4246
TP1: 4215
TP2: 4190
TP3: 4155
Logic: Sweep of mid-range liquidity → immediate downward displacement.
✔️ BUY SCALP – Discount Reaction
Entry: 3998–3996
Stoploss: 3990
TP1: 4015
TP2: 4045
Logic: SSL sweep → quick intraday rebound.
✔️ BUY GOLD – Deep Discount Reversal
Entry: 3884–3882
Stoploss: 3876
TP1: 3910
TP2: 3950
TP3: 3995
Logic: Major discount zone → high-probability reversal area.
🧠 SESSION NOTES
Avoid trading in the middle of the range
Wait for M5/M15 confirmation (CHoCH + displacement)
Do not buy at Premium zones
Do not sell at deep Discount zones
Let liquidity sweep first → then enter
🏁 CONCLUSION
Gold maintains a bearish intraday structure, favoring SELL setups at 4378–4380 and 4238–4240.
BUY opportunities appear only at strong Discount zones 3996 and 3882, where liquidity pools support bullish reactions.
Trade like Smart Money: wait for liquidity → strike with precision.

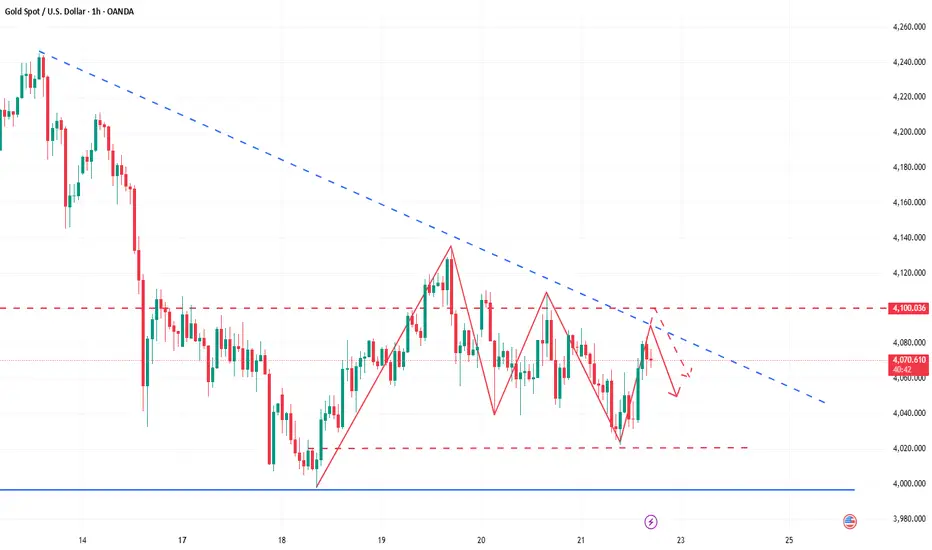
Gold rebound presents an opportunity,Why wait and do nothing?Following the release of supplementary US non-farm payroll data for September, the relatively strong job growth coupled with a resurgence in the unemployment rate has once again created a contradictory situation in the market. This has also led to growing disagreement within the Federal Reserve regarding whether to continue cutting interest rates in December. Judging from the recent tone of Fed officials' speeches, most officials lean towards a conservative and cautious approach, believing that maintaining the current interest rate is appropriate. The recent performance of the US dollar index best illustrates this point, putting significant pressure on gold, which has repeatedly weakened. However, there is clear buying interest at lower levels, with each sell-off followed by a rapid rebound, though the momentum has been weak. Intraday, gold retraced to around 4060, quickly rebounded to around 4080, and then fell back again. During the European session, it broke below the key short-term support around 4040, accelerating its decline and briefly touching around 4022. It then fluctuated before gradually stabilizing around 4030. Currently, the US session has seen another rapid rebound, mirroring yesterday's pattern. The recommended strategy is to look for opportunities to short after rallies. The short-term tone is set, and market sentiment is destined to be weak; at least avoid excessive shorting at lower levels.
Gold Trading Strategy: Sell gold in batches around 4080-4100, with a target of 4060-4030.
XAUUSD – Where Smart Money Strikes Today🌐 MARKET CONTEXT
Gold begins today’s session after a phase of controlled volatility, where price continued to sweep both sides of the range but failed to commit to a direction. The broader intraday structure remains bearish, with price rejecting premium levels and forming consistent lower highs.
Recent Drivers:
USD shows moderate resilience following firm Fed communication
Market sentiment cautious ahead of late-week economic announcements
No significant safe-haven inflow → neutral risk environment
Session Expectations:
London Session: Likely to trigger early liquidity sweeps above premium wicks
NY Session: Expected to deliver the main directional push
Bias: Bearish unless price reaches deep discount zones and prints a CHoCH
Price is currently trading within the middle of the intraday range → best setups remain at extremes (premium sells / discount buys).
📉 TECHNICAL ANALYSIS (SMC + LIQUIDITY STRUCTURE)
Market Structure
M30 structure remains bearish (Lower Highs → Lower Lows)
Current equilibrium zone: 4060–4080
Inducement stacking above 4147 and 4081
Liquidity Map
Buy-Side Liquidity (BSL): Above 4147 and 4081
Sell-Side Liquidity (SSL): Below 4033 and deeper cluster at 3993
These layers show engineered liquidity designed to trap impatient traders.
Imbalances (FVG Zones)
Bearish FVG: 4147–4148 → strong premium rejection zone
Minor FVG: 4079–4081 → ideal scalp sweep zone
Discount FVGs: 4033 and 3993 → high-quality buy reactions
🔑 KEY PRICE ZONES (Clear & Engaging Explanations)
4148–4147 ▶️ Premium Liquidity Trap – High-Probability Sell
This zone holds a clean bearish OB + untouched BSL above 4147.
Institutional traders typically use this area to trigger breakout buyers before reversing the move sharply downward.
4079–4081 ▶️ Mid-Premium Inducement – Scalp Rejection Zone
A compact liquidity pool sitting just above equilibrium.
Market often sweeps here during London session to induce buys before dropping.
4035–4033 ▶️ Discount Reaction Zone – Reliable Scalping Demand
Micro OB + SSL alignment makes this zone ideal for sharp intraday rebounds.
Expect fast reactions with minimal drawdown.
3995–3993 ▶️ Deep Discount Pool – Strong Reversal Zone
This region contains layered SSL + higher-timeframe discount confluence.
If price taps this zone, a significant intraday reversal becomes highly probable.
⚙️ TRADE SETUPS (SMC-Based, High Precision)
✔️ SELL SETUP 1 – Premium Rejection
Entry: 4148–4147
Stop-loss: 4126
TP1: 4135
TP2: 4105
TP3: 4080
Logic: BSL sweep + FVG mitigation → strong bearish displacement expected.
✔️ SELL SCALP – Mid-Range Liquidity Sweep
Entry: 4079–4081
Stop-loss: 4087
TP1: 4065
TP2: 4048
TP3: 4033
Logic: Sweep of inducement above mini-BSL before continuation down.
✔️ BUY SCALP – Intraday Discount Rebound
Entry: 4035–4033
Stop-loss: 4027
TP1: 4048
TP2: 4070
Logic: SSL sweep triggers a micro CHoCH → quick bullish bounce.
✔️ BUY SETUP 2 – Deep Discount Reversal
Entry: 3995–3993
Stop-loss: 3987
TP1: 4010
TP2: 4040
TP3: 4070
Logic: Key institutionally favoured zone → strong liquidity-driven reversal.
🧠 NOTES / SESSION PLAN
Only trade at extremes — avoid mid-range to prevent chop
Expect engineered fake-outs at London open
NY session likely delivers true directional movement
Wait for M5/M15 confirmation: CHoCH + BOS before executing
Avoid buying near premium zones to avoid falling into liquidity traps
🏁 CONCLUSION
Gold maintains a bearish M30 structure, favouring sell setups at 4147 and 4081.
Discount zones at 4033 and 3993 offer high-probability buy opportunities for intraday rebounds or full reversals.
Stay disciplined.
Let liquidity be your guide.
Strike only when the trap is set.

Gold continues to fluctuate; is it brewing a major move?Gold prices remained range-bound yesterday, reaching our suggested shorting points and support levels. The highest point reached was around 4110, before falling back to around 4040 in the US session before rebounding. The day closed with a bearish doji candlestick, a signal of a potential breakout. A breakout today would likely lead to further continuation of the downward trend. After a quick rebound to around 4088, prices fell again, with key support around the previous low of 4020. This level represents the last line of defense for the bears; a breach here would open up further downside potential, with the next target around 4000. However, this is only the first small target; a further break below this level could lead to a retest of the previous low of 3900.
The overall trend is currently weak and volatile. During the decline or rise, unexpected patterns may emerge. What we need to do now is patiently wait for the price to reach the resistance level or break out of the narrow range before following suit. Avoid blindly chasing highs and lows, as this could lead to losses during the consolidation phase. If gold rebounds to around 4065-4080, consider shorting, targeting 4050-4030. If it breaks through this level during the European session, look for opportunities to short during the US session rebound.

Gold may continue to decline toward 4020 – 4015 if 4030 breaks.📊 Market Overview:
Gold has fully broken the strong support zone 4045 – 4040 and quickly dropped to 4030, as the US Dollar strengthens and US Treasury yields rise. The market is reacting to recent Fed signals, giving sellers full control.
________________________________________
📉 Technical Analysis:
• Key Resistance: 4045 – 4055
• Stronger Resistance: 4065 – 4075
• Nearest Support: 4030 – 4032
• Stronger Support: 4020 – 4015
• EMA09: Price is below EMA09 on H1 → short-term bearish trend.
• Candlestick / Volume / Momentum: H1 candles form consecutive lower highs; volume rises on large bearish candles → sellers dominate.
________________________________________
📌 Outlook:
• Gold may continue to decline toward 4020 – 4015 if 4030 breaks.
• Conversely, a clear reversal candle around 4030 could trigger a technical rebound toward 4040 – 4045 before resuming the downtrend.
________________________________________
💡 Suggested Trading Strategy:
🔻 SELL XAU/USD : 4045 – 4048
🎯 TP: 40 / 80 / 200 pips
❌ SL: 4053
🔺 BUY XAU/USD : 4015 – 4012
🎯 TP: 30 / 50 / 100 pips
❌ SL: 4008

Focus on opportunities to buy on dips.My thoughts on today's gold price movement!
From a technical perspective, gold is currently still consolidating at high levels, with the consolidation narrowing. Gold will face a choice in the near future. Looking at the price action, yesterday's US session saw gold prices rebound to a high below 4110 before encountering resistance and trending lower again. This area remains a significant resistance zone, and it's a key resistance level for short sellers to watch. Since the price hasn't broken through this level yet, we should continue to analyze the consolidation, buying low and selling high. The main resistance level is around 4100-4110. Therefore, if gold prices directly retest the 4100-4110 area and a clear bearish pattern forms, short positions can be initiated. However, if the price breaks strongly above this area, it's best to avoid short positions. Conversely, if the price first falls to test the 4040-4120 support level, long positions can be considered.

Gold awaits non-farm payroll data for direction!Gold Technical Analysis: Today's highly anticipated non-farm payrolls report is a major event. This isn't just any ordinary employment data; it's the first employment report released since the US government reopened, drawing immense attention. Why is this non-farm payrolls data so crucial? Consider this: during the government shutdown, many economic data couldn't be released normally. Now that the government is finally back, this data is like a ray of light in the darkness, illuminating the latest situation in the US job market. Moreover, it will have a key impact on the Federal Reserve's future monetary policy direction, meaning it could potentially create significant volatility in the financial markets. Looking at Tuesday's ADP data, the focus is undoubtedly on weak employment and increased expectations of interest rate cuts. While there's already much speculation and analysis in the market, no one can guarantee the data will turn out well. If the data far exceeds expectations, it could give the US dollar a strong boost. How will the stock market, gold, and commodity markets react? If the data falls short of expectations, will expectations of a Fed rate cut intensify further? All these questions will be answered today.
Gold prices have fluctuated wildly these past two days, but this is in line with our expectations, and the market has cooperated. We've perfectly timed our long and short positions, and congratulations to those who followed our advice. After a morning surge followed by a pullback, gold has entered a period of low-level consolidation, continuing its back-and-forth movement. However, gold is likely to remain range-bound before the Non-Farm Payrolls report, so patience is key while waiting for the data. We've repeatedly bought gold around 4050-4030, and the expected rebound yielded several profits. Now, we're just waiting for the Non-Farm Payrolls report. Market conditions are constantly changing, and gold is currently consolidating within a large range, with the possibility of a sudden reversal. More patience, perseverance, and waiting are needed. Don't be impatient; haste makes waste. Let's witness together what kind of waves the Non-Farm Payrolls report will create in the US session.
