GOLD-Statistical Price Response ModelToday, we present the culmination of 2.5 years of intensive research, which has led to the development of an advanced statistical methodology for the precise identification of price levels (Supply and Demand). This study is founded upon a core premise: Price movement is not random, but rather a logical and measurable response to predefined areas that represent points of market equilibrium and oscillation.
We relied on a Rigorous Quantitative Historical Analysis of each individual price level (Support or Resistance), processing a matrix of Statistical Variables to deduce the Probability of the price's interaction with these levels.
🧮 Axes of Systematic Statistical Analysis:
The research focused on answering the following critical questions for every major level:
1- Breakout Event: Has the resistance or support level been confirmed as breached?
----*In Case of Breakout (Yes):
--------*Time-to-Revisit ($T_R$): What is the time period ($t$) taken for the price to return to
the breached level after moving away?
--------*Post-Breakout Momentum ($M_{PB}$): What is the percentage change in price after the
breakout and confirmed movement away?
----*In Case of Reversal (No):
--------*Time-to-Revisit ($T_R$): What is the time period ($t$) taken for the price to return to
the level after reversing from it?
--------*Reversal Magnitude ($R_{Mag}$): What is the percentage magnitude of the reversal
achieved after touching the level?
This data was processed using Mathematical Models and Inferential Statistics, allowing us to construct a Price Map that is nearly a reflection of the Empirical Truth of market movement.
📈 The Call for Observation and the Proposed Trading Methodology:
🎯 Your Task:
We invite you to engage in Systematic and Objective Observation only. Monitor the future performance of the price and its Interaction and Response to the levels shown on the attached chart. We ask only that you witness the power of this statistical model.
📐 Geometric Sequence Integration (Fibonacci):
To enhance the Trading Appeal and provide an additional framework, Fibonacci Retracement levels have been integrated between every major price level.
📘 Systematic Decision Rule (Algorithmic Trading Rule):
Adopt a simple yet effective rule to filter your trades:
----*Bearish Indicator: If the price is below the 50% Fibonacci level (the geometric center
between the two levels), look for Short Positions, targeting the next lower level.
----*Bullish Indicator: If the price has broken the 50% Fibonacci level, look for Long Positions,
targeting the next higher level.
⚠️ Crucial Validation:
The Breakout Confirmation must be validated by a full Price Candle Close above or below the level. An instantaneous price spike is not considered a valid signal for applying the rule.
-----------------------------------------------------------------------------------------------
This methodology represents a qualitative leap in market analysis, transforming Supports and Resistances from mere lines into High-Probability Decision Zones backed by mathematical logic.
YOU CAN CLICK TO SEE CHART : www.tradingview.com
Goldplan
GOLD H1: Possible Rebound if $4,060 Support Holds📌 1. Market Development
Gold has formed a wide trading range: a sharp drop to 4040 → a strong bounce to 4085 → now trading around 4075.
This indicates that the market is consolidating in a broad sideways structure, with strong buying pressure at the 4040 bottom and equally strong selling pressure near 4090.
📊 2. Technical Analysis
Resistance (H1):
R1: 4082 – 4085 (near-term resistance)
R2: 4095 – 4100 (strong resistance)
Support (H1):
S1: 4060 – 4065 (near support, market balance zone)
S2: 4040 – 4045 (major support, key swing low with strong buying reaction)
Technical signals:
H1 still shows mild corrective pressure but momentum is weakening.
Current structure: wide sideways range 4040 – 4090, best suited for trading at key zones.
📈 3. Outlook
Gold is likely to remain within the 4040 – 4090 range before forming a clear trend.
Holding 4060 → price may rebound toward 4080 – 4090.
Holding 4040 → high probability of a stronger bullish bounce.
Only a breakout above 4092 (H1 close) will unlock further upside momentum.
🎯 4. Suggested Trading Strategy (H1)
🔺 BUY XAU/USD
Entry: 4060 – 4063 (strong BUY zone)
🎯 TP: 40 / 80 / 200 pips
🛑 SL: 4037
🔻 SELL XAU/USD
Entry: 4088 – 4091
🎯 TP: 40 / 80 / 200 pips
🛑 SL: 4095

Don't miss this excellent opportunity to buy gold at low prices.In the current gold market, the price action is becoming clearer, with key support and resistance levels emerging. The 4050-4030 support zone deserves particular attention, as it offers strong support. If the price retraces to this level and successfully stabilizes, it would be an excellent entry point for long positions, potentially allowing bulls to launch an upward attack. Resistance is seen around 4110-4120. When the price first touches this area, it may face pullback pressure due to technical factors. However, if the price can consolidate and effectively hold above 4120, the possibility of further upward movement towards the 4150 target this week will significantly increase. Based on the current overall performance of gold, the market can be considered to be trading within the 4030-4120 range. The trading strategy should focus on buying on dips, taking advantage of rebounds from support levels to generate profits. At the same time, strict position control is crucial, as market conditions are constantly changing. Furthermore, it is essential to closely monitor real-time data and market dynamics to flexibly adjust trading strategies.
Gold trading recommendation: Buy gold in batches around the 4050-4030 range, with a target of 4080-4100.

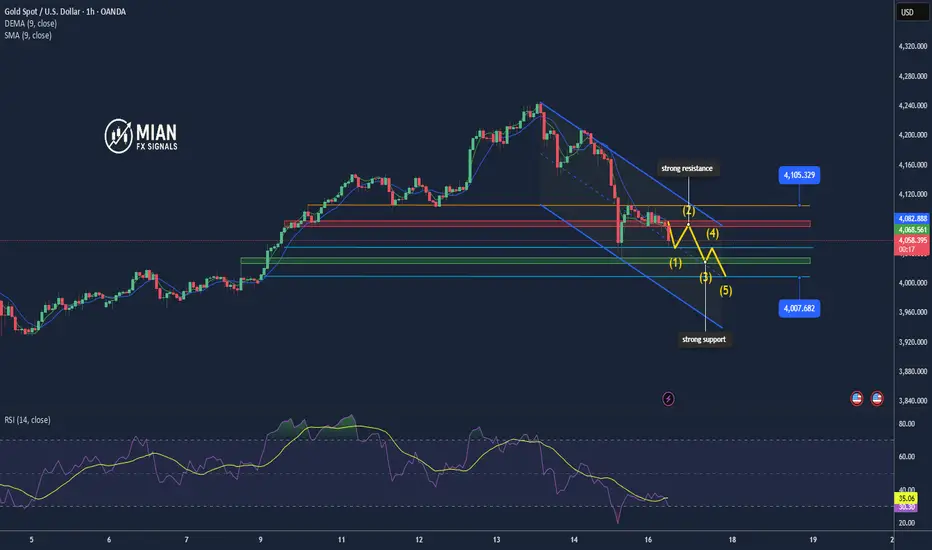
Gold Price Outlook – Trade Setup (XAU/USD)📊 Technical Structure
TVC:GOLD Gold (XAU/USD) is trading near $4,075, struggling to gain traction after a sharp intraday recovery. Price remains capped by the resistance zone at $4,081–$4,086, while intraday support is seen between $4,041–$4,045.
The structure currently favours a short-term bearish reaction, with price showing repeated rejection at the resistance zone. A break below $4,060 could accelerate downside momentum toward the support zone, while any sustained push above $4,093 would invalidate the bearish bias.
🎯 Trade Setup
Idea: Sell from resistance zone targeting retest of support.
Entry: $4,081 – $4,086
Stop Loss: $4,094
Take Profit 1: $4,045
Take Profit 2: $4,041
Risk–Reward Ratio: ≈ 1 : 3.4
Bias turns bullish only if price closes above $4,093.
🌐 Macro Background
Gold trades above $4,100 ahead of the delayed US September NFP report, which was pushed back due to the 43-day government shutdown, the longest in U.S. history.
FXStreet notes that:
“Gold edges higher to near $4,110 as uncertainty over US jobs data and cautious sentiment support safe-haven demand.” 【FXStreet】
NFP Impact:
A weaker-than-expected jobs report would likely revive expectations for a December rate cut, boosting gold through lower yields and a softer USD.
Fed Divisions:
The FOMC Minutes showed policymakers divided—some supporting further cuts, others opposing another move in December.
Market Pricing:
The CME FedWatch Tool shows only a 30% probability of a December rate cut, sharply lower than nearly 60% last week, limiting gold’s upside.
Overall, gold’s upside remains constrained by shifting rate expectations, but uncertainty around delayed data continues to provide safe-haven support.
🔑 Key Technical Levels
Resistance: $4,081 – $4,086
Support: $4,041 – $4,045
Psychological Level: $4,100
📌 Trade Summary
Gold remains trapped between resistance at $4,081–$4,086 and support at $4,041–$4,045. Price is showing rejection at resistance, favouring a short-term bearish pullback.
Downside targets lie at $4,045 and $4,041, unless incoming NFP data triggers renewed bullish momentum.
⚠️ Disclaimer
This analysis is for reference only and does not constitute trading advice. Trading involves significant risk, and proper risk management is essential.

Gold bulls launch a strong counterattack!After a prolonged period of narrow-range fluctuations, gold reached a high of around 4120 before pulling back. Currently, the overall structure remains bullish. Market conditions are constantly changing, and stubbornness is the worst thing in trading. Neither die-hard bulls nor die-hard bears can last in the face of the market. We should follow the trend; this is the fundamental logic of professional trading. Don't fight the market; just follow the trend. Currently, the bulls still hold the initiative in gold. Short-term pullbacks are more about consolidation than a trend reversal. As long as the upward momentum continues, pullbacks are opportunities, not risks. The key focus going forward is the pullback performance in the 4090-4070 area. As long as it holds, this area remains a good place to buy on dips. The market always punishes those who defy it. Hitting a wall is a lesson; understanding the direction is growth. Following the trend is the easiest and most stable way to trade. Continue to follow the rhythm; opportunities are for those who choose the right direction.

Once again, perfectly capturing gold trading opportunitiesIn yesterday's gold strategy, we emphasized the rebound correction at the 4000 level and the short position at 4080, and the market action has fully materialized! Congratulations to those who followed our advice.Gold is currently dominated by bears, and the overall structure remains weak. Short-term support levels to watch are the 4040-4030 area and strong support around 4000. Resistance remains concentrated in the 4080-4100 area. If the price rebounds to this area and fails to break through, short positions can still be considered. In short, the core logic for today remains unchanged: a weak, downward-trending market. Trading should focus on the aforementioned support and resistance levels, patiently waiting and positioning. The slower pace of the market movement means a longer trading cycle, thus requiring more patience in executing each trade. Until the trend changes, our overall strategy remains to primarily short at higher levels during rebounds, supplemented by buying on dips, proceeding steadily and following the trend.

Gold bulls rallied to reverse the trend; what's next?We perfectly timed both our long and short positions in gold, exiting all positions with profits. Now that gold is rebounding again, we should avoid shorting again and patiently observe the resistance levels above, especially the 4100-4110 area. Whether gold can break through this resistance remains to be seen. If your current trading is not going well, and we hope to help you avoid common pitfalls, feel free to contact us for discussion!
Based on the current gold price trend, we should first focus on the short-term support area around 4050-4030, and the resistance area around 4100-4110. The overall strategy should be to sell on rallies within this range. In the middle range, it's best to observe more and trade less, avoiding chasing the market. Wait patiently for key entry points. Specific trading strategies will be provided at the bottom; please pay close attention.

Will gold prices fall again after bottoming out and rebounding?Gold Technical Analysis: Gold prices initially fell below 4000 today, but rebounded during the US session. A significant reversal in initial jobless claims data propelled gold to around 4082, reversing the overall downward trend and pushing prices back into range-bound trading. While there were intraday rebounds, gold ultimately met resistance and fell, with higher highs continuing to decline, indicating a clear overall weakness. As I repeatedly emphasized yesterday, gold was poised for a drop, and I stressed the 4100 resistance level. I also repeatedly highlighted the strategy of selling on rallies. The key resistance level to watch is the 4080-4100 range, which was the sideways trading area at the end of yesterday's session.
Currently, the bears still have the upper hand. The short-term effective support is in the 4000-3990 range, while the resistance has been emphasized in the 4080-4100 area. If this area is touched again, another short position can be taken. In short, today's theme is still a weak downward trend with fluctuations. In terms of operation, you can wait for entry based on the above support or resistance levels. The slowdown in the fluctuation pace has extended the market cycle, so every entry requires sufficient patience.

Short first, then long; perfectly grasping the market rhythm.On Tuesday, the bottoming strategy suggested that gold should pay attention to the 4000 level for a rebound and correction. As expected, it rebounded to around 4040. After the opening, a short position was arranged at 4052, which reached the profit target of 4030 as expected. Then, a long position was arranged at 4000, which was closed at 4015. The intraday strategy was to first short and then long, reaping a profit of 37 pips!
Gold prices continued their weak opening on Tuesday, with selling pressure emerging after breaking below short-term moving averages yesterday. Although delayed data such as the September non-farm payrolls will be released this week, the results may reinforce the Federal Reserve's stance of holding rates steady, putting continued pressure on gold prices. Overall, gold prices are likely to adjust this week. With no major data releases today, the market focus is on speeches by Federal Reserve officials and changes in expectations for interest rate cuts.
Gold's technical outlook remains bearish. The hourly chart is still within a standard downward channel. After rebounding to around 4055 at the open, it fell back again, indicating a weak corrective structure. No effective reversal signal has been seen in the short term. The strength or weakness of the European session will be the key observation point for today's trend. The watershed above is still the 4045-4070 area. As long as the price continues to be pressured below this range, the bearish structure is likely to continue. The first support level to watch is the 4000 mark. If it breaks down effectively, the bearish target will continue to be around 3980. In terms of trading strategy, if there is a rebound to the 4045-4070 area before or after the European session, consider shorting gold in batches, following the channel structure. The overall outlook remains bearish.

How to properly seize gold trading opportunities?Gold Technical Analysis: Reviewing yesterday's gold price performance, it showed a clear downward trend overall. Specifically, the gold price moved downwards along the five-day moving average. This trend often suggests a short-term weak market from a technical analysis perspective. During the US session, the gold price experienced a significant decline, which undoubtedly exacerbated the tense atmosphere in the market.
From the daily chart analysis, gold closed yesterday with a medium-sized bearish candlestick with upper and lower shadows. This candlestick pattern contains a wealth of market information. The presence of the upper and lower shadows indicates that both the bulls and bears exerted their strength briefly during the struggle, but ultimately the bears prevailed, pushing the price lower and closing with a bearish candlestick. This forms a "three-day losing streak" pattern on the daily chart, indicating a short-term weak trend. From a trend perspective, the bearish pattern in the gold market remains unchanged.
Based on the above technical analysis and market trends, we can make a reasonable prediction for the future price movement of gold. We expect the price to further test the support level of the daily chart's lower trendline. Therefore, our trading strategy for today remains unchanged: shorting on rallies. Specifically, we will focus on the 10-day moving average as our entry point for shorting. On the downside, we will first look at yesterday's low. If the price breaks below yesterday's low, we can expect it to fall further. Taking into account various factors, we have identified the following specific resistance and support levels. The resistance levels are 4050-4070 and 4100, respectively. These levels have historically exerted downward pressure on prices and are key resistance areas that we need to pay close attention to during trading. The support levels are 4005-3980 and 3930, respectively. These levels are crucial points where prices may find support and rebound. Regarding trading recommendations, we suggest entering short positions in the 4050-4070 range. It is important to note that the market is fraught with uncertainty and risk, and the above trading strategy is for reference only. When making investment decisions, investors should fully consider their own risk tolerance and investment goals, and make decisions prudently. We hope every investor can have good luck in the market and achieve their investment goals. In summary, today's gold trading strategy is to primarily sell on rallies and secondarily buy on dips. The key resistance level to watch in the short term is 4050-4070, and the key support level is 4005-3980. Please keep up with the pace.

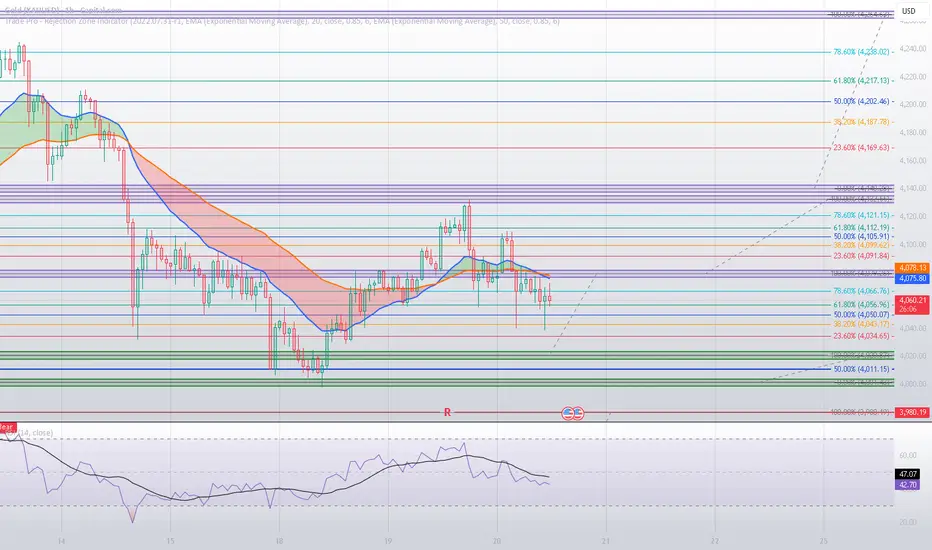
Gold Continues Short-Term Downtrend – Awaiting Retest of 4025📊 Market Overview
Gold dropped from the 4025 area down to 4005, with a rebound to 4015 acting as a technical reaction. Selling pressure remains dominant as the short-term market continues to monitor U.S. economic data and USD reactions. Investor sentiment is cautious, with no clear reversal signals yet.
________________________________________
📉 Technical Analysis
• Near resistance: 4022 – 4025
• Further resistance: 4032 – 4035
• Near support: 4005 – 4000
• Further support: 3970 – 3965
• EMA: Price is below EMA09 H1 → short-term bearish trend still dominant.
• Candlestick / volume / momentum: The most recent H1 candle at 4015 has a long lower wick → buying pressure is starting to appear, and this rebound is a technical pullback within the downtrend.
________________________________________
📌 Outlook
• Short-term trend remains bearish, with selling pressure still dominant.
• If price fails to break 4022–4025, it may continue falling toward near support 4000–4005, or further to 3995–3998 if the decline accelerates.
• If price breaks above 4025, the technical rebound could extend, opening a counter BUY opportunity, potentially testing further resistance at 4032–4035.
________________________________________
💡 Suggested Trading Strategy
🔻 SELL XAU/USD
• Entry zone: 4023 – 4026
• 🎯 TP: 40 / 80 / 200 pips
• ❌ SL: 4029
🔺 BUY XAU/USD
• Entry zone: 3968 – 3965
• 🎯 TP: 40 / 80 / 200 pips
• ❌ SL: 4062

Gold Holds the 4020 Support – Market Awaits the Next Breakout🔸 Market Overview
Gold trades around $4029/oz, slightly down. Daily range 4019–4055 shows strong volatility as traders await upcoming US data.
📊 Technical Analysis
• Short-term trend: mild bearish correction
• Resistance: 4042 – 4055
• Support: 4020 – 4012
• EMA20–50: price below → bearish momentum
• H1 Candle: long upper wick → sellers active
💡 Outlook
Above 4019–4020 → chance for a bounce to 4038–4045.
Below 4019 → drop toward 4010–4005.
No clear reversal yet — wait for confirmation.
🎯 Trade Setups
🔻 SELL XAU/USD: 4042 – 4045
🎯 TP: 40 / 80 / 200 pips
🛑 SL: 4049
🔺 BUY XAU/USD: 4019 – 4022
🎯 TP: 40 / 80 / 200 pips
🛑 SL: 4012

It's not that the market is good.We made the right call.Federal Reserve Governor Robert Waller stated that he supports another rate cut at the December meeting due to growing concerns about a sharp slowdown in the labor market and employment. Waller said, "I'm not worried about accelerating inflation or a significant rise in inflation expectations. My focus is on the labor market. After several months of weakness, the September jobs report later this week or any other data in the coming weeks is unlikely to change my view that another rate cut is necessary." Waller specifically noted that he favors another 25 basis point cut. He stated, "I'm concerned that restrictive monetary policy is putting pressure on the economy, especially its impact on low- and middle-income consumers. A rate cut in December would provide additional protection against a faster weakening of the labor market and move policy in a more neutral direction." At the same time, he indicated that price data suggests tariffs will not have a long-term impact on inflation, and another rate cut would be a risk management approach.
The overall tone was neutral, and gold's technical indicators also showed a downward breakout. The next step is to continue the downward trend with consolidation, and the 4000 level will soon be tested. I will focus on the timing of shorting here. The price is severely oversold in the short term, so aggressive shorting is not advisable. The first resistance level to watch is the 4050-4070 area, followed by the 4100 level. Support lies at 4000-3980; a break below this level could see a further 100 USD drop to the 3900-3880 area. The Bollinger Bands on the daily chart are gradually tightening, awaiting the release of the non-farm payroll data to determine the medium- to long-term direction. Currently, the overall strategy remains to follow the technical trend and sell on rallies. For strategy: short gold in batches at 4050-4070 with a target of 4020-4000 (hold if it breaks through). A second short entry point is at 4095-4100. For a short-term long opportunity, watch the 4000 level (short-term counter-trend long positions should target a 15-20 USD profit).

Gold bulls are losing momentum Arebound means continuingto shortLast week, the longest government shutdown in the US ended. Key economic data will take time to be released, and Federal Reserve officials have been releasing hawkish signals, reducing the probability of a December rate cut. Gold prices rose overall, boosted by a weaker dollar and safe-haven demand, reaching a high of $4245 last week. Silver followed a similar trend but rose even more, once increasing by nearly 10%. On Friday, both spot gold and silver experienced a rapid drop, narrowing the weekly gains. Gold, which reached a high of around $4210, plummeted to around $4030, a drop of up to $180. With the government shutdown over, market trends are likely to change. Gold's historical high of $4381 this year is unlikely to be surpassed this year, and even if it is, it will likely be next year. In my view, last week's high of $4245 was a secondary high. The upward trend that began on October 1st when the shutdown started is coming to an end, and a pullback to the starting point of this upward trend, around $3850, where the shutdown began, is possible.
As seen on the daily chart, gold's short-term support is currently at 4050. Since last Friday, this level has not been breached. As long as 4050 holds, gold is likely to continue oscillating within the 4050-4100 range for a few more days. However, it's important to note that if the daily chart breaks below 4050, caution is advised, as the move could accelerate, potentially targeting the 4000-3900 range. A break below 3900 would likely lead to a return to the starting point around 3850. If strong support is found, it would likely be around 3850-3800.
Secondly, looking at the short-term 4-hour chart, if gold fails to break below 4050, the next resistance levels are around 4080 and 4100. The immediate target is the 4050-4105 range. If it returns above 4100 today, it could reach around 4110. However, it's crucial that 4100 is not breached and held. If it reverses and breaks the high of 4110 from last Friday night's rebound, gold might test 4150, which could be considered the limit of this rebound. This possibility exists and should not be ignored. Of course, the overall trend is bearish, and unless it returns to the 3850-3800 range, avoid rushing into long positions.

Gold's upward momentum is weak, so shorting is the only option.Gold Technical Analysis: Gold suddenly entered a downtrend at the end of last week, with a target price around 4210. On Friday, it reached a high of around 4211 before retreating, breaking below 4100 to around 4032, resulting in a large bearish candlestick on the daily chart. The question now is whether this downward trend will continue. The daily chart shows a consistent decline in highs, suggesting that the resistance level at the three key points could easily trigger a second downward reversal. Therefore, we should expect a pullback at the beginning of this week. Therefore, at the beginning of this week, we definitely expect gold prices to continue falling. However, since the fast and slow lines are still above the zero axis, even if prices fall, it will only be a pullback. Looking at the candlestick chart, the trendline support is around $4,000, which is both our target for shorting this week and a place to try to place long orders. If it breaks down, it may test the lower Bollinger Band at $3,890. However, it should be noted that the halfway resistance level of Friday's full-blown bearish candlestick is at $4,130, which is also the highest point of the rebound in the two days following the sharp drop on October 21. If gold prices break through this level again, it will mean the end of this round of pullback.
Gold rebounded slightly after the opening but continued to face pressure at higher levels and fell back again. In the short term, the 4110-4120 area has formed effective resistance. If the rebound is still pressured by the 4110-4120 area, then the gold rebound is extremely weak, and there may be some room for further adjustment. However, even if the gold rebound is slightly stronger, the resistance below 4150 still indicates a head and shoulders pattern on the 1-hour chart, favoring a short-term bias towards range-bound selling. Today's core strategy should be to sell on rallies. Although there was a technical rebound after Friday's sharp drop, the rebound strength was limited. As long as it cannot break through the key resistance of $4120, any rally is an opportunity to short. It is necessary to pay close attention to whether the rebound shows signs of exhaustion. If the rebound of the right shoulder is insufficient, the head and shoulders pattern will be officially established, and the gold price may face a deeper decline. Therefore, today's strategy is still to sell on rallies.

Gold Weakens Further After Breaking 4055 – Downside Risk Expands📊 Market Overview
Gold has dropped to 4050 as buying pressure weakens, with the market awaiting fresh catalysts from the European session. Cautious sentiment dominates, preventing buyers from regaining momentum after the earlier rise.
📉 Technical Analysis
Key Resistance Levels
• R1: 4060 – 4068 (near-term resistance)
• R2: 4078 – 4085 (strong resistance during EU–US sessions)
• R3: 4098 – 4105 (major rejection zone; a breakout would confirm a larger bullish trend)
Key Support Levels
• S1: 4050 – 4042 (nearest support)
• S2: 4035 – 4028 (strong support with high probability of rebound)
• S3: 4015 – 4008 (deep support; breaking below may form a medium-term downtrend)
EMA & Momentum
• Price is trading below the EMA 09, confirming short-term bearish momentum.
• Bearish momentum remains strong with weak pullbacks and no reversal patterns.
Candle Structure
• M5–M15 candles show sellers actively suppressing price around 4055.
• A break below 4048 may trigger stronger selling pressure.
📌 Outlook
Gold may continue to decline in the short term if it breaks clearly below 4048, targeting 4042 → 4035.
Conversely, if price closes above 4058, short-term bullish momentum may return, aiming for 4068 → 4078.
💡 Trade Ideas
🔻 SELL XAU/USD : 4082 – 4085
🎯 TP: 40 / 80 / 200 pips
❌ SL: 4088
🟢 BUY XAU/USD: 4011– 4008
🎯 TP: 40 / 80 / 200 pips
❌ SL: 4005
What's next for gold after its sharp drop?Gold Technical Analysis: Last week's gold market was incredibly exciting, like riding a crazy roller coaster. Gold, which had been soaring all the way, suddenly plummeted on Friday, dropping by $180. This plot twist caught many off guard, leaving many investors bewildered. So what will happen to gold this week? From a technical analysis perspective, the daily chart closed bearish with a significant drop, indicating substantial upward pressure in the short term. The market outlook is less optimistic. The 4000 level is crucial; if it holds, the market may consolidate for a while. However, if it breaks, it's likely to seek support around 3930 or even lower, near 3886. The 4-hour chart is currently in a consolidation phase. If the market can recover lost ground and reclaim key moving averages, the bulls still have some hope. Otherwise, the bears may continue their rampage.
Gold has formed a head and shoulders pattern on the 1-hour chart. If it cannot regain a foothold above 4150 this week, then the 1-hour rebound will form the right shoulder of the head and shoulders pattern. Therefore, if gold rebounds this week and is pressured below 4150, continue to sell on rallies. After Friday's sharp drop, there may be a rebound correction at the beginning of the week, and then we will see how strong the rebound is. As for the trading strategy this week, I think selling on rallies is the most reliable approach. If gold rebounds to around $4110-$4120 early this week, this is a key resistance zone from the previous period and also near the high point of Thursday night's rebound. It is highly likely to encounter resistance. Aggressive traders can consider shorting with a small position, with a target of $4050-$4030. For a more conservative approach, wait for a rebound to the $4140-$4150 range before placing short orders. This is the upper edge of the previous consolidation range. The initial target is $4100-$4080. If the downtrend continues, look towards the $4000 psychological level, or even lower to the $3930-$3887 area.

Gold prices fell as expected,The next big opportunity is brewingGold Technical Analysis: Let's first discuss why the price has fallen so sharply, and the core point hits the nail on the head! Expectations for a Fed rate cut have completely cooled down! This is the most direct trigger! Recent US ADP employment data has surged higher than expected, suggesting the economy isn't as weak as it seemed. The previously certain "December rate cut" has now completely changed, with some institutions even saying there might only be one rate cut this year! It's important to understand that gold is a non-interest-bearing asset. As interest rates are expected to rise, the cost of holding gold increases, causing funds that previously rushed to buy to immediately withdraw. With a wave of selling, how can the price of gold not collapse?
Today, after gold broke through the key support level of 4150, we suggested shorting. As expected, it fell sharply. Unfortunately, gold continued to decline without giving us another chance to rebound. So let's wait patiently for an opportunity. We can't rush into the market in the current situation. Be patient and wait. If there's no opportunity, we'll try again next week. Have a peaceful weekend. As market expectations for a December rate cut continue to decline, gold prices are under increasing pressure.
Tonight, watch the 5-day moving average around 4035-4030 for gold. If it closes below this level today, market sentiment at the beginning of next week will likely be bearish and expect a correction. The 4035-4030 area is quite important, as it was the breakout point for the bulls on Monday and a previous support/resistance level. Given that it's Friday, bears shouldn't be greedy before a breakout and should wait for the weekly close. Normally, a market decline cannot be completed in one go, and a rebound is expected in the 4035-4030 range. As expected, we seized the opportunity to take profits, and the timing was exactly in line with our prediction. The rebound was met with resistance at 4110, and the market continued to fall. This round of decline is heading towards a break below 4000, followed by a test of 3886-3600! In the evening, the focus for gold remained on holding short positions and shorting at higher levels. If the price does not rise above 4120 tonight, short positions can be held over the weekend. Try to maintain a stable approach and wait and observe if there are no good entry points. In summary, today's gold trading strategy is to primarily sell on rallies and secondarily buy on dips. The key resistance level to watch in the short term is 4110-4120, while the key support level is 4030-4000. Please keep up with the pace. It is essential to manage position size and stop-loss orders carefully, strictly set stop-loss orders, and never hold onto losing positions.

GOLD Overall Structure (1D Timeframe)✅ 1. Overall Structure (1D Timeframe)
• A descending corrective channel (yellow lines)
• Major rejection at the channel top
• Price making lower highs (LH) → still bearish structure
• Price currently sitting below the mid-range of the channel
This means:
👉 Gold is still in a corrective downtrend, not bullish yet.
👉 High probability the market wants to fill lower OBs before any breakout.
________________________________________
✅ 2. Key Areas I Highlighted
🔷 1D TF FVG (4,107–4,150) – Major Resistance
• This zone is extremely important.
• Price has failed here multiple times already.
• As long as price is below this → bearish pressure continues.
This is the “breaker” level for bulls.
________________________________________
🔴 1D OB Zones Below (Demand Areas)
I mapped the OB zones correctly:
1️⃣ OB: 3,990 – 3,950
• First liquidity target
• Already almost tapped/mitigated
• Still valid for another reaction
2️⃣ OB: 3,929 – 3,885
• Stronger demand
• Highly likely to get tapped if the rejection continues
• My trendline bottom also aligns here → confluence
3️⃣ OB: 3,800 – 3,700
• If price breaks deeper into channel
• This is the next liquidity layer
These OBs line up perfectly with my descending channel.
________________________________________
Extreme Liquidity Below
I noted:
• 3100
• 3000
• 2600
These are macro liquidity harvest levels, NOT near-term.
Price falls here only if:
• Channel breaks down
• Major macro bearish shift occurs
→ Not likely in the next few weeks unless massive catalyst.
________________________________________
✅ 3. Updated Structural Reading (Using New Drawing)
A. Price recently failed to break the upper channel
This supports more downside.
B. I drew an ABC correction
The new chart also still shows:
• A → B → C decline likely forming
• Potential completion at the lower trendline
This supports a drop before any rally.
C. My white projection (V-shape recovery)
This large bullish projection is valid ONLY if:
• Price touches lower OB
➡️ 3,929 – 3,885
• And then breaks back above
➡️ 4,150
Only then the big bullish run can start.
________________________________________
📉 4. Most Likely Path (Updated With New Chart)
Based on my new structure:
Primary Scenario (70% probability)
Price drops to the lower OB:
→ 3,929 – 3,885
Possibly even wick into:
→ 3,800 – 3,700
Then:
Strong bounce → retest 1D FVG (4,107–4,150)
If rejection again → continuation inside channel.
________________________________________
Bullish Scenario (30% probability)
For my yellow arrow to be valid:
1. Price must touch the lower OB
2. Then form a strong reversal
3. Then break upward out of the descending channel
4. Then close above 4,150
5. Target becomes: 4,380 → 4,800
This matches my yellow long-term projection.
________________________________________
🎯 5. Key Levels to Watch (Updated)
Immediate Support
Level Significance
3,990 Weak OB – might not hold
3,950 First real support
3,929 – 3,885 🔥 Strong OB + channel bottom confluence
Immediate Resistance
Level Significance
4,107–4,150 🔷 Strong 1D FVG (must break for bulls)
4,200 Channel breakout level
4,380 First macro target
________________________________________
⭐ 6. Simple Final Summary (Very Clear)
My new chart indicates:
✔️ Market still bearish inside descending channel
✔️ Price likely drops to 3,929–3,885 OB
✔️ This is the best zone for bullish reversal
✔️ Bulls must break 4,150 to confirm trend change
✔️ If breakout happens → target 4,380–4,800
✔️ If OB fails → deeper channel drop to 3,700 OB
I drew the structure correctly. The analysis fully matches my levels.

Gold prices plummeted, but what exactly happened?Gold's technical outlook has shown clear signs of a reversal, compounded by recent comments from Federal Reserve officials that have reinforced bearish expectations. The bullish trend is struggling to hold, and prices rebounded quickly after touching the previous strong support level of 4030. We successfully captured this profit as expected, with the timing perfectly in line with our predictions. From a structural perspective, the short-term gold price movement is a technical correction after an oversold condition. This rebound is a normal technical correction and does not change the overall weak medium-term outlook. The market is likely to continue its downward trend through a period of consolidation. Strategically, the key short-term resistance level to watch is the 4090-4110 area. If the price rebounds but fails to break through this range, it will present a crucial opportunity to short. The overall strategy remains unchanged: focus on selling on rallies, and look for opportunities to short in the 4090-4110 area. Maintain a steady pace, follow the trend, and the market will naturally provide the necessary profit opportunities.

Is a gold price collapse signaling the end of the bull market?Today's market is likely to continue its downward trend. The strategy should be to sell on rallies. The primary focus is on the 4200 level, a key support/resistance level. If the downward trend continues, short positions can be initiated near 4200, with an initial target of 4145 and a further target of the key support at 4100. Only a decisive break below 4100 would confirm the formation of a secondary high. If the rebound holds above 4200, be wary of a large-scale market correction. Short-term resistance is around 4210; a break below this level would target yesterday's high, with the possibility of a second test to confirm the secondary high. Today's market is prone to surprises. While the technicals suggest a continuation of the downward trend, sudden fluctuations should be monitored. Initial resistance is around 4100; a short position can be initiated if it holds. Further upside targets are 4230-4240, where short positions can be initiated. Support is around 4100; a long position can be initiated if it holds.

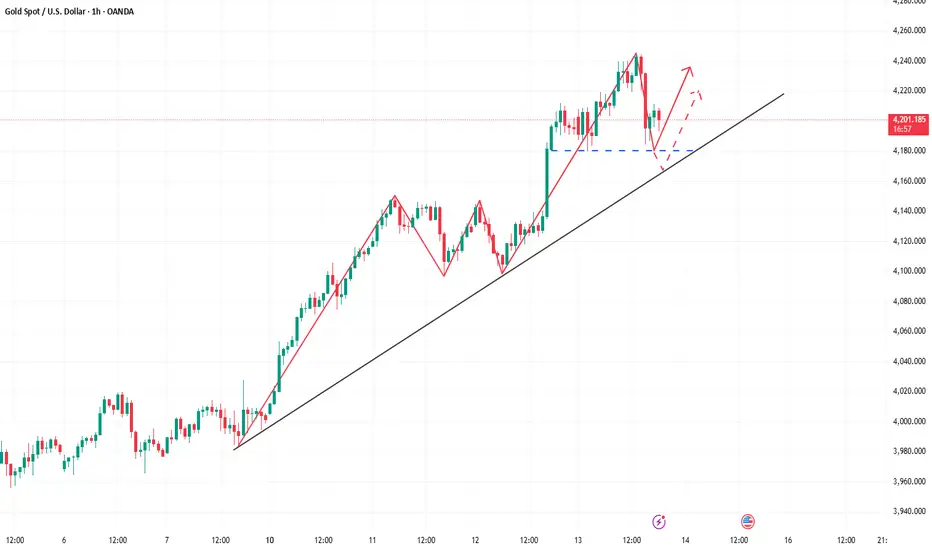
ANFIBO | Gold XAUUSD - BUY until Uptrend breaks [11.14.2025]Hi guys, Anfibo's here!
GOLD Analysis – Daily Trading Plan
Overall Picture:
Yesterday’s buy plan at 4185 worked perfectly, giving us a clean 250 pips almost immediately. With this momentum, our weekly target of 2000 pips is clearly achievable — as long as we stay disciplined and follow the plan without letting market noise disrupt our strategy. At the moment, price action shows gold holding firmly above a strong support at 4130, while the nearest resistance zones are forming at 4240 and 4255. These levels will define today’s trading opportunities as the market prepares for its next move within the ongoing bullish structure.
Trading Plan for Today:
>>> BUY ZONE:
(1) ENTRY: 4130 – 4145
SL: 4120
TP: 4205 – 4240
(2) ENTRY: 4180 – 4165 (Trend continuation entry)
SL: 4155
TP: 4235 – 4255
>>> SELL ZONE (Scalp Only):
ENTRY: 4255 – 4265
SL: 4270
TP: 4200 – 4130
Risk Management:
- Stick to small–medium positions while gold remains in a compression phase.
- Buy setups should be prioritized as long as 4130 holds.
- Keep Risk:Reward ≥ 1:2 and avoid chasing candles near resistance.
- Reassess bias only if price breaks and closes below 4130 with strong momentum.
Conclusion:
Gold continues to respect our levels beautifully, and the bullish structure remains intact above 4130 support. As long as this area holds, we maintain the bias of buying dips and targeting the upper resistance zones at 4240–4255. Stay patient, follow the plan, and let the setups come to you — consistency is what delivers weekly gains.
HAVE A NICE DAY, GUYS!

How to seize the real turning point for gold?Due to recent complex news, the operations of major gold trading funds have become more covert and unpredictable. The market may reverse at any time, breaking the current upward trend. Even if a technical pullback occurs, its magnitude could be significant, and the potential risks cannot be ignored. Therefore, a cautious approach should be taken in trading. Avoid blindly chasing the rally and patiently wait for stabilization signals after a pullback before establishing long positions. This is currently a more prudent and cost-effective choice. Following the market rhythm and acting in accordance with the trend is the core principle of future investment. From the current structure, the support level to watch is the 4190-4170 area. The performance of this range will be an important basis for judging the market direction and formulating trading strategies. By steadily grasping the rhythm and responding to fluctuations in accordance with the trend, one can achieve greater stability and go further in the gold market.