ANFIBO | GOLD/XAUUSD - Keep BUYING bro [11.13.2025]I am ANFIBO!
GOLD Analysis – Daily Trading Plan
Overall Picture:
Once again, the market moved exactly as planned — our Buy entry at 4115 has delivered an impressive 1,300 pips in profit! This further reinforces the importance of trusting the strategy and following the trend. OANDA:XAUUSD continues to show strong bullish momentum, though it’s now entering a consolidation phase, with price likely to accumulate sideways between 4185 and 4220 on the H1 timeframe. As long as the price holds above 4170, the bullish channel structure remains intact. Today’s plan will be to buy near support within this consolidation range and ride the next upward impulse once momentum resumes.
Trading Plan for Today:
>>> BUY ZONE:
ENTRY: 4180 – 4195
SL: 4170
TP: 4240 – 4280 - ...
>>> SELL ZONE (Short-term scalp only):
ENTRY: 4235 – 4245
SL: 4250
TP: 4220
Risk Management:
- Continue to prioritize Buy positions in alignment with the dominant H1 uptrend.
- Avoid overleveraging near resistance, as volatility may spike during consolidation.
- Maintain Risk:Reward ≥ 1:2 on every setup.
- Only shift to a bearish bias if price breaks and closes below 4170 with strong momentum.
Conclusion:
Gold remains firmly bullish, and our previous buy setup has paid off handsomely. For today, the market is likely to move sideways between 4185 and 4220, forming a healthy accumulation zone before its next leg up. As long as 4170 holds, the trend is still our friend — we continue to buy the dips and aim for the 4240–4280 targets.
Stay disciplined, trust the plan, and let the market reward your patience.
WISH YOU THE BEST PROFIT!
Goldplan

Opportunities are plentiful; what's lacking is patience.Gold Technical Analysis: On Wednesday, a large bullish candlestick broke through the 4150 resistance level during the US session, ending the recent sideways consolidation. The price reached a high of around 4210. As we repeatedly emphasized on Wednesday, after consolidation, further upward movement was expected, opening a new upward channel. The market has largely lived up to expectations. The key focus now is on the sustainability of this upward move. Structurally, with this strong rally, all timeframes are in a bullish alignment. The immediate resistance levels to watch are around the 4-hour upper Bollinger Band at 4215, and the 0.786 Fibonacci retracement level, around 4275. These two levels are expected to provide some temporary resistance for the bulls. As the price has risen, the support level has gradually moved higher. The primary support level to watch in the short term is 4150. This level is a previous resistance zone that has repeatedly faced downward pressure and is currently a top-to-bottom reversal point. As long as the gold price holds above this level, the bullish trend will continue. The important support level is around 4100. As long as the price stays above this level, the upward trend will not change. Therefore, for the end of the week, we will continue to be bullish with 4150 and 4100 as support levels.
Gold prices have broken through the previous resistance zone around 4150 on the 4-hour chart. Both bulls and bears have made substantial profits over the past few trading days. If the price can hold above 4150, it is highly likely to reach 4250-4270 tomorrow. At the end of the trading day, pay attention to whether there will be a pullback followed by a second upward move. Also, watch for support around 4160-4150 in the final minutes of the trading day. The upward momentum after the recent breakout should continue, although the deviation in the smaller timeframes is slightly large. We should watch for any short-term corrections. On the hourly chart, watch the low of 4097 from Tuesday's pullback. The US session saw a rapid rise above 4150, indicating a low probability of a significant drop; at most, it will only be a pullback. Short-term focus should be on buying on dips, using the 4150 level (a previous support/resistance level) as support, and also looking for opportunities to buy at the 0.5 Fibonacci retracement level. In summary, today's gold trading strategy should prioritize buying on dips, with selling on rallies as a secondary approach. Key resistance levels to watch are 4250-4275, and key support levels are 4150-4170. Please stay on track.

A massive shockwave crashes against the golden roller coaster.Gold Price Analysis: Yesterday, gold rose but encountered resistance around 4150, then fell back to around 4100 before rebounding and entering a period of consolidation. As of this morning's trading, it failed to break new highs. The first wave of the upward trend since the short-term bottom at 3886 has stalled. 4160 is the starting point of the second wave of the decline after the previous drop from 4380. Short-term pressure and pullback correction are normal. The overall upward trend remains unchanged. The rise from 3886 to around 4150 represents an increase of approximately $265, and the pullback correction is entirely a normal technical adjustment. However, after encountering resistance around 4150, the upward movement will be delayed. After Monday's surge, many people thought that a rally of over $100 in a single day was coming again. But now, the market is generally in a large range of high-level fluctuations, and it's impossible for it to rise by $100 every day. However, the overall daily uptrend remains unchanged. After a short-term correction, a second wave of upward movement will begin. But there is one thing to be aware of: this wave is a rebound correction after the drop from 4380. If it takes too long to break through and fails to rise further, we should be wary of a weakening momentum and subsequent decline. So, if the market fails to break through the resistance of 4150-4160 after this period of consolidation, the bulls should be cautious.
Gold Technical Analysis: After the morning's pullback, the MACD lines turned downwards again, continuing the death cross signal. Gold prices also showed a structure of lower highs, currently under pressure at the $4145 level. However, since the fast and slow lines are still running above the zero axis, if gold prices cannot fall further and cause the fast and slow lines to cross the zero axis, the bulls may launch another counterattack. The failure to break yesterday's high in the morning indicates that the bullish trend has slowed down. However, the failure to break yesterday's low of $4097 during the Asian session suggests that the bears are not strong either. The battle between bulls and bears is intense, and gold prices have entered a new adjustment period. Therefore, today's strategy remains to sell high and buy low. In the second half of the week, gold will continue to focus on testing the support level below. Currently, the moving averages show signs of crossing upwards, increasing the possibility of gold extending its rebound. However, the short-term upward movement was too sudden and the magnitude of the movement was too large, which brings great difficulty and risk to the operation. Therefore, even if the short-term outlook turns bullish, in actual operation, it is still necessary to wait for a pullback before considering going long. Do not blindly follow the bullish trend without considering the price level. In summary, today's gold trading strategy is to mainly buy on dips and sell on rallies as a secondary approach. The key resistance level to watch in the short term is 4145-4160, and the key support level to watch in the short term is 4110-4095. Friends, please keep up with the rhythm.

Gold consolidates between $4100–$4115, awaiting breakout📊Market Overview
Gold (XAU/USD) is currently fluctuating around $4104 after a mild pullback from the $4112 zone.
The bullish momentum has paused as traders await fresh U.S. data, while the USD shows a short-term technical rebound.
Asian session liquidity remains thin — this is mainly an accumulation phase ahead of the European and U.S. sessions.
📉 Technical Analysis
• Resistance: $4118 – $4125 – $4140
• Support: $4100 – $4090 – $4078
• EMA50 (H1): Price is retesting dynamic support around $4100.
• RSI: 52 → Neutral, no clear selling pressure.
• Candlestick Structure: H1 candles are tightening, indicating a potential breakout setup.
📌 Outlook
Gold is consolidating in a narrow range.
If the price holds above $4100, the bullish trend could extend toward $4125–$4140.
However, a strong rejection at $4120–$4125 could trigger a short-term reversal.
________________________________________
💡 Trading Strategy
🔺 BUY XAU/USD : $4100 – $4097
🎯 TP: 40 / 80 / 200 pips
🛑 SL: $4093
🔻 SELL XAU/USD : $4122 – $4125
🎯 TP: 40 / 80 / 200 pips
🛑 SL: $4128

Perfectly grasp the rhythm of gold trading.Gold has maintained a strong upward squeeze this week, steadily climbing and breaking new highs. Currently, we are watching the 4145-4150 level as short-term resistance. A pullback and consolidation are needed to break through this level. The moving average system shows a bearish divergence, and the price has stalled at higher levels, failing to break through. There are currently no good entry points. Although the market outlook is bullish, we should wait for a pullback to the 4125-4110 area before considering long positions. The technical indicators need correction, so chasing the upward trend is not advisable. We should patiently wait for a pullback before looking for opportunities to go long!

GOLD HOLDS UNDER PRESSURE – RETESTING $3130 SUPPORT ZONE🟡 Market Overview
Gold (XAU/USD) is trading around $3137/oz, slightly lower amid bank holidays in the U.S., leading to thin liquidity and limited volatility within the $3130–$3145 range.
📊 Technical Analysis
• Resistance: $3145 – $3152
• Support: $3130 – $3124
• EMA 50: still sloping downward, indicating short-term bearish momentum.
• Candlestick Pattern: M15 chart shows rejection wicks near $3130, suggesting short-term buying defense.
• RSI (14): recovering from 35 to 45 — signaling a potential minor rebound.
💬 Outlook
Gold remains under moderate pressure but could see a technical rebound if $3130 holds firm. A recovery toward $3145–$3152 is possible before the next directional move develops.
🎯 Trading Strategy
🔺 BUY XAU/USD
Entry: $3130–$3134
🎯 TP: 40 / 80 / 200 pips
🛑 SL: $3124

Continue to buy gold after the correction!Gold opened on Monday and immediately began its upward trend, relying on the short-term moving average. It broke through two key resistance levels in succession, soaring once again. The daily chart showed a large bullish candle, breaking through the 4100 psychological level again, forming a strong upward spike and raising expectations for further gains. The weekly chart also broke through the short-term moving average again. Judging from the current pattern, the strength formed after the continuous upward movement is likely to continue strongly. Although there was a slight pullback during the US session, it ultimately continued its rapid upward climb. For now, we remain bullish on the gold market. The key resistance level remains around 4150, which will be the first target in the near term. The support level remains around 4110-4100, which is also one of the first pullback correction points for the bulls in the short term. If gold pulls back to around 4115-4100 during the day, we suggest going long on gold, with a target of around 4130-4150.

Right now, I've discovered another market opportunity.We publicly pointed out that we should pay close attention to the resistance in the 4100-4120 range. After encountering resistance, a pullback was expected. The market trend was largely in line with our expectations, with the lowest point reaching around 4074. We were very satisfied with the substantial profit we achieved.
There was indeed some upward movement during the day. This week, we need to focus on the news: Although the market continued its strong performance at the beginning of the week, it was easy to create the illusion that a "sharp rise was about to happen". However, the government shutdown is now in its final countdown, so we need to be wary of potential risks. Once the shutdown ends, the market may see a significant pullback. Since relevant news has already released signals, we should remain rational about the recent rise and not blindly follow the trend. There is always something fishy going on, so it is better to be cautious. For more detailed instructions, please refer to the notification at the bottom.
From a technical perspective, gold has repeatedly faced resistance near 4110 after breaking through 4100. It is severely overbought in the short term and shows signs of a potential top. I personally do not recommend continuing to buy at this high level to avoid a sharp drop, which is a common market shakeout pattern. Therefore, my strategy remains to prioritize short-term shorting. From the current structure, 4100 has not truly stabilized. Do not blindly and aggressively chase the upward trend. Focus on short-term adjustments and seize opportunities to trade within the time frame. Short positions can be initiated in the 4100-4120 range, with a target of 10-40 USD. The key support level to watch is 4050-4030, which can be considered as a range for buying on dips and medium- to long-term positions. It is best to remain on the sidelines and not participate in positions in the middle range. The 4100-4120 range remains a key focus for short-term bears. Market trends don't only rise or only fall. If you grasp the opportunities well, every phase can be a chance. Generally speaking, don't blindly chase the rise when you're bullish. Flexibly manage the rhythm of primarily long positions and secondarily short positions, and follow the trend to achieve steady success.

The gold price trend is clear; opportunities lie in the timing!At the start of the week, the gold price chose a clear upward direction, breaking through key resistance levels at 4030 and 4050, reaching a high near 4095. From the overall trend structure, the bullish momentum remains strong, and the short-term trend is still robust. However, the upside potential is gradually being limited. The biggest mistake in trend trading is chasing emotions. I personally prefer to focus on resistance signals in the 4100-4120 area. If signs of resistance appear, consider shorting at higher levels. If the price retraces to the 4050-4030 area and stabilizes, that would be a more stable entry point for long positions. After the breakout, the pace accelerates. The key now lies in entry points and execution. Avoid chasing highs and blindly shorting; steadily follow the rhythm and wait for market confirmation. True stability lies not in prediction, but in the unity of execution and rhythm.

Gold holds above 4050 — market consolidating before next moveMarket Overview
Gold (XAU/USD) is trading around $4056/oz, holding firm above the $4050 psychological level after strong Asian session gains. Safe-haven demand and dovish Fed expectations continue to support sentiment, though momentum is slowing near resistance.
📊Technical Analysis
• Resistance: $4062 – $4075
• Support: $4042 – $4030
• EMA50 (H1): price stays above EMA, confirming short-term bullish bias
• Pattern: consolidation above $4050; breakout above $4062 may target $4080
• Momentum: RSI near 65, still bullish but weakening slightly
💡Outlook
Bias remains bullish, but minor pullback likely before confirmation. A drop below $4042 would limit upside momentum.
🎯Trade Idea
🔺 BUY XAU/USD
Entry: $4042 – $4045
🎯 TP: 40 / 80 / 200 pips
🛑 SL: $4036

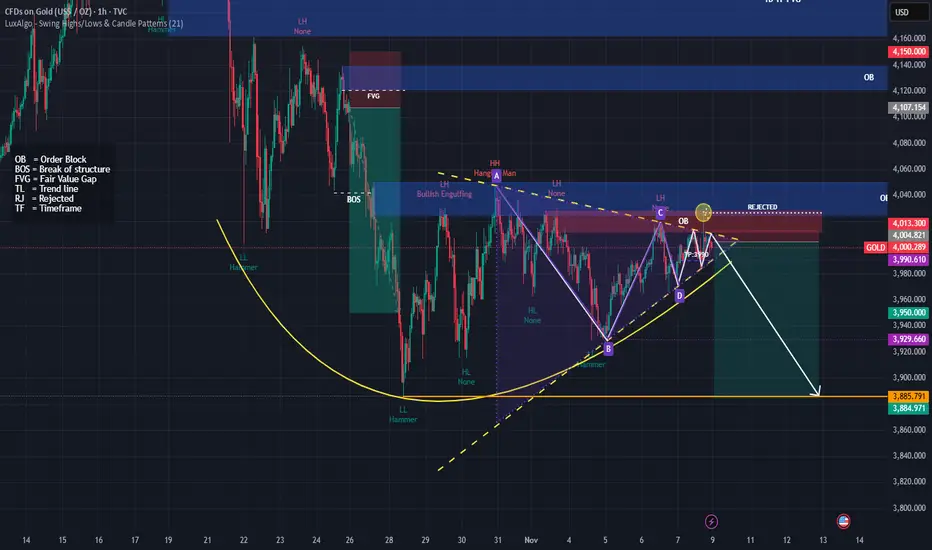
Rejected at (OB) $4013–$4020, next days 10th-14th target $3,885🧭 Overall Structure
The chart shows a potential bearish setup.
I have drawn a descending pattern (A-B-C-D) with rejection from an Order Block (OB) around $4,013–$4,020.
The white arrow projects a downward move toward 3,885.
🔍 Key Technical Elements
1. Order Blocks (OB)
Upper OB (~4,150–4,120): Higher timeframe supply zone; strong resistance if price rallies.
Current OB (~4,013–4,040): Recently rejected here — price reacted and failed to make a new higher high → confirms seller pressure.
2. Break of Structure (BOS)
A previous BOS occurred to the downside, suggesting bearish momentum took control after a temporary bullish leg.
3. Trend Lines (Yellow Dashed)
The upper TL connects lower highs → consistent downtrend.
The lower TL (support) was recently tested and might break soon — signaling bearish continuation.
4. Pattern
A–B–C–D harmonic-like pattern completed near the order block, often signaling a sell opportunity when it aligns with rejection zones.
Price formed a lower high (LH) at point C and another at D → confirms trend weakness.
5. Candlestick Rejection
“Rejected” and “Hammer” labels near point D and OB zone show failed bullish attempts → adds confluence for short.
🎯 Bearish Targets
TP1: 3,950 (nearest support)
TP2: 3,930 (previous low)
TP3 (Major): 3,885 (strong historical support zone)
⚠️ Invalidation
If price closes above 4,040–4,060 (OB zone), bearish setup invalidates.
That would mean liquidity grab and possible push toward 4,100–4,150 OB.
🧩 Summary
Bias Entry Zone Confirmation Targets Invalidation
Bearish 4,010–4,020 OB zone Rejection + lower high 3,950 → 3,930 → 3,885 Close above 4,060
The continuous short positions in gold have ended perfectly!Whether gold can break through resistance levels in the near term depends on the convergence of three factors: First, whether the US dollar and US Treasury yields experience a more sustained decline, creating room for discounting; second, whether risk appetite strengthens the "insurance demand" for gold due to equity volatility and increased macroeconomic uncertainty; and third, whether net inflows of funds continue, especially whether passive funds and longer-term allocation funds enter the market simultaneously. If these three factors fail to move in tandem, the price will likely continue to consolidate within the $3930-$4000-$4050 range. If they move in unison, the resistance above these round numbers will weaken more smoothly. It's worth noting that the People's Bank of China suspended its 18-month gold purchase program in May 2024 but resumed it in November of the same year. The market currently expects a 67% probability of a Fed rate cut in December, up from around 60% the previous trading day. The Fed just cut rates last week, and Powell stated that this may be the last rate cut this year. The market's current focus is on macroeconomic data and when the US government shutdown will end—which is also driving safe-haven demand for gold. The congressional gridlock led to the longest government shutdown in U.S. history, forcing investors and the data-dependent Federal Reserve to rely on private economic indicators. Since gold does not generate interest income, it typically performs well in low-interest-rate environments and periods of economic uncertainty.
Gold Technical Analysis: With the non-farm payroll data still pending, gold prices are likely to fluctuate little tonight, mainly consolidating. The battle between bulls and bears continues throughout the day. During the US session, gold rebounded to around 4027. We had already positioned short positions at 4015 and 4025, which subsequently fell back as expected, resulting in a profitable trade. This week's trading session has concluded perfectly, and we will not participate in the late-session trading. Our strategy remains to short below 4030.
From a technical analysis perspective, key resistance and support levels need to be monitored. The upper resistance level to watch is the 4020-4030 area. If gold prices can break through this range and hold, the upward trend may continue in the short term, potentially challenging higher levels. Before this breakout, we have consistently emphasized against chasing highs and have provided a strategy and analysis for shorting in batches around the 4015-4030 area. Those who follow me should have seen this. Gold faces significant upward pressure, and unless there is a major positive news event to stimulate a breakout, we will continue to maintain a strategy of selling on rallies. Due to the lack of non-farm payroll data, gold prices will continue to be treated as oscillating. The lower support level is seen in the 3975-3960 area. If this support level is effectively broken, it may trigger a new round of declines, potentially opening up further downside potential.

Will gold's rebound be followed by another decline?It's hard to explain in a few words. By Friday, the market was still fluctuating and oscillating. Gold had just reached a very critical juncture. Is there anything strange about the current position? No, not really. We've seen 4000 points multiple times since Monday, but the candlestick patterns and their arrangement have gradually turned 4000 into a significant resistance level. Two trend lines are evidence of this. First, there's the downtrend line at the top, which is right around 4000. I know it broke down, but does breaking down mean it has stabilized? We definitely shouldn't rush to make a decision.
Moreover, the upward trend line at the bottom is clearly over, and the expected resistance level is exactly the same as yesterday's level around 4020. If you look at it this way, it's a perfect double top pattern. I don't need to say what this pattern should do, it's definitely bearish. You can also put the stop loss above 4030, a loss of only about 10 US dollars, which is quite cost-effective. If it can break through 4030, then there's no need to trade anymore, just in case gold goes crazy. It's quite comfortable like it is now.
Finally, there's the issue of targets. I'm actually struggling with this too. Today is the last trading day of the week, and holding positions over the weekend isn't ideal. However, assuming 4018 really did top out and the price actually fell, exiting midway would be a huge loss, and it might be difficult to find a good entry point later. Regardless of how much it could fall, at least after this double top pattern formed, gold breaking below 3960 shouldn't be a major problem. Conservatively speaking, I'd suggest aiming for 3980, depending on whether you're a short-term trader.
Since the price of 3960 has encountered support and rebounded multiple times this week, there's no need to set a target at 3960. In other words, if it really drops to 3960, it might go down, resulting in a profit of about $40. Let's just see if it reaches 3980. As for whether to go long again later, I still suggest avoiding unnecessary trading. Everyone keeps saying they want to see the US government reopen, but it's been two days since Trump suggested ending the lengthy debates, and there's been no new information, not even news of a vote.
After such a long closure, and the second time the non-farm payrolls report was missed, even inflation statistics are being compiled, so why isn't employment data being collected? If I were to speculate maliciously, I'd say it's because employment is simply unsustainable. Just think about how long the closure lasted in October; aside from everything else, how much of the workforce has been lost officially? Not to mention the current situation where businesses have low demand. Previously, layoffs were slow and hiring was gradual, but now layoffs are being accelerated and hiring is being reduced. I really don't know how shocking the non-farm payrolls report will be. This is why I expect the market to fall at the open and then rise. The data is too uncertain, and it doesn't look like good news no matter how you look at it. Let's wait and see. I'm actually hoping that the market will break through this level starting from the opening.

Gold consolidates near 4000 as market awaits breakout1️⃣ Market Overview:
Gold (XAU/USD) climbed to $4008 earlier but was quickly sold off back to $3990, showing a strong tug-of-war between buyers and sellers.
Currently trading around $3998–$4002, the market remains in a tight consolidation phase ahead of potential volatility in the U.S. session.
The USD remains steady, while U.S. bond yields stay elevated — both limiting gold’s short-term upside momentum.
2️⃣ Technical Analysis:
• Resistance: $4008 – $4015 – $4025
• Support: $3990 – $3985 – $3972
• EMA50 (H1): around $3996 → acting as short-term dynamic support.
• RSI (H1): neutral near 50 → market still awaiting a decisive signal.
• Multiple spinning top candles on H1 indicate accumulation and indecision.
3️⃣ Outlook:
Gold continues to move sideways between $3990–$4010, showing price compression before a breakout.
If H1 closes above $4015, the bullish momentum could extend toward $4025–$4040.
However, a drop below $3988 could trigger another correction toward $3975.
4️⃣ Trading Strategy:
🔻 SELL XAU/USD
Entry: $4008 – $4012
🎯 TP: 40 / 80 / 200 pips
🛑 SL: $4016
🔺 BUY XAU/USD
Entry: $3975 – $3977
🎯 TP: 40 / 80 / 200 pips
🛑 SL: $3971

Selling on rallies remains the dominant strategy for gold!Yesterday's closing price was around 3977, with a low of around 3964, successfully reaching the 3980-3960 range I predicted. I consistently emphasized against chasing the price higher yesterday and provided a shorting strategy around 4020-4030. Congratulations to those who followed my analysis for substantial profits. Gold faces significant upward pressure, and unless there's a major positive news catalyst, a breakout is unlikely. Otherwise, we will continue to focus on selling on rallies. Today, Friday, is the non-farm payrolls report; we will maintain our strategy of selling on rallies during the day. If you're currently experiencing difficulties with your trading, and I hope to help you avoid common pitfalls, feel free to contact me for discussion!
From the 4-hour chart, gold is maintaining a generally bearish trend with some volatility. The upside resistance is around 4010-4020, with a key resistance level near 4030. Support is around 3970-3960. The recommended strategy is to sell on rallies, observing more and acting less in the middle range, avoiding chasing the market, and patiently waiting for confirmation at key levels before entering the market. Specific trading strategies will be provided at the bottom; please pay close attention.
Gold Trading Strategy: Sell gold in batches in the 4010-4030 range on rebounds, with a target of 3980-3960.

"Short-selling is correct" - Gold consolidation awaits breakout.Gold prices have indeed been somewhat sluggish recently, fluctuating repeatedly within a range. While this volatility can be agonizing, it reflects the market's rhythm. In terms of trading, avoid blindly chasing highs and lows. If you're bearish, don't chase the market down. Patiently wait for a rebound and resistance before entering a position. The recent market rhythm is very clear: sharp rallies are prone to pullbacks, and sharp drops are prone to rebounds – typical characteristics of a range-bound market. Our trading advice remains clear: focus on the 4010-4030 area. If a rebound fails to break through resistance, continue shorting, building positions in batches and proceeding steadily. We have repeatedly emphasized that gold is currently in a range-bound, slightly bearish adjustment phase, with the overall center of gravity continuing to shift downwards. Short-term rallies do not signify a reversal, and so-called signals are often just bull traps. High-level rebounds remain a good opportunity to establish short positions. Market conditions can change rapidly, but there are always patterns to follow. Don't be misled by appearances; look at the underlying logic and structure. Gold is still in a downward continuation phase. Rebounds present opportunities, while false breakouts pose risks. Gold prices fell as expected. Although we exited early and missed the lowest point, a steady exit is a victory in itself. Trading is never about who is more greedy, but about who knows how to control the pace better.

Gold breaks through $4,000, has the bulls returned?You might be surprised if I said gold could continue to decline? But the truth is, I'm not surprised. I see this round of trend very clearly: the break below the 4000 mark was just a brief "acceleration" rather than a true reversal of direction. After the price broke through, it quickly rose to around 4017. This performance is more like an emotional release than a trend reversal. After all, the 4000 level has been breached or recovered many times before. There have been too many short-term fluctuations, and the real significance has already been digested by the market's inertia. I maintain a bearish outlook because the chart structure has reached the testing area of the channel's low point, a key position I have repeatedly emphasized. There are only two possibilities for the trend: either the market will soar upwards and return to the upward channel, or it will begin a new round of decline. What I want to seize is the volatility opportunity in the latter. Looking at the key levels: the highs this week are 4050, 4040, and 4030. If the rebound stops in the 4020-4030 area, then a short-term top has likely appeared. At this point, entering a short position would be extremely cost-effective. As long as the market cannot regain a foothold above 4030, I remain firmly bearish, with targets to watch for a break below 4000 and further down to the 3980-3960 area. I don't strive for perfect predictions, but every move I make must be logical, structured, and valuable. When opportunities arise, do not hesitate or waver; execution is key. Seek victory through stability and do not blindly follow the noise of the market.

Gold rejected at 3990 – caution as range expands📊 Market Overview
Gold (XAU/USD) touched the $3990 resistance zone before retreating back to $3985–$3986, indicating renewed selling pressure near the supply area. The market remains range-bound, but the range is gradually widening, signaling potential volatility ahead.
🧭 Technical Analysis
• Near Resistance: $3990 – $3995
• Major Resistance: $4005 – $4012
• Near Support: $3978 – $3970
• Major Support: $3958 – $3950
• EMA50 (H1): price is hovering around this level, showing a neutral short-term bias.
• Recent candlesticks show upper wicks → sellers are dominating short-term momentum, though dip-buying interest may appear around $3960–$3955.
💡 Outlook
Gold remains in an expanding consolidation phase. The $3995 – $4005 area is a critical test zone — failure to break above could trigger a correction toward $3960.
Conversely, a confirmed H1 close above $4005 would suggest a bullish breakout and potential continuation higher.
🎯 Trading Strategy
🔻 SELL XAU/USD
Entry: $4006 – $4009
🎯 TP: 40 / 80 / 200 pips
🛑 SL: $4013
🔺 BUY XAU/USD
Entry: $3955 – $3952
🎯 TP: 40 / 80 / 200 pips
🛑 SL: $3948

GOLD MARKET UPDATE (XAU/USD – $3980)1. Market Overview
Gold is hovering around $3983, moving sideways within the $3978–$3988 range. The market remains cautious ahead of U.S. economic data, with price compression suggesting a potential breakout soon.
2. Technical Analysis
• Resistance: $3988 – $3995
• Support: $3978 – $3970
• EMA 50 (H1): around $3985, neutral zone.
• RSI (H1): near 45, showing no strong momentum.
• Pattern: tight range, potential for breakout in the next few candles.
3. Outlook
Gold is in short-term consolidation, waiting for market catalysts. A two-way trading approach is optimal: sell at resistance, buy at support.
4. Trading Strategy
🔻 SELL XAU/USD
Entry: $3988 – $3993
🎯 TP: 40 / 80 / 200 pips
🛑 SL: $3997
________________________________________
🔺 BUY XAU/USD
Entry: $3970 – $3975
🎯 TP: 40 / 80 / 200 pips
🛑 SL: $3965

Gold surges strongly after Fed decision – eyes on 4000+ breakout1. Market Movements
After the Federal Reserve cut interest rates by 0.25% and signaled a potential end to quantitative tightening (QT), gold extended its strong upward momentum.
Institutional and ETF buying continues to drive prices higher, with gold now testing the key psychological level at $4000/oz.
2. Technical Analysis
• Near-term Support: $3960 – $3970
• Deeper Support: $3935 – $3940 (pre-Fed accumulation zone & H4 EMA50)
• Immediate Resistance: $3988 – $4000
• Extended Resistance: $4025 – $4040 (mid-October technical high)
• Momentum: Both EMA20 and EMA50 on H1 and H4 are sloping upward, confirming strong bullish momentum. RSI remains elevated (70–75), signaling overbought but still strong trend conditions.
• Volume: Continues to rise steadily, showing sustained institutional inflows. However, short-term correction risks remain near $4000 due to overextension.
3. Outlook
The overall trend remains bullish, but caution is advised as gold approaches the $4000–$4040 resistance zone — a potential area of strong profit-taking.
If gold fails to break above $4040 decisively, a short-term pullback toward $3970 or $3940 is likely.
4. Suggested Trading Plan
🔺 BUY XAU/USD
Entry: $3925 – $3928
🎯 TP: 40 / 80 / 200 pips
🛑 SL: $3922
🔻 SELL XAU/USD
Entry: $4037 – $4040
🎯 TP: 40 / 80 / 200 pips
🛑 SL: $4043

Gold climbs above $4030, bullish momentum remains strong📊 Market Overview:
Gold extended its gains to around $4030, supported by a weaker USD and stronger safe-haven demand. After consolidating between $4015–$4020, buyers regained control, pushing the price higher toward short-term resistance.
📉 Technical Analysis:
• Key Resistance: $4035 – $4050
• Nearest Support: $4018 – $4022
• EMA: Price remains above the 9-EMA, confirming a short-term bullish trend.
• Candle / Momentum: Momentum is still positive on the H1 chart, showing solid buying pressure with no clear reversal signs.
📌 Outlook:
Gold may continue to rise if it stays above $4018, targeting $4045 – $4052 in the short term. However, if a rejection candle appears near $4035–$4040, a technical pullback toward $4020 could occur.
💡 Trading Plan:
🔺 BUY XAU/USD
Entry: $4024 – $4028
🎯 TP: 40 / 80 / 200 pips
🛑 SL: $4018

Gold holds gains but faces strong resistance at $3975📊 Market Overview:
Gold prices remain steady around $3960–$3965, sustaining upside momentum after breaking above the key $3950 resistance. The market is supported by expectations that the Fed may cut rates sooner, while a weaker USD continues to bolster gold. However, profit-taking pressure around $3970–$3975 is slowing the rally ahead of the U.S. session.
📉 Technical Analysis:
• Key Resistance: $3975 – $3985 – $4000
• Nearest Support: $3955 – $3948 – $3935
• EMA: Price is above EMA 09 & EMA 20 (H1) → short-term trend remains bullish.
• Candlestick & Momentum: H1 candles are holding above the $3950 breakout zone, confirming ongoing buying strength, though RSI nearing overbought may trigger a minor correction.
📌 Outlook:
Gold remains in a short-term uptrend above $3955. A clear break above $3975 could open the door to $3985–$4000, while a drop below $3955 may trigger a pullback toward $3948–$3935 before any rebound.
💡 Trading Strategy Suggestion:
🔺 BUY XAU/USD at: $3935 – $3932
🎯 TP: 40 / 80 / 200 pips
❌ SL: $3929
🔻 SELL XAU/USD at: $3975 – $3978
🎯 TP: 40 / 80 / 200 pips
❌ SL: $3981

Gold rebounds from lows – key levels to watch: 4100 & 40081. Market Overview
Gold (XAU/USD) recovered from an early drop to $4054, now trading around $4069–$4070 as technical buying emerges near support. The market is consolidating after last week’s decline, with short-term momentum turning neutral.
2. Technical Analysis
• Resistance 1: $4100 – short-term top with EMA50 (H4) confluence.
• Resistance 2: $4135 – strong medium-term barrier.
• Support 1: $4045 – key intraday base.
• Support 2: $4008 – major medium-term floor.
• EMA20 (H1): $4078 acting as dynamic resistance.
• RSI (H1): recovering to 50 → neutral zone.
The overall structure remains slightly bearish, but candles show buyers defending the $4050 area effectively.
3.Outlook
Gold is in a technical recovery within a broader downtrend. A confirmed breakout above $4085–$4100 could target $4118–$4135.
Failure to hold above $4045 may reopen a path toward $4022–$4008.
4.Trading Plan
🔻 SELL XAU/USD : $4102–$4105
🎯 TP: 40 / 80 / 200 pips
🛑 SL: $4109
🔺 BUY XAU/USD: $4045–$4048
🎯 TP: 40 / 80 / 200 pips
🛑 SL: $4041
