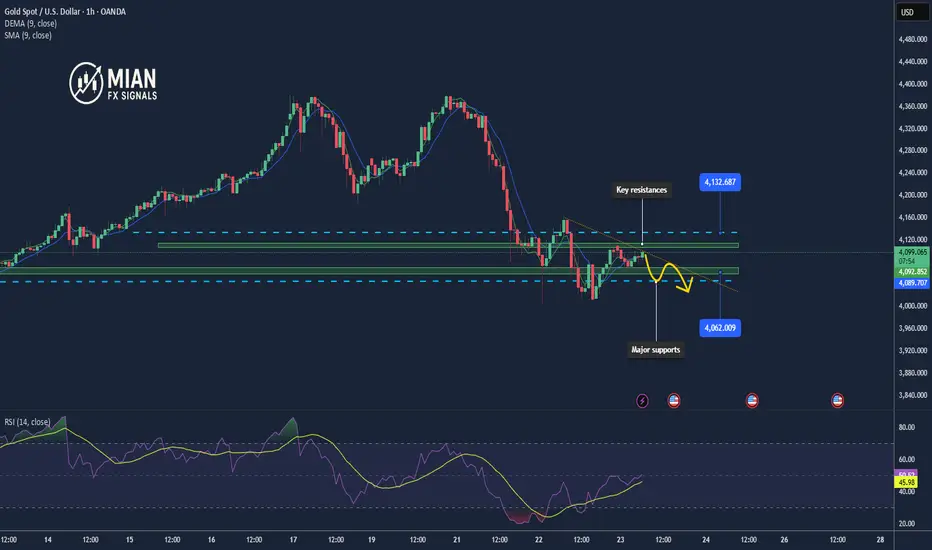
Gold consolidates at 4090 – Downside risk if 4070 breaks1. Market Overview
Gold (XAU/USD) rebounded slightly from the 4081 low after a quick wick rejection, now trading around 4090–4092. The market remains under pressure from the upper supply zone, while buying momentum is still weak. Traders are waiting for U.S. economic data later today to determine the next direction.
________________________________________
2. Technical Analysis
• Main trend: Short-term bearish
• Key resistances: 4108 – 4115 – 4132
• Major supports: 4070 – 4060 – 4045
• EMA50/200 (H1): Still in a bearish crossover, indicating ongoing downside momentum.
• H1 Candles: Narrow range with long lower wicks — showing mild buying but no strength.
• RSI (H1): Hovering around 45 – not oversold yet, leaving room for further decline.
________________________________________
3. Outlook
Gold remains in a consolidation phase after a recent drop, with no clear reversal signal yet. As long as the price stays below 4115, the short-term bearish bias prevails. A break below 4070 could push prices toward 4060 or even 4045. Conversely, a close above 4115 (H1) may trigger a short-term bullish correction.
________________________________________
4. Trading Strategy
🔻 SELL XAU/USD
Entry: 4111 – 4114
🎯 TP: 40 / 80 / 200 pips
🛑 SL: 4117
🔺 BUY XAU/USD
Entry: 4061 – 4064
🎯 TP: 40 / 80 / 200 pips
🛑 SL: 4058
Goldplan
Gold rebounds sharply but remains volatile – watch 4100 & 4180🟡 Market Overview
After plunging near $4,000/oz, gold quickly rebounded to around $4,138/oz. The rally is now facing resistance near 4,150, as selling pressure emerges again. Market volatility remains high following this morning’s sharp drop.
📊 Technical Analysis
• Support: $4,100 – $4,110 and $4,000 – $4,020
• Resistance: $4,170 – $4,180 and $4,200
• EMA20: price fluctuating around EMA, showing indecision
• Candlestick pattern: long lower wick near $4,000 confirms strong buying interest at major support
💡 Outlook
Gold is in a technical rebound phase, but rapid intraday swings are likely. Holding above $4,100 supports a continued recovery; breaking below $4,090 could trigger a return toward $4,050 or even $4,000.
________________________________________
🎯 Suggested Trading Plan
🔺 BUY XAU/USD: 4,100 – 4,097
🎯 TP: 40 / 80 / 200 pips
🛑 SL: 4,093
🔻 SELL XAU/USD: 4,177 – 4,180
🎯 TP: 40 / 80 / 200 pips
🛑 SL: 4,183

XAUUSD: Double top pattern completed, gold confirms reversalContrary to the vast majority of people's beliefs, OANDA:XAUUSD was unable to break through the old peak at $4380/oz to move above the $4400/oz area but formed a double top pattern on the 1 hour timeframes and corrected downwards with a record margin from $4380 to near $4000/oz.
With these factors, we can almost certainly conclude that gold has completed this rally and will begin to correct downwards in the near future.
Looking through the options market, almost all traders have withdrawn all Longcall contracts from the market and a large number of Longput contracts have been pushed in.
This further reinforces the fact that the price has begun to enter a downward correction cycle in the near future.
Some key levels that we need to pay attention to in today's trading session:
Resistance: , , ,
Support:
Margin zone support:
Strong support:
Always be patient and wait for the price to reach the support and resistance zones above and get confirmation. Do not place limit orders or enter orders when the price is increasing or decreasing sharply.
Take advantage of the above support and resistance zones and trade short-term when the price reacts at these support and resistance zones.
Take profit when the price moves from 10 to 20 prices since entering the order at the support and resistance areas.
Wait for reactions such as Engulfing candles, Doji,... at the support and resistance zones.
Always set stop loss when trading and manage risks closely.
Note: Price may spike through support or resistance levels and then reverse. Therefore, it is crucial to patiently wait for the candle to close before entering a trade.
Victor Dan @ ZuperView

OOO GOLD IS THAT A DOUBLE TOP?I feel like I see a double top formed on the daily! The real test will come with the fib pull back in the 4249-4255 price range but only price will show us but I think we are seeing a key area for gold and If I had to choose I would say we may be heading for a minor pullback to let off some steam and also take some par profits!
Let me know yall thoughts tho and what do you think! GD luck tomorrow, I cant wait for the NY session.

Gold faces a technical correction – watching 4185–4190 zone📊 Market Overview:
Gold (XAU/USD) fell sharply from 4260 to 4190 during the Asian–European sessions before stabilizing near 4195. Selling pressure came mainly from rising US bond yields and a stronger USD. However, the 4185–4190 support area may trigger technical buying in the upcoming US session.
📢Technical Analysis:
• Support: 4185 – 4178 – 4162
• Resistance: 4212 – 4230 – 4250
• Price remains below the EMA50 (H1), keeping the short-term bias bearish.
• Narrowing candles on H1 suggest market compression ahead of the US session.
• A close below 4185 could extend losses toward 4170–4160; holding above may trigger a rebound to 4210–4230.
💡 Outlook:
Gold is in a corrective phase with sellers still dominant. The 4185–4190 zone is a key short-term pivot for direction confirmation.
🎯 Trade Idea:
🔻 SELL XAU/USD : 4225–4228
🎯 TP: 40 / 80 / 200 pips
🛑 SL: 4231

Gold drops sharply – profit-taking pressure spreads💹 1. Market Overview
Gold (XAU/USD) continued its sharp correction today, falling from $4,347 → $4,318 after failing to sustain above the $4,382 high.
The decline mainly came from:
Heavy profit-taking near strong resistance zones.
USD rebound and Treasury yields rising again.
Market sentiment turned cautious as traders await Fed’s next move on the rate-cut cycle.
📊 2. Technical Analysis
• Short-term trend: Correction within the medium-term uptrend channel.
• Resistance zones: $4,340 – $4,355 | $4,370 – $4,382 – $4,400
• Support zones: $4,318 – $4,305 | $4,285 – $4,260 – $4,240
• EMA20 – EMA50 (H1): Price testing below EMA20 → needs H1 close above $4,330 to confirm recovery.
• RSI (H1): Down to 42 → correction pressure still dominant.
• Volume: Increased at $4,318 → possible dip-buying activity emerging.
🔮 3. Outlook
Gold is in a healthy technical correction after the strong rally.
The medium-term bullish trend remains valid as long as price holds above $4,285.
If a bullish reversal candle appears near $4,315–$4,320, buyers could re-enter.
A break below $4,300 could trigger a deeper fall to $4,285 – $4,260.
🎯 4. Trading Strategy
🔻 SELL XAU/USD : $4,419 – $4,421
🎯 TP: 40 / 80 / 200 pips
🛑 SL: $4,425
🔺 BUY XAU/USD: $4,303 – $4,300
🎯 TP: 40 / 80 / 200 pips
🛑 SL: $4,296

XAUUSD: Strong recovery, will gold continue to make new highs?OANDA:XAUUSD had a significant correction in the trading session at the end of last week, for most of yesterday's trading session we have not seen too strong bullish momentum.
However, during the New York Session, gold rose sharply under the push of large cash flows and with the emergence of some unsettling news, typically the fact that China could pay 155% tariffs if there is no agreement before November 1 (President Trump).
Looking at the options market in today's trading session, most traders are still apprehensive as the price is trading above the peak of 4350 – 4370 (calculated through the price of CFDs). However, most of the market is involved by longcall contracts, so I assess that in today's trading session, the price will continue to above $4400/ounce.
Some key levels that we need to pay attention to in today's trading session:
Resistance: ,
Support:
Support:
Strong support:
Margin Zone support:
Fair value gap (FVG):
Margin Zone + Strong suport + FVG => This will be a strong support zone in today's trading session
Always be patient and wait for the price to reach the support and resistance zones above and get confirmation. Do not place limit orders or enter orders when the price is increasing or decreasing sharply.
Take advantage of the above support and resistance zones and trade short-term when the price reacts at these support and resistance zones => Take profit when the price moves from 10 to 20 prices since entering the order at the support and resistance areas.
Wait for reactions such as Engulfing candles, Doji,... at the support and resistance zones.
Always set stop loss when trading and manage risks closely.
Note: Price may spike through support or resistance levels and then reverse. Therefore, it is crucial to patiently wait for the candle to close before entering a trade.
Victor Dan @ ZuperView

XAUUSD: Has gold made a peak?OANDA:XAUUSD had a strong correction day at the end of last week with strong selling pressure, the rhythm of recovery does not make too much sense when the price is still sideways in the range of 4220 – 4270.
In previous corrections, we have seen that the price has always recovered strongly immediately, however in the current situation, the price has not made any attempt to rise again => Reinforce the fact that the price has made a peak and started a short-term correction.
In the Options market, there has been a large number of Longput contracts and Longcall contracts are gradually being withdrawn from the market , so I think the price will not be able to rise in today's trading session.
Some key levels are important in today's trading session:
Resistance: ,
Strong support:
Daily balance:
Daily balance is the temporary equilibrium level of the market in today's trading session, if the price breaks this balance, the price will look for lower value areas.
Always be patient and wait for the price to reach the support and resistance zones above and get confirmation. Do not place limit orders or enter orders when the price is increasing or decreasing sharply.
Take advantage of the above support and resistance zones and trade short-term when the price reacts at these support and resistance zones and take profit when price moves 10 to 20 prices from support and resistance zones.
Wait for reactions such as Engulfing candles, Doji,... at the support and resistance zones.
Always set stop losses when trading and manage risks closely.
Victor Dan @ ZuperView

XAUUSD: Primary trend and key levels for today's trading sessionOANDA:XAUUSD continued its strong rally, with a trading range of over $120 in yesterday's session, demonstrating powerful upward momentum.
During this uptrend, there have been consistent, unexpected corrections with a magnitude of approximately 30 - 50 USD, followed by immediate recoveries.
As the peak price for this rally remains undetermined, the current optimal strategy is short-term scalping, aiming for a take profit form $10 - $20 prices as the price approaches significant support and resistance zones.
An analysis of the current options market order book reveals that a large volume of Long Call contracts has been filled, with no significant Long Put positions entering the market yet.
=> This suggests a high probability that Gold will continue to push towards new highs in today's trading session.
=> The initial target is the $4400/Ounce level, which corresponds to the $4385 price on the CFDs market.
Key levels for today's trading session:
Resistance:
Resistance: ,
Strong resistance:
Support:
Support: , ,
Strong support:
Always be patient and wait for the price to reach the support and resistance zones above and get confirmation. Do not place limit orders or enter orders when the price is increasing or decreasing sharply.
Take advantage of the above support and resistance zones and trade short-term when the price reacts at these support and resistance zones.
Wait for reactions such as Engulfing candles, Doji,... at the support and resistance zones.
Always set stop losses when trading and manage risks closely.
Note: Price may spike through support or resistance levels and then reverse. Therefore, it is crucial to patiently wait for the candle to close before entering a trade.
Victor Dan @ ZuperView

XAUUSD: Intraday trading plan and key levelsOANDA:XAUUSD continues to recover strongly after a 50+ point pullback from 4218 → 4165, bullish momentum remains sustained. However, for today’s session we should be cautious, as a sharp correction may occur now that price has achieved the 4250 target on Futures, which corresponds to 4240 on CFDs.
On the Options market, long put contracts are being executed in notable size—something that was rare in prior sessions.
⇒ Therefore, I assess that we should be cautious today because prices may be preparing for a sharp decline either today or in the coming sessions.
That said, we must also account for the possibility of one final push higher before the downside begins.
Key levels to monitor for price action and potential scalp trade setups:
Resistance:
Resistance:
Margin zone resistance:
Strong resistance:
Support:
Support: ,
Margin zone support:
Strong support:
Always be patient and wait for the price to reach the support and resistance zones above and get confirmation. Do not place limit orders or enter orders when the price is increasing or decreasing sharply.
Take advantage of the above support and resistance zones and trade short-term when the price reacts at these support and resistance zones.
Wait for reactions such as Engulfing candles, Doji,... at the support and resistance zones.
Always set stop losses when trading and manage risks closely.
Victor Dan @ ZuperView

Gold Price Outlook – Trade Setup (XAU/USD)🔹 Technical Structure
TVC:GOLD Gold has extended its rally above the $4,200 handle, testing the $4,240–$4,246 resistance zone highlighted on the chart. Momentum remains bullish in the short term, but price is facing rejection near the upper boundary.
Support Zone: $4,204 – $4,210 (marked in red/purple)
Resistance Zone: $4,240 – $4,246 (marked in yellow)
Current bias shows a potential pullback from resistance before another attempt higher.
The drawn projection suggests a corrective dip back into the support zone, followed by a renewed bullish wave toward resistance.
🔹 Trade Setup
Entry: $4,204 – $4,210 (on pullback into support zone)
Stop Loss: $4,202 (below key support structure)
Take Profit 1: $4,240 (resistance re-test)
Take Profit 2: $4,246+ (extension above resistance)
Risk–Reward (R:R): ≈ 1 : 3.92
🔹 Macro Background
Gold continues to trade at elevated levels, supported by strong safe-haven demand amid U.S.–China trade tensions and expectations of further Fed rate cuts. Market participants anticipate a 25bps cut at the October FOMC, with an additional cut in December and more in 2026. Fed Chair Powell’s comments on slower job growth reinforced dovish bets, lowering yields and boosting gold.
Additionally, the newly imposed U.S.–China port fees have increased geopolitical risk, pushing investors to hedge with gold.
🔹 Key Technical Levels
Resistance: $4,240 / $4,246
Support: $4,210 / $4,204 / $4,200
🔹 Trade Summary
Gold remains in a bullish trend but faces heavy resistance near $4,246. A pullback to the $4,210 support zone offers a potential buy-the-dip opportunity, targeting resistance re-tests. Macro fundamentals continue to favor gold’s upside, but near-term corrections are possible before another breakout attempt.
⚠️ Disclaimer
This analysis is for reference only and does not constitute trading advice. Trading involves significant risk, and proper risk management is essential.

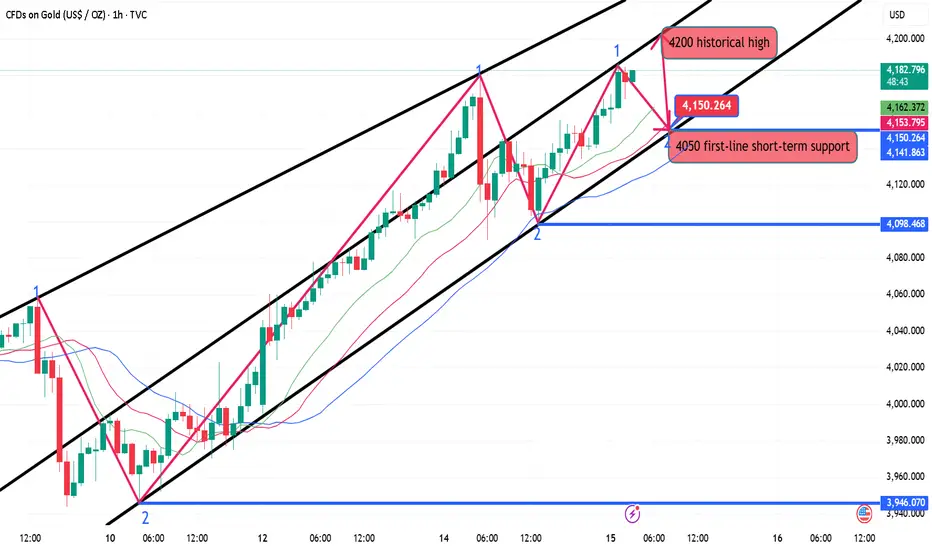
10.15 Gold breaks high again, looking for retracement to continuAfter a significant bearish candlestick pattern, the gold price's hourly chart immediately took off with a bullish candlestick pattern in the Asian session, signaling a rebound from a bottoming out. The large bullish candlestick pattern at the bottom solidified the base, and the moving average took off again, also trending almost vertically upward. The candlestick pattern remained above the moving average throughout, demonstrating the unstoppable bullish momentum. The upper limit remains at 4200.
Intraday short-term trading strategy:
BUY: 4150 Stop-loss: 4142
Top 1: 4185
Top 2: 4200
10.14Gold bulls continue to exert their strength!!!Gold is currently stabilizing after a broad range-bound consolidation on the 4-hour chart. It experienced an unexpected intraday plunge, but the momentum has been minimal. A rapid intraday rise followed by a sustained decline could present an opportunity for a short position. The price has rebounded after retracing to previous support levels, and the K-line charts are still trading above the short-term moving average, suggesting a relatively strong trend in the short term. There are currently no significant technical patterns on the hourly chart. On the smaller timeframes, pressure is building on the short-term moving average, maintaining a weak trend. There may be some room for correction in the short term. Focus on the support level around 4005 in the short term.
Gold hits new high at $4180, correction risk rising1. Market Overview
During the mid-day session on October 14, gold prices (XAU/USD) continued their upward momentum, reaching $4180/oz, setting a new all-time high.
The main drivers remain expectations of a Federal Reserve policy easing and strong safe-haven demand amid rising geopolitical tensions.
However, after breaking above $4175 and testing $4180, the market is showing signs of mild profit-taking, indicating that bullish momentum is temporarily slowing.
2. Technical Analysis
• Strong Resistance: $4180 – $4192
• Near Support: $4165 – $4158
• Deep Support: $4142 – $4130
• RSI (H1): 81 – Clearly overbought
• EMA20 (H1): $4158 – Acting as dynamic support
• Candlestick Pattern: Consecutive long upper wicks near $4175–$4180 → signal short-term correction pressure.
3. Outlook
Gold continues to hold a very strong bullish trend, but the risk of a technical correction is rising as the market becomes heavily overbought across multiple timeframes.
The $4180–$4192 zone now serves as a key short-term resistance area that may trigger selling pressure.
If the price fails to close an H1 candle above $4180, a pullback toward $4165–$4155 is likely.
Conversely, a break above $4192 with strong volume could push gold toward $4205–$4215 in the short term.
4. Trading Strategy
🔺 BUY XAU/USD: $4158 – $4155
🎯 TP: 40 / 80 / 200 pips
🛑 SL: $4152
🔻 SELL XAU/USD: $4190 – $4193
🎯 TP: 40 / 80 / 200 pips
🛑 SL: $4196

Gold rebounds – Market eyes the $4090–$4100 target📊 Market Overview:
After hitting a new record high at $4,078/oz, gold briefly pulled back to $4,067 before rebounding to $4,075, showing strong buying interest 💰.
Risk aversion remains elevated amid ongoing US–China trade tensions and geopolitical uncertainty.
🧭 Technical Analysis:
• Trend: Strong bullish on H1–H4
• EMA: Price remains above EMA20–50 cluster → short-term uptrend intact
• Resistance: $4,078 – $4,095
• Support: $4,060 – $4,048
• Candle pattern: Bullish rejection candle near $4,067 confirms active buyers
• Momentum: RSI near 68 – strong, not yet overbought
💡 Outlook:
Gold is retesting the $4,078 peak; if an H1 candle closes firmly above it, the next target lies at $4,090–$4,100 🎯.
Otherwise, a short-term pullback toward $4,060–$4,050 could occur before another rally attempt.
________________________________________
🔺 BUY XAU/USD
Entry: $4.069 – $4.072
🎯 TP: 40 / 80 / 200 pips
🛑 SL: $4.066

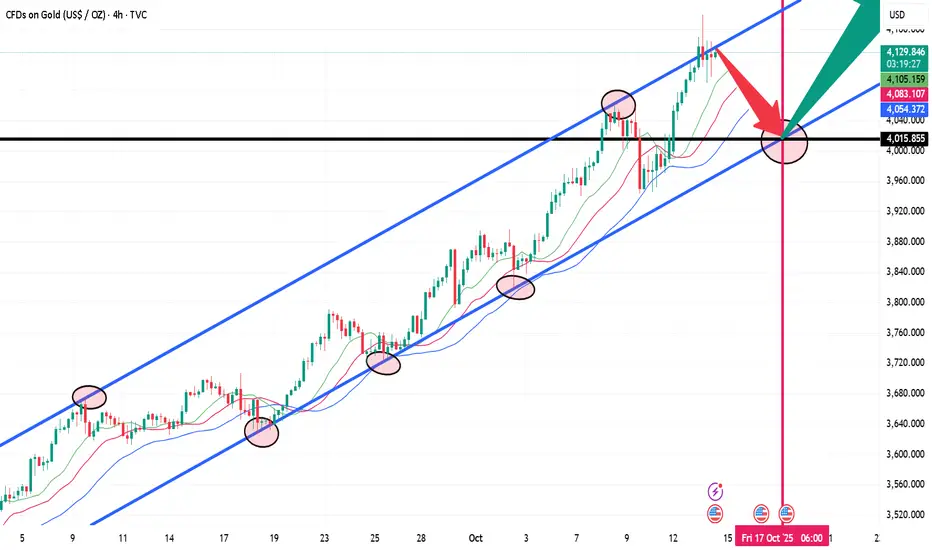
Monday's US gold market focus on short-term adjustmentsOn Friday, we emphasized the importance of the daily close. Gold's late-day rally on Friday disrupted the previous downward trend following the engulfing high. Instead, it continues to fluctuate along its short-term moving average, maintaining a relatively strong trend on the daily chart. On the 4-hour chart, gold has broken through the previous resistance band, and the K-line continues to maintain a relatively stable upward trend along the short-term moving average. In the short term, watch for a second upward pull after a pullback. On the hourly chart, after a series of small upward movements, the price is currently fluctuating in a narrow range at a high level. The current divergence in the short-term chart suggests that there may be room for adjustment in the short term. Keep an eye on this short-term correction.

XAUUSD: Correction failure, aiming for higher priceAfter a sizable dip following the retest of 4057, gold recovered quickly and broke higher after President Donald Trump said he is considering raising tariffs on Chinese imports up to 100%, a headline that jolted broader risk assets and added to geopolitical uncertainty.
Given gold’s safe-haven character and the recent instability across financial markets, a deep correction is unlikely for now. Instead, looking for potential buy entry during slight corrections is safer in the current situation.
Latest update: In today’s session, President Trump told reporters on Sunday (Oct 12) that the war in Gaza “has ended.”
📊 Trading Plan
⇒ With the news situation still unclear for us to know whether gold will decrease or continue to increase strongly, so in today's trading session we should only scalp trade when the price moves to support and resistance zones.
Key Levels
Margin Zone Resistance:
Resistance: ,
=> These resistance zones are derived from concentrated CME Long-call positioning and may elicit reactions if tested.
Margin Zone Support:
Support: ,
Strong Support:
Victor Dan @ ZuperView

Gold hits new ATH at $4,078 – Bullish momentum remains strong📊 Market Overview:
Gold extended its rally on Monday, October 13, reaching a new all-time high at $4,078/oz before retracing slightly to $4,060. Safe-haven demand driven by escalating US–China trade tensions and global uncertainty continues to support the precious metal. Gold ETFs recorded their strongest inflows in the past three weeks.
🧭 Technical Analysis:
• Main trend: Strong bullish (H1–H4)
• EMA: Price firmly above EMA20–50 cluster → sustained uptrend
• Resistance: $4,080 – $4,095
• Support: $4,050 – $4,032
• Candle pattern: Strong bullish rejection candle near $4,050 (buyers still dominant)
• Momentum: RSI holding above 65, no clear overbought signal yet
💡 Outlook:
Momentum remains solid; gold may retest $4,080–$4,100 soon, especially if the USD weakens during the US session. However, traders should stay cautious around this resistance area due to potential technical pullbacks.
🔺 BUY XAU/USD
Entry: $4,057 – $4,060
🎯 TP: 40 / 80 / 200 pips
🛑 SL: $4,054

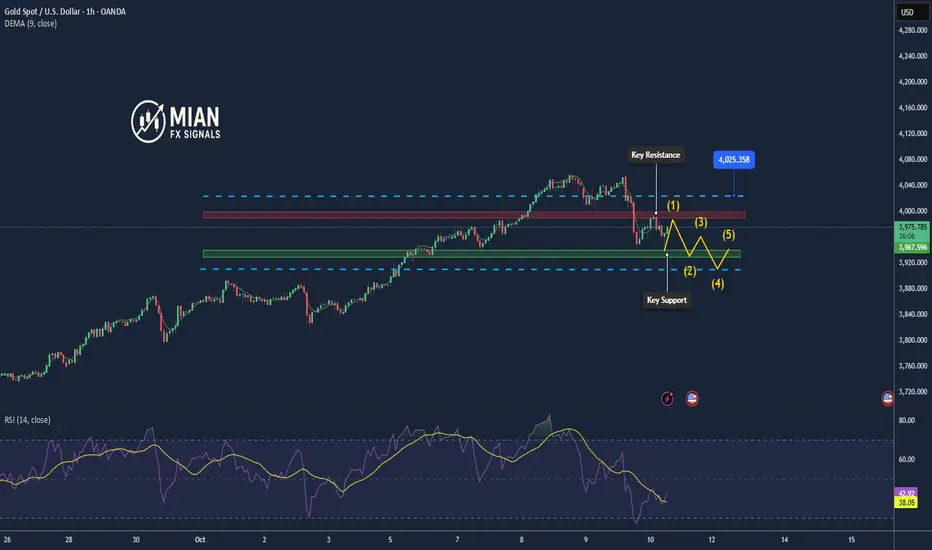
Gold outlookKeep eyes on both level 4060.5 and 4024.5 . if 15min candle close upper and below level then we can see a good target.
Most people's are making short position but gold moves are so unpredictable in recent time's. So trade accordingly.

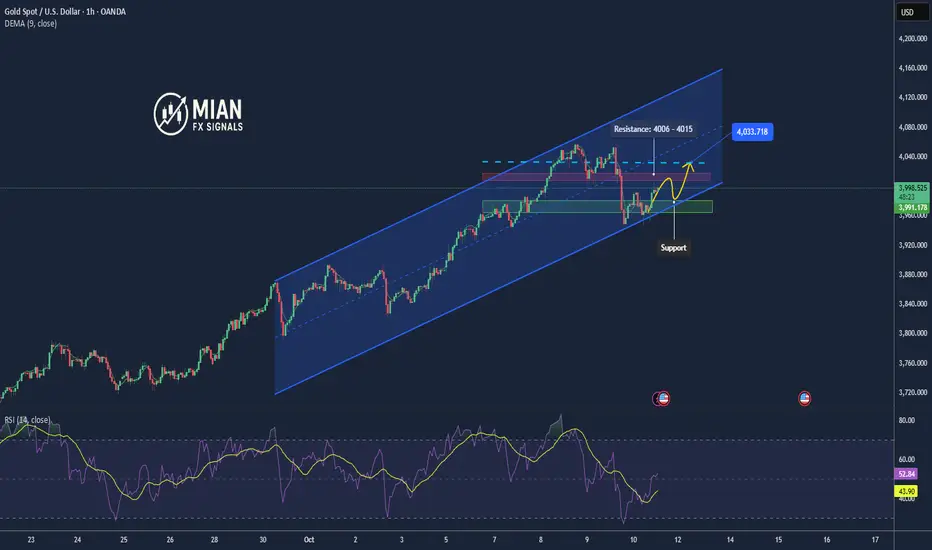
Gold in Tight Range — Waiting for the Next Break📊 Market Overview
Gold is consolidating within a narrow range around $3990 – $4000, reflecting a wait-and-see sentiment in the market.
After hitting resistance near $4006 and pulling back to $3991, the price is now testing the $4000 level again — a key technical pivot zone.
📈 Technical Analysis
Short-term trend: Sideways, searching for direction
Resistance: 4006 – 4015
Support: 3980 – 3965
EMA20/50 (H1): Price hovering near both averages → no clear bias
RSI (H1): Neutral, no strong buy/sell signals
Candlestick pattern: Multiple upper wicks near resistance → selling pressure visible
💡 Market Outlook
Gold is tightening around resistance. If it holds above 3995–4000, a further rise could occur.
However, if it fails and closes H1 below 3990, a correction toward 3965–3950 becomes likely.
🎯 Trading Signals
🔺 BUY XAU/USD
Entry: 3985 – 3987
TP: 4015 / 4030
SL: 3982
🔻 SELL XAU/USD
Entry: 4012 – 4015
TP: 3980 / 3965
SL: 4018
Gold Under Correction, Set for Next Move📊 Market Overview
After reaching its historic high of $4059/oz, gold entered a deep correction phase.
Price dropped sharply to $3944, then rebounded technically to around $3990, but buying momentum quickly faded.
Currently, gold is hovering near $3950, reflecting a cautious sentiment around a critical support zone.
📈 Technical Analysis
• Short-term trend: 🔻 Bearish correction
• Key Resistance: 3995 – 4010 | next 4030
• Major Support: 3930 – 3915 | deeper at 3890
• EMA20/50 (H1): Price remains below both → bearish bias intact
• RSI (H1): Flat near neutral zone → no clear reversal yet
• Candlestick pattern: Lower highs on H1/H4 → downward momentum sustained
💡 Market Outlook
Sellers continue to dominate in the short term.
If gold fails to break above 4010, it may extend the decline toward 3915–3890 in the coming sessions.
However, that support area could attract strong buying interest, potentially triggering a rebound.
🎯 Trading Strategy
🔻 SELL XAU/USD: 4009 – 4012
🎯 TP: 40/80/200 pips
🛑 SL: 4015
🔺 BUY XAU/USD: 3898 – 3895
🎯 TP: 40/80/200 pips
🛑 SL: 3885
Gold rebound is still a good opportunity to short!Judging from the current trend, gold was affected by the easing of geopolitical situation, and the risk aversion sentiment temporarily receded. After falling below the 4000 mark, it quickly extended to around 3944. The daily line closed with a medium-sized negative line, almost completely engulfing the previous day's gains. The short-term indicators formed a death cross at a high level, and the momentum weakened significantly. The focus of the day is on the gains and losses of the 4000 mark, which is also the key position for the recent top and bottom conversion. In the 4-hour cycle, the price rose and fell again and closed lower. The big negative line broke through the middle track support. The previous strong unilateral bullish pattern was broken and the market entered a pullback correction stage. Therefore, it is expected that there will be room for repeated adjustments today. The upper pressure focuses on the 3980-3995 area, and the lower short-term support focuses on the 3945-3940 area. If it stabilizes and does not break, you can consider trying to go long on gold with a light position. If it breaks further, pay attention to the bullish defense zone in the 3930-3920 area, and then consider going long on gold. In terms of overall operations, maintain the idea of main short and auxiliary long, wait for the key point confirmation signal, enter the market steadily, strictly control the risk, and execution is still the key to profitability.

Accurate sniping, gold is shorted all the way.Who else has continuously arranged short orders from above 4050 and gone down all the way. Before the market closed yesterday, we arranged in advance at 3990 and accurately set a limit short order. During the opening rebound, gold only touched 3994. After perfectly activating the limit short order, it quickly fell and hit the target near 3970 in one fell swoop, with a steady profit of 200pips on a single transaction. This wave of operations is not only a manifestation of technology, but also a perfect combination of rhythm and plan execution. It once again verifies our core concept of planned trading and strict risk control, precise analysis, advance layout, and steady cashing. Looking back at the entire market, since above 4050, we have clearly stated that there is a risk of periodic correction in gold, and have repeatedly suggested the idea of shorting on the rebound. Facts have proved that planning in advance and decisive execution are better than chasing ups and downs afterwards. The rhythm of this round of decline is clear, and the short-selling-dominated pattern is obvious. We decisively enter the market in the key interval. Every high-level short order is fast, accurate, and ruthless, and we win in a steady manner.
From a technical perspective, gold completed a structural breakdown at the 4000 mark. Short-term support is focused on the 3945-3940 area. If it continues to break down, it will open up downward space to the 3920 line. The upper pressure is focused on the 4000-4015 area. Rebound pressure is still the focus of shorting at rallies. The overall rhythm is still bearish, and short-term operations are mainly based on rebound shorting.
The market never waits for anyone. Profits belong to traders who have plans and execution capabilities. Congratulations to all my friends who are paying attention. Once again, I have steadily realized profits. Strength is not something that can be expressed with words, but is the result of precise implementation of each order. Next, I will continue to track the gold fluctuation structure and lead everyone to steadily grasp the next key market opportunity.
