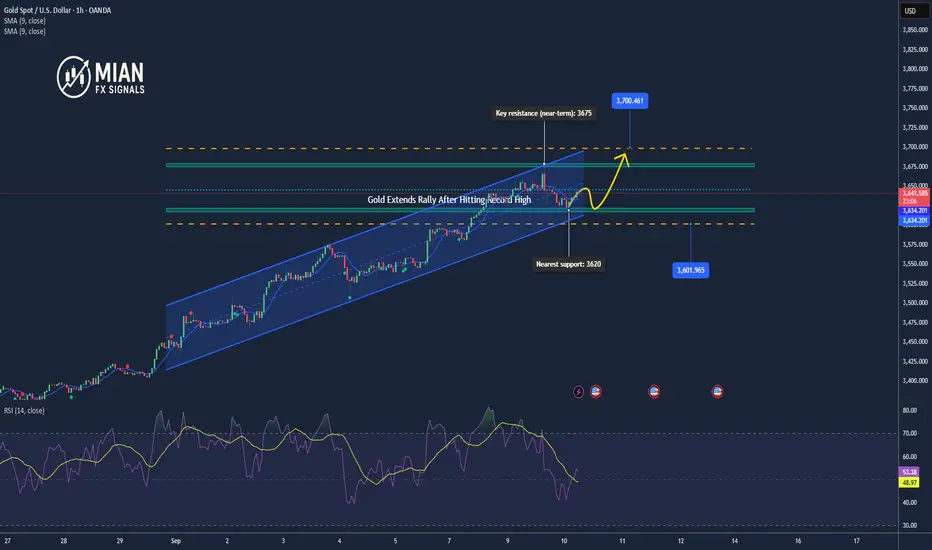
Gold continues to fluctuate before the US interest rate decisionGold, after last Friday's continuation of the previous day's bottoming out and rebound, continued to fall into a range-bound oscillation mode, and after opening today, it continued to retreat to around 3626 before rising. Although there is no breakthrough between the bulls and bears at present, it is still in a tug-of-war, and the support below will also be maintained near the low point of 3626. This position is also the first watershed related to whether gold can continue to fall in the later period. The key pressure above is maintained near the previous secondary high point of 3655. This position is also the key suppression point for the recent retracement after multiple touches. It is also the shoulder position of the head and shoulders top, which also plays a role. It plays a connecting role, and once this position continues to suppress, gold may be under pressure again in the later period. If it does not break through again this week, gold may retreat again next week to test the support level of 3610. Although the daily line is still in a high sideways trend, the upward momentum has also declined significantly. If it bottoms out and rebounds, it needs a secondary definition of the European session, which is also an advance forecast of the US session. If gold rebounds to 3645-3655 during the day, short it and target around 3630-20. The strength of the European session may also determine the direction of the US session.
Goldplan

Gold Holds Above $3,640, Market Awaits Fresh Catalysts📊 Market Movement:
Gold is trading around $3,644/oz, consolidating in a narrow range after recent volatility. Investors remain cautious ahead of key Fed signals and U.S. economic data this week. A pause in the USD and U.S. bond yields is helping gold maintain crucial support.
📈 Technical Analysis:
• Near support: $3,638 – $3,632 (H1 EMA20 + Asian session low).
• Strong support: $3,620 (multiple tested lows).
• Near resistance: $3,650 – $3,655 (Asian session high).
• Strong resistance: $3,668 – $3,672 (H4 EMA50 + strong supply zone).
• RSI on H1 remains above 50, showing mild bullish momentum.
🤔 Outlook:
Gold is trading sideways within $3,638 – $3,655. A breakout above $3,655 may open the way to $3,670. Conversely, a breakdown below $3,632 could trigger a decline toward $3,620. The short-term trend remains in consolidation, awaiting a breakout signal.
🎯 Trading Strategy:
SELL XAU/USD: $3,655 – $3,658
🎯 TP: 40 / 80 / 200 pips
❌ SL: $3661
BUY XAU/USD: $3,638 – $3,635
🎯 TP: 40 / 80 / 200 pips
❌ SL: $3632

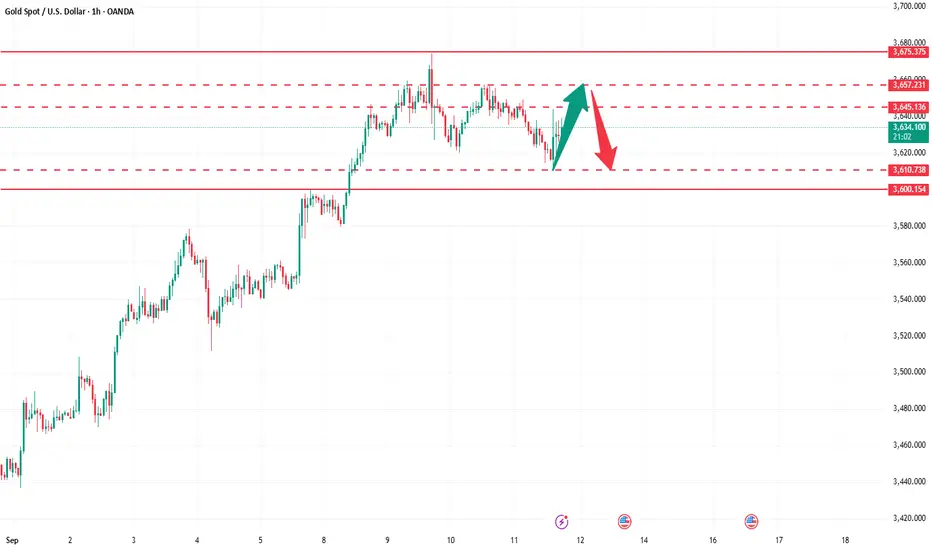
Big events in gold this week!Gold closed with another positive line on the weekly chart. Although it has a long upper shadow line, the overall upward pattern is still solid, the trend has not been destroyed, and it still maintains a strong pattern. The daily level shows a high-level yin-yang cycle consolidation. It has failed to break through the 3660 high in the short term. Therefore, it will temporarily respond with a shock thinking, waiting for another bullish opportunity after the breakthrough. What needs to be paid attention to is that the Federal Reserve’s interest rate decision is about to come this week. The market may usher in a new direction choice, and volatility may intensify. At that time, the market rhythm will be more critical. Pay attention to the 3620-3660 area in the small range of the day. If it can break through, look at the extension space of the large range of 3675-3610. Remind brothers, this week’s trading should pay more attention to rhythm and risk control, avoid blindly chasing ups and downs, wait patiently for the key positions to be confirmed before entering the market accurately, execute high-winning trading plans, and lock profits firmly in the account.For the specific layout and operation rhythm, please refer to the bottom notification I released at the first time to ensure consistent execution and unified thinking, and avoid blindly following the trend and causing unnecessary risks.

With the interest rate cut coming, will gold fall or soar?The market is ever-changing. It's important to follow the trend; the trend is king. Plan your trades, trade your plans. How far one can go depends on who they walk with. How much a person can achieve in the market depends on who guides him. Let's witness what kind of turmoil gold will face next week with the Federal Reserve interest rate.
Gold has grasped the overall rhythm very well this week, the trading plan was executed smoothly, and the profit performance was satisfactory. After a slight pullback on Friday, gold rose again, and was suppressed near 3655-3660 above, and the oscillation stopped. This position also plays a role of connecting the above and the following. If this position continues to fail to break through, gold may pull back again next week to test the support position below. Although it is still in a high sideways trend at the close, the upward momentum has also declined significantly. I think whether the bulls can regroup next week is particularly important, which directly affects the later trend. Next week's interest rate decision has become the focus. Both market news and technical aspects are bullish for gold. Let us wait and see next week. If you feel your recent trading results are unsatisfactory and would like to avoid detours through clearer trading strategies and risk control, please feel free to discuss this with me.
Gold is currently in a high-level volatile pattern. After rising sharply and falling on Tuesday, it fell into a yin-yang alternating sweeping market. Before the Fed's interest rate decision, it is expected that the deadlock will be difficult to break. The market is waiting for guidance on policy direction. The key support is at the top and bottom conversion point and starting point of the 3610-3600 area. The bullish trend is maintained above it. If it breaks down, it may peak in stages. The trend suppression below Tuesday's highest point of 3674 is obvious. Next week, focus on the short-term support of the 3635-3630 area. If the Asian session tends to test the decline, the focus of the support below is near Thursday's low of 3610. If it breaks down, look at the 3600 and 3580 areas. If it breaks through the 3655 resistance above, it will turn strong in the short term and look at 3660 and the previous high. After breaking the high, focus on the 3680-3690 area. Maintain the overall range operation idea and follow the break.

ANFIBO | XAUUSD Plan [15.10.2025 - 19.10.2025]Here is my XAUUSD plan for next week:
💚 SUPPORT ZONES : 3625 - 3595 - 3580 - 3575
❤️ RESISTANCE ZONES : 3665 - 3670 - 3700
✅ BUY SCALP : around 3595, SL 3580, TP 3625 - 3645 - 3670
❌ SELL SCALP :
(1) 3673 - 3675, SL 3678, TP 3645 - 3600
(2) 3700 - 3705, SL 3710, TP 3675 - 3610
✅ SWING BUY : 3550 - 3560, SL 3540, TP 3625 - 3675 - 3700 - OPEN
❌ SWING SELL : 3790 - 3801, SL 2820, TP 3700 - 3570 - 3450 - OPEN
Enjoy it guys! 😊

Gold Holds Sideways Above $3,640, Awaiting Fresh Momentum📊 Market Developments:
Gold prices are currently fluctuating around $3,648 – $3,650/oz during the Asian session.
Markets remain cautious ahead of the upcoming Fed meeting, with strong expectations for a rate cut.
A weaker USD and slightly lower bond yields support gold, but profit-taking pressure still prevents a clear breakout.
📉 Technical Analysis:
• Key Resistance: $3,657 – $3,670
• Nearest Support: $3,638 – $3,626
• EMA: Price remains above EMA50, maintaining a short-term bullish structure.
• Momentum: RSI around neutral zone (50–55), reflecting sideways consolidation awaiting signals.
📌 Outlook:
Gold is likely to continue trading sideways within the $3,638 – $3,657 range until fresh U.S. economic data or Fed statements emerge.
• A breakout above $3,670 could open the way to $3,700.
• A breakdown below $3,626 may trigger selling pressure toward $3,600.
💡 Trading Strategy:
• 🔻 SELL XAU/USD: $3,657 – $3,660
🎯 TP: 40 / 80 / 200 pips
❌ SL: $3663
• 🔺 BUY XAU/USD: $3,626 – $3,623
🎯 TP: 40 / 80 / 200 pips
❌ SL: $3620

Next week's Fed decision,Has the gold bull market peaked?Let's take a look at the trend of gold this week at the weekend. The strong bull market of gold has slowed down this week. After continuing to rise to 3600 on Monday, it rose and fell to a peak of 3675 on Tuesday. From Wednesday to Friday, it fluctuated at a high level. So, does gold still have the motivation to continue to rise in the current situation? Or is 3675 the ceiling? This recent surge in gold prices began at 3311, reaching a high of $364 at 3675. Based on previous upward trends, a bull market typically peaks just over $400. Therefore, with limited room above 3700, blind buying is discouraged. Be wary of a potential reversal of price action after reaching the peak, with the upper limit at 3750. All of this depends on the Federal Reserve's interest rate decision next week. The market will become increasingly cautious as we approach this date. Therefore, gold is currently adjusting at a high level, just shy of a final acceleration towards the top. The uncertainty remains as to whether this acceleration will occur before or after the Fed's decision. If the rate cut is just 25 basis points, gold will have no further momentum to rally. Buying on expectations and selling on facts will lead to a peak and decline upon the announcement. However, if the rate cut is aggressively implemented by 50 basis points, gold will likely experience further upward momentum, most likely leading to a decline after a sharp rise. Therefore, gold is currently in a tailspin. At the end of the bull run, it's best to be bullish rather than chasing the market. It's prudent to wait for a pullback at key support levels before resuming a bullish trend. Two key support levels to watch are 3580 and 3511-3512. Having already seen four consecutive weekly gains, there's a high probability of a negative correction next week. Even if gold does rally next week, it will be the final stretch. The world's largest gold ETF has been steadily reducing its holdings in recent days, with bulls gradually taking profits. We shouldn't be tempted to buy at high levels, especially for medium- and long-term investors. It's important to emphasize that the overall trend and direction of gold remains upward, directly linked to the weakening US dollar. However, market trends aren't linear. After each bullish cycle, there's a deep correction, and this cycle repeats. This is how trends form. See if this pattern persists. Trading, then, is a process of finding the right position, following the trend and the swings. A cost-effective position gives you the confidence to hold onto your position without panic. For gold on Monday, expect continued volatility. Upper pressure lies between 3655 and 3660. A breakout would undoubtedly trigger a test of the 3675 high, leading to a potential surge and then a decline. Whether it can reach 3700 depends on the strength of the market, but I don't think the probability is high, at least for Monday. Lower support lies between 3635 and 3630, the 618 golden ratio. A break below would signal a short-term bearish bias, potentially leading to further declines to the 3610-3600 support levels.

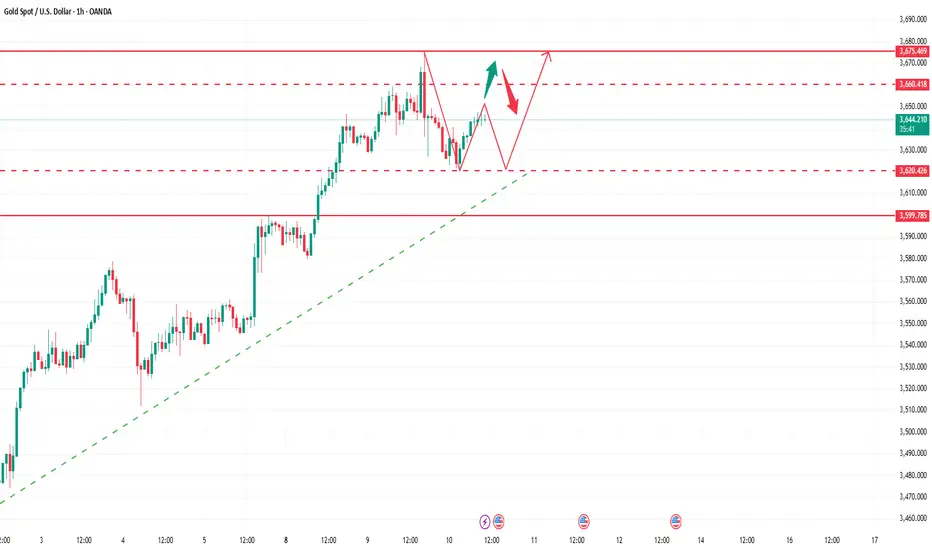
How to seize the certain opportunity of gold?Gold prices are currently consolidating within a yellow parallel channel on the hourly chart, forming a rising flag pattern. We anticipate an eventual breakout and the start of a unilateral rally. The key short-term move lies in the middle band. If the price holds support at the middle band and 3630, a volatile upward trend is likely. A break above the upper band at 3665 could accelerate the upward trend. If the price loses control of the middle band and falls below 3630, the market will continue to fluctuate within the channel, potentially testing the lower band and support near the 10-day moving average early next week, offering a bullish opportunity at low levels.
The 3635-3630 support level should be closely monitored. If a bottoming-out rebound signal emerges, consider buying on dips. If the price effectively breaks below 3630, wait patiently for a pullback to the lower band next Monday before entering a long position. The primary resistance area above is 3665. Only a break above this level would confirm the formation of a rising flag pattern and trigger a unilateral rally. Caution is advised throughout trading, awaiting clarity on the direction of key levels.

A pullback is an opportunity, go long decisively!Yesterday, the technical analysis of gold first declined and then rose. It was suppressed below the 3650 mark during the Asian and European sessions and showed a continuous decline. It further accelerated its decline before the European and US sessions, breaking through the 3630 mark, and continued to decline to around 3613 to stabilize and rebound. It rebounded strongly during the US session and finally closed above the 3630 mark with a small negative fluctuation. The overall price still held the 3610 mark, forming a support and stabilization pattern. After the opening of today, gold once again rose and broke through the 3640 mark. In the short term, it has experienced continuous retracements to test the 3610 mark support, which is still valid. The long position at the daily level is continuing well, and it is expected to further impact the previous high of 3675 resistance area. Today, the short-term support below is around 3630-3620, and the important support is 3610. If it falls back to this position during the day, the main bullish trend will remain unchanged. The short-term bullish strong dividing line is 3600. If the daily level stabilizes above this position, the rhythm of falling back to low and long and following the trend will continue. The specific execution plan of the counter-trend short order will be updated as soon as possible according to the real-time trend, and I will remind everyone to respond flexibly to ensure that every step of the operation is carried out under controllable risks. Remember to pay attention in time.
Gold operation strategy: Go long when gold falls back to around 3630-3620, with the target at 3650-3660. Continue to hold if it breaks through.

Gold Set to Extend Gains as Fed Rate Cuts Loom📊 Market Developments:
Gold is supported by expectations that the Federal Reserve will cut interest rates, lowering the opportunity cost of holding bullion.
Recent U.S. labor market data showed weakness, with higher jobless claims and downward revisions in nonfarm payrolls.
CPI inflation remains elevated, while PPI softened slightly, reinforcing bets on policy easing.
A weaker U.S. dollar and lower Treasury yields further boost gold’s appeal.
📉 Technical Analysis:
• Key Resistance: $3,670 – $3,674, with further upside potential toward $3,700–$3,730.
• Nearest Support: $3,600; if broken, next levels at $3,561–$3,536.
• EMA: Price is trading above EMA50 and EMA200, keeping the bullish structure intact.
• Candlestick / Momentum: RSI remains elevated, showing strong upward momentum though slightly overbought; dips are being bought quickly.
📌 Outlook:
Gold may continue to rise in the short term if Fed maintains a dovish stance and U.S. data remain soft.
However, stronger-than-expected inflation or hawkish Fed signals could trigger a pullback toward $3,600 or lower.
________________________________________
💡 Suggested Trading Strategy:
• SELL XAU/USD: $3,682 – $3,685
🎯 TP: 40 / 80 / 200 pips
❌ SL: $3688
• BUY XAU/USD: $3,617 – $3,620
🎯 TP: 40 / 80 / 200 pips
❌ SL: $3614

XAUUSD – Should You Trade the Red News… or Let Them Trade You?🌟The Hype vs. Reality
Every NFP Friday, you’ll see traders flexing $500 to $5,000+ in one candle. But the reality check is that 95% of accounts are blown by spreads, slippage, and whipsaws. News looks like payday, but for the market, it is traps set both ways for retail traders.
Why Gold + Red USD News Is a Dangerous Mix
XAUUSD reacts harder with momentum than any other Forex pair.
NFP, CPI, FOMC, PCE — every release creates engineered chaos.
Typical pattern: spike one way → sweep stops the other way → only then trend resumes.
Example: NFP prints strong, Gold dumps 100+ pips, sweeps liquidity, then rips 350+ pips bullish with the higher-timeframe trend.
🔴When You Shouldn’t Touch It (Beginners)
If you’re still learning structure, stay flat. Here’s why:
• Spreads jump 10–30 pips instantly.
• SLs get slipped or completely ignored.
• First candle is pure manipulation.
• Emotions peak → revenge trades blow the account.
• Best move: study the reaction and wait for a safe entry, repeat 100+ times X more.
🟢When You Can Consider It (Intermediate Traders)
For traders with experience 1year+ on the charts:
• Before the release: position based on HTF bias, with very small risk.
• After the release: wait for the spike to finish, then take structure-backed entries.
Example: CPI prints weak, Gold jumps → once the fakeout clears and structure reclaims, you trade the continuation.
🖊️The Truth Nobody Likes to Hear
News doesn’t set the trend; instead, it likes to accelerate the story the chart was already telling.
If you can’t trade Gold without news, why would you dream of lying to yourself that an Unemployment Claims would make you instantly rich?
Final Note:
Trading XAUUSD over Red folder news is not proving catching the spikes. You need to show by sitting put, waiting for the dust to settle, that you trade with structure.
Beginners should grab some popcorn, watch it, and study for a while.
Intermediate traders can use news as fuel.
But if you dive in blind, remember XAUUSD doesn’t care about your trade; most likely, it will feed on it while you are volunteering as liquidity.
If this article helped you today and brought you more clarity:
Drop a 🚀 and follow us✅ for more trading ideas and trading psychology. Thank you.

ANFIBO | I think XAUUSD on 12.10.2025 ???After breaking the H1 uptrend line, Gold returned to the Fibo retracement zone 0.5 with a strong rebound, the current price is moving around the price zone 3655 and still maintains a strong rebound. Pay attention to the following important zones for today's strategy:
>> SELL SCALP: 3673 - 3675, SL 3678, TP 3655 - 3625 - 3600
>> BUY SCALP: around 3595, SL 3588, TP 3625 - 3645 - 3665
>>> SWING BUY: 3560 - 3570, SL 3550, TP 3620 - 3675 - 3700 - OPEN
>>> SWING SELL: 3790 - 3801, SL 2820, TP 3700 - 3570 - 3450 - OPEN
Have a nice weekend guys! :D

CPI data is confusing,gold is fluctuating in a bearish directionGold Technical Analysis: Looking back at the recent trend, gold surged and then retreated on Tuesday, forming a shooting star pattern. However, the decline did not continue on Wednesday, indicating that the pullback was merely a one-off adjustment and lacks sustainability. It is a normal correction after a significant rally. Even if the market peaks, it will not be so simple. It will at least undergo a process of "high-level fluctuations turning bearish" or "second upward attack to lure more investors and then decline." In the short term, the rebound will continue to fluctuate, and it is unlikely to see significant rises or falls in a short period of time. Looking at the daily gold chart, the daily gold line has slowed down slightly. After continuous large volume, the daily line has turned into a small Yinxing candlestick pattern for consolidation. There is a need for a short-term pullback. Considering the short-term chart, the second high-point test failed to break through the previous high, the previous continuous large volume without a pullback, and the pressure from the second upward test. If there is no new high in the short term, there will be a partial correction around 3675-3657. The pattern will determine whether it is a deep pullback or a sideways consolidation.
Judging from the 4-hour gold chart, yesterday's gold price failed to achieve results in its attempt to rise again. There are signs of a downward correction. The 4-hour chart lost the middle track, breaking the unilateral upward momentum. At the same time, there is a need to further retrace to the lower track. Combined with the second high in the hourly chart near 3657, the second pressure turned into a decline. The strong market is to retrace and then break the high. Once the breaking power is stopped, it will go into a shock correction. Overall, today's short-term gold operation strategy recommends shorting on rebounds as the main strategy, and buying on pullbacks as the auxiliary strategy. The short-term focus on the upper side is the 3640-3650 resistance line, and the short-term focus on the lower side is the 3610-3600 support line.
Gold Spikes After CPI but Faces Profit-Taking Pressure📊 Market Move:
Right after the CPI release, gold surged from $3613 to $3643, but profit-taking quickly dragged prices back to around $3635.
📈 Technical Analysis:
🔺 Resistance: 3645 – 3650
🔻 Support: 3626 – 3620
📉 Short-term EMA still points upward, suggesting the uptrend remains intact, though momentum has weakened after the spike.
🧐 Outlook:
Gold is undergoing a technical pullback after the sharp rally; the market needs further H1/H4 candle confirmation to see if the bullish move toward 3650+ continues.
🎯 Trading Strategy:
o Wait for a retest of 3626–3620; if reversal candles appear, consider a Buy following the trend.
o If price breaks below 3620, risk opens for a deeper drop toward 3610–3605.

Gold trend analysis continues to rise after consolidationGold trend: Today, gold focuses on the impact of CPI data, which may impact the temporary technical view. Today, the Asian and European sessions maintain a low-long bullish trend, with support at 3620-3610 and short-term focus on 3645-3655. The US data has little impact, so it depends on the range. If the data has a large impact, focus on 3600 below and 3680-3690 above. Gold has risen unilaterally in two transactions and fluctuated for one trading day this week. The current high of gold is 3675, and the decline is only around 3620. Therefore, it is obvious that gold is rising slowly under the bullish trend, and even if it fluctuates, it will not fall much. Then, to determine the direction, we must look at the upward space under the direction. We still don’t guess the top, but under the influence of data, we still have to discuss whether there will be a change in direction or a shift in strength in the near future.
From a technical point of view, the daily line is still above the support of the 5-day moving average. If the 5-day moving average is not broken, there is no possibility of weakening. Although the 4-hour Bollinger Bands have closed, the middle track has not broken, and it is difficult to have a major adjustment. Therefore, the current market is still in a strong position. It is not clear whether gold has peaked or has a larger adjustment space. Therefore, if you want to trade, you still have to go long on the decline. So, today's market can be viewed in two steps. The European session is expected to fluctuate upward. Operate at key points and go long in the 3620-3610 support area below. Look at the 3645-3655 area above. If the US data has a greater impact, pay attention to the gains and losses of the 3600 key point below. It is still a good time to go long if it does not break.

ANFIBO | I think XAUUSD on 11.10.2025 ???Well, today's gold price has broken the current H1 uptrend line, the price is currently around 3620, and is still holding on to the H4 uptrend line. We will need to pay attention to the following important resistance and support zones:
>> SELL SCALP: around 3670, SL 3677, TP 3600 - 3575
>> BUY SCALP: around 3580, SL 3570, TP 3665
>>> SWING BUY: 3560 - 3570, SL 3550, TP 3620 - 3675 - 3700 - OPEN
>>> SWING SELL: 3790 - 3801, SL 2820, TP 3700 - 3570 - 3450 - OPEN
Have a nice day guys ;)

Gold Pulls Back Short-Term After Hitting $3,673📊 Market Overview:
• Gold eased after touching $3,673, pressured by profit-taking and a slight rebound in the U.S. Dollar.
• Expectations of Fed rate cuts continue to support gold in the medium term, but near-term correction pressure is dominant.
• Geopolitical tensions and bullish forecasts of $3,800–$4,000 remain longer-term supportive factors.
📉 Technical Analysis:
• Key Resistance: $3,645 – $3,670
• Nearest Support: $3,600, further down $3,585
• EMA 09: Price is currently below EMA 09, signaling short-term bearish pressure.
• Candles / Momentum: After peaking at $3,673, gold formed a corrective sequence; RSI has cooled off from overbought, confirming selling pressure in the short term.
• Fibonacci Extensions: A breakout above $3,670 could open the way toward $3,697 and $3,725.
📌 Outlook:
In the short term, gold is likely to continue correcting toward $3,600 before buyers may step back in. A reclaim of EMA 09 and a breakout above $3,670 could extend the bullish move toward $3,697 – $3,725.
💡 Suggested Trading Strategy:
🔻 SELL XAU/USD : $3,670 – $3,673
🎯 TP: 40 / 80 / 200 pips
🛑 SL: $3676
🔺 BUY XAU/USD : $3,602 – $3,605
🎯 TP: 40 / 80 / 200 pips
🛑 SL: $3,599

Bulls vs Bears: Race to 3700 or 3600 ?!Currently, gold is fluctuating above the 3640 line. We can clearly see that gold has not effectively fallen below 3640 during multiple pullbacks in the short term. This proves that during the pullback period of gold, a lot of funds have entered the market, thereby pushing the gold price to fluctuate upward. However, during the upward fluctuation, gold encountered resistance and fell back in the 3655-3660 area many times, exacerbating the short-term volatility trend!
But we need to note that gold has rebounded since 3620 and formed a band-like low point structure; and it has tested 3640 many times and has not fallen below it, showing signs of forming a band-like secondary low point structure. Judging from the characteristics of the low point gradually rising, the current bullish force has a slight advantage, so short-term trading is still dominated by going long on gold.
Judging from the current structure, the short-term support area below is located in the 3635-3625 area, followed by the 3615-3605 area; and the short-term resistance is located near 3660. If gold breaks through the area near 3660 during the volatile upward process, gold may test the high point area near 3675. Once the high point near 3675 is refreshed again, it is expected to directly touch around 3700.
Therefore, it is not completely certain that gold has peaked at present, and we should not blindly chase short gold in trading; on the contrary, when gold retreats to the support area of 3635-3625, we can try to go long on gold, first aiming at the target area: 3660-3670, and once it breaks through this area, the target area will be postponed to the 3690-3700 area.

How to correctly grasp the gold trading opportunities?Yesterday, the technical side of gold rose first and then fell. The overall gold price continued to rise strongly in the Asian and European sessions, and finally fell back in the U.S. session and fell into repeated fluctuations, and finally closed near 3628. The daily K-line closed at a high and then fell back and fluctuated in the middle. Yesterday, I kept notifying everyone that the technical side needed to retrace and not to be overly bullish on gold. Now everything is perfectly in line with expectations. Friends who follow me can see it. Today we continue to treat it with the idea of going long on retracements. After all, I believe that the trend has not reversed, and going long on retracements is still the general trend. Today, we will first focus on the short-term support at 3620-3610 below, and continue to go long if it retraces and does not break. If you encounter troubles in your current gold operations and want to make your investment journey more stable and avoid detours, please feel free to communicate with us at any time!
From the 4-hour level, today's short-term support for gold will focus on the 3620-3610 area, and the 3600 mark is the core dividing line between the strength of the bulls. If it retraces and stabilizes above this position during the day, the overall bullish thinking will remain unchanged. The main tone is still to go long on the retracement. At the daily level, as long as gold stabilizes above 3600, the low-long thinking will be sustainable. As for the counter-trend short positions, specific reminders will be given according to the pressure on the market at high levels. Brothers just need to pay attention to the bottom in time.
Gold operation strategy: Go long on gold when it retraces to around 3620-3610, target 3650-3660, and continue to hold if it breaks through.
Gold testing highs, possible pullback below $3,675📊 Market Overview:
Gold surged to an all-time high at $3,673.95/oz on September 9, 2025, driven by Fed rate-cut expectations, USD weakness, and strong central bank demand.
On September 10, gold is consolidating around $3,635/oz, with markets awaiting key US inflation data.
📉 Technical Analysis:
• Key Resistance: $3,675 – $3,700
• Nearest Support: $3,600 – $3,620
• EMA: Price remains above EMA 09 → bullish momentum intact.
• Candlestick / Volume / Momentum: Technicals still show Strong Buy signals, but overbought conditions suggest short-term pullback risk.
📌 Outlook:
Gold may pull back in the short term if sellers defend the $3,675–$3,700 zone, but a breakout above this level could trigger another rally toward $3,720–$3,750.
💡 Trading Strategy Suggestion:
🔻 SELL XAU/USD: 3697 – 3700
🎯 TP: 40 / 80 / 200 pips
🛑 SL: 3703
🔺 BUY XAU/USD: 3617 – 3620
🎯 TP: 40 / 80 / 200 pips
🛑 SL: 3614
Gold hits new ATH at $3,657–Bullish momentum eyeing $3,675–3,690🟡 Market Overview
Gold extended its rally and just hit a new all-time high at $3,657/oz. The move is fueled by expectations of a Fed rate cut in September, weaker USD, and lower bond yields. Safe-haven demand remains strong as US labor data signals economic slowdown.
📉 Technical Analysis
• Resistance (near): 3670 – 3675
• Resistance (far): 3690 – 3700
• Support (near): 3640 – 3635
• Support (far): 3615 – 3605
• Price is trading above EMA20 and EMA50 on H1, confirming the bullish momentum. Strong volume at the 3650 breakout zone supports further upside.
📌 Outlook
Main trend: Bullish Gold could extend gains toward 3675 – 3690 as long as it holds above 3640. Short-term pullbacks may occur before continuation.
🎯 Suggested Trading Strategy
• BUY XAU/USD
Entry: 3645 – 3648 (after a pullback holding above 3640)
🎯 TP: 3670 / 3690
🛑 SL: 3630
• Short-term SELL (speculative, small size only)
Entry: 3672 – 3675 (near resistance)
🎯 TP: 3645
🛑 SL: 3678

Gold Extends Rally as Fed Rate-Cut Bets Intensify📊 Market Overview
• Spot gold is trading around $3,583–3,588/oz, close to its all-time high near $3,600.
• Main driver: Weak U.S. August jobs data boosted expectations for aggressive Fed rate cuts this month.
• A weaker USD and strong central bank purchases continue to support demand.
• Short-term outlook remains bullish, though overbought signals point to possible technical pullbacks.
📉 Technical Analysis
• Key Resistance: $3,600 (psychological), $3,620–3,625 (extended resistance).
• Nearest Support: $3,574 (Fibo 0.236), $3,560–3,580 zone.
• EMA: Price stays above EMA21 → bullish trend intact.
• Candlesticks / Momentum: Bullish flag structure; RSI >80 (overbought), suggesting possible pullback.
📌 Outlook
Gold may continue its upward momentum if Fed signals dovish policy and USD weakens further.
However, a technical correction is likely if profit-taking intensifies around $3,600–3,625.
💡 Suggested Trading Strategy
SELL XAU/USD: $3,622 – $3,625
🎯 TP: 40/80/200 pips
❌ SL: 3628
BUY XAU/USD: $3,577 – $3,580
🎯 TP: 40/80/200 pips
❌ SL: 3574

Gold Retreats After $3597 ATH🔎Gold Outlook (Post-NFP)
• Main Trend: Gold remains in a strong uptrend, supported by weak NFP data → weaker USD → almost certain Fed rate cut in September.
• Short-term Support: $3,573 (tested and bounced 1–2 times). If broken, the next supports are at $3,560 and deeper at $3,545.
• Near-term Resistance: $3,590 – $3,600 (ATH). A breakout here could target $3,620–$3,630.
• EMA & Momentum: Price is still above the EMA9 & EMA21 on H1/H4, indicating the bullish trend remains intact, though momentum has slowed after hitting ATH.
• Market Sentiment: After a sharp rally, the market is pausing for consolidation — a healthy sign in a broader uptrend.
📌 Conclusion : In the short term, gold may consolidate between $3,573–$3,590 before choosing direction. Holding above $3,573 increases the chance of retesting $3,600 and higher. A break below $3,573 could trigger a deeper pullback toward $3,560–$3,545.
