GOLD STEPS UP – HITS NEW ATH AT $3 565📊 Market Overview:
Gold has now reached $3 565/oz, continuing its bullish ascent amid persistent global uncertainty. Safe-haven demand remains strong, and the market reflects near-certain expectations (92%) of a Fed rate cut in mid-September
📉 Technical Analysis:
• Key Resistance: $3 570 – $3 580
• Nearest Support: $3 555 – $3 560
• EMA: Price remains well above EMA09 & EMA50 → strong bullish momentum.
• Candlestick / Momentum: A breakout above prior resistance accompanied by high volume confirms strengthening upward momentum
📌 Outlook:
Despite modest economic data, gold continues its rally and just hit a new high. A short-term pullback to support zones remains possible, but the upward trend is firmly intact.
💡 Trading Strategy Suggestions:
✅ BUY : $3555 – $3558
🎯 TP: $3570
❌ SL: $3553
Goldplan

Gold Approaching $3,550 – Continuing Uptrend📊 Market Movement:
Gold has shown a corrective decline to around $3530 before stabilizing. The market is awaiting new momentum as traders balance between profit-taking and expectations of a continued uptrend.
📈 Technical Analysis:
- Resistance: $3550 – $3565
- Support: $3518 – $3525
- EMA trend: Still pointing upward, but showing early signs of consolidation.
- Candle patterns: Strong rejections near $3530 indicate demand remains solid.
🔎 Outlook:
Gold is still bullish in the medium term, but short-term corrections are expected before another upward attempt. Traders should remain cautious at resistance levels and look for confirmation signals at supports.
🎯 Trading Strategy:
🔻 SELL XAU/USD
Entry: $3542–3545
🎯 TP: 40/80/200 pips
🛑 SL: $3.548
🔺 BUY XAU/USD
Entry: 3520 – 3523
🎯 TP: 40 / 80 / 200 pips
🛑 SL: 3517

Gold Extends Rally on Rising Rate-Cut Expectations📊 Market Developments:
Gold hit an all-time high around $3 508/oz before easing to about $3 494/oz, driven by a weaker U.S. dollar and growing expectations for a Fed rate cut in September. Markets are pricing in roughly a 90% probability of a rate cut this month.
📉 Technical Analysis:
• Resistance: $3 500 – $3 525 – $3 560
• Support: $3 425 – $3 400
• EMA: Price remains above EMA 09 → bullish trend
• Candlestick / Momentum: Indicators (RSI, MACD, CCI) all show strong buy momentum.
📌 Outlook:
Gold is in a clear short-term uptrend. A breakout above $3 500 may lead to $3 525 – $3 560. On the downside, strong support sits around $3 425 – $3 400, ideal for potential pullback entries.
💡 Trading Strategy:
🔻 SELL XAU/USD
Entry: $3 522 – $3 525
🎯 TP: 40/80/200 pips
🛑 SL: $3 528
🔺 BUY XAU/USD
Entry: $3 425 – $3 428
🎯 TP: 40/80/200 pips
🛑 SL: $3 422

Gold Consolidates Below $3,500📊 Market Overview
Gold trades near $3,487/oz, supported by Fed rate-cut bets and a weaker USD. Traders await this week’s NFP for clearer direction.
📉 Technical Analysis
• Key resistance: $3,490–$3,500
• Nearest support: $3,465
• EMA 09: Price remains above EMA 09 → short-term uptrend still intact.
• Momentum: High RSI, signaling risk of a short-term pullback.
📌 Outlook
Gold remains in a short-term uptrend, but volatility around $3,490–3,500 will define the next move.
💡 Suggested Trading Strategy
Base Scenario
• 🔻 SELL XAU/USD at $3,490–$3,493 → TP $3,470, SL $3,496
• 🔺 BUY XAU/USD at $3,464–$3,467 → TP $3,485, SL $3,461

Gold Reaches New High at 3,486 Amid Rising Rate-Cut Expectations📊 Market Overview:
Gold surged to a new high at $3,486/oz, surpassing earlier levels around $3,470, driven by elevated expectations of a Fed interest rate cut this month.
A weaker USD—amid dovish Fed comments and a court ruling limiting Trump-era tariffs—further underpinned gold’s appeal.
📉 Technical Analysis:
• Key resistance: $3,490–$3,495 (psychological barrier before $3,500).
• Nearest support: $3,460–$3,465 (EMA 09 + technical zone).
• EMA 09: Gold is trading above EMA 09 → bullish momentum.
• Candles / Volume / Momentum: Continuous rally with strong demand; however, a pullback is likely near resistance.
📌 Outlook:
Gold may continue climbing in the short term if Fed cut expectations remain firm and USD stays weak.
However, stronger US data (such as this week’s NFP) could dampen rate-cut bets and trigger a short-term correction.
💡 Suggested Trading Strategy
🔻 SELL XAU/USD : ~$3,492–$3,495
🎯 TP: 40/80/200 pips
🛑 SL: ~$3,498
🔺 BUY XAU/USD : ~$3,462–$3,465
🎯 TP: 40/80/200 pips
🛑 SL: ~$3,459

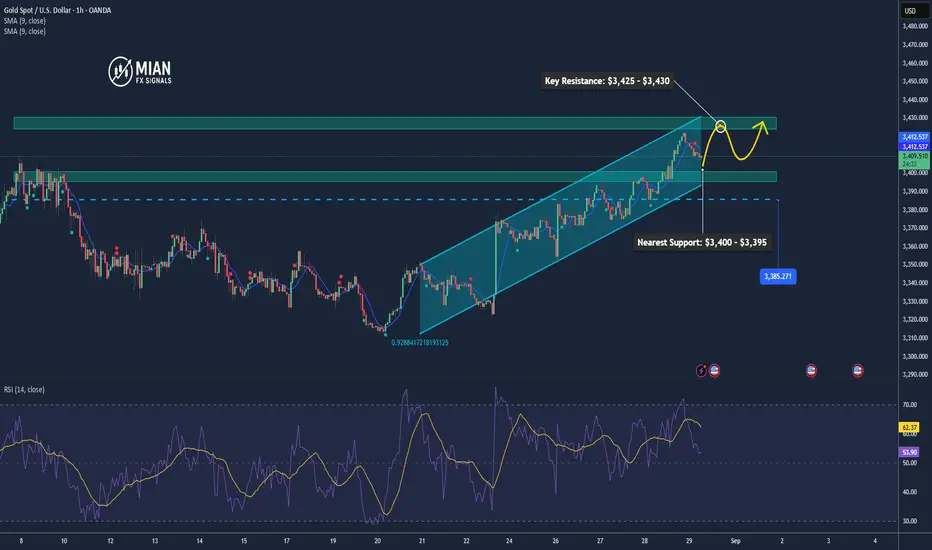
Gold Pulls Back Slightly Ahead of U.S. PCE Data📊 Market Dynamics:
Gold eased to around $3,408/oz due to profit-taking after the recent rally, while investors await U.S. PCE inflation data – a key indicator that could influence the Fed’s rate-cut decision.
📉 Technical Analysis:
• Key Resistance: $3,425 – $3,430
• Nearest Support: $3,400 – $3,395
• EMA 09: Price remains above EMA 09, keeping the bullish bias intact.
• Candlestick / Momentum: H1 candles show long lower wicks around $3,400, signaling potential buying pressure.
📌 Outlook:
In the short term, gold may consolidate around $3,400 and rebound if PCE data reinforces expectations of an imminent Fed rate cut.
💡 Suggested Trading Strategy:
🔻 SELL XAU/USD: $3,427 – $3,430
🎯 TP: 40/80/200 pips
❌ SL: $3,433
🔺 BUY XAU/USD: $3,397 – $3,400
🎯 TP: 40/80/200 pips
❌ SL: $3,394
Gold Holds Firm as USD Weakens📊 Market Moves
Gold remains stable around $3,384–3,385/oz as the US dollar weakens, driven by concerns over Fed independence — especially President Trump’s threats to fire Fed Governor Lisa Cook — boosting safe-haven demand.
📉 Technical Analysis
• Key Resistance: $3,400, followed by $3,435
• Nearest Support: $3,350, then $3,324 (100-day SMA)
• EMA/SMA: A bullish cross is forming as the 21-day SMA moves above the 50-day SMA → short-term uptrend intact
• RSI & Momentum: RSI (14) at ~54, staying above 50 → buyers still dominant
📌 Outlook
Gold is likely to edge higher in the short term if the USD remains weak and dovish Fed signals strengthen.
💡 Suggested Trading Strategy
🔻 SELL XAU/USD : $3,396–3,399
🎯 TP: 40/80/200 pips
🛑 SL: $3,403
🔺 BUY XAU/USD : $3,350–3,353
🎯 TP: 40/80/200 pips
🛑 SL: $3,347

Gold Rebounds from 3,352 – Potential Rally Toward 3,390📊 Market Developments:
On August 26, 2025, gold dropped to a low of ~$3,351.44/oz before sharply rebounding to ~$3,386.49/oz in the same session. The rebound was fueled by a weaker USD after President Trump dismissed Fed Governor Lisa Cook, boosting safe-haven demand. At the same time, dovish signals from the Fed reinforced rate cut expectations, further supporting gold.
📉 Technical Analysis:
• Key Resistance: ~$3,385–3,390
• Nearest Support: ~$3,350–3,352
• EMA 09: Price is trading above EMA 09, showing bullish momentum remains intact.
• Candlestick / Momentum: Strong bullish candle formed from ~$3,352, supported by positive RSI and MACD, confirming active buying pressure.
📌 Outlook:
Gold is likely to continue rising in the short term if it stays above 3,350–3,352 and successfully breaks 3,385–3,390, opening the way toward 3,400–3,410. A break below 3,350 could trigger a correction back to 3,330–3,340.
💡 Suggested Trading Strategy:
🔺 BUY XAU/USD at: 3,352–3,355
🎯 TP: 40/80/200 pips
❌ SL: 3,349
🔻 SELL XAU/USD at: 3,387–3,390
🎯 TP: 40/80/200 pips
❌ SL: 3,393

WILL GOLD BREAK THE BOX : LETS ASK FROM GOLD Hello
Iam Expect From gold that i will see it will break the consolidation box
Buy Gold When Its Break The Box And Continuation Buying Gold
Gold Give A Bullish FVG So We Are Expecting Bullish Momentum
Gold Buy At Bullish FVG And 3376 / 3370 Buy Zone
Manage Your Trade , Good Luck With Your Trading

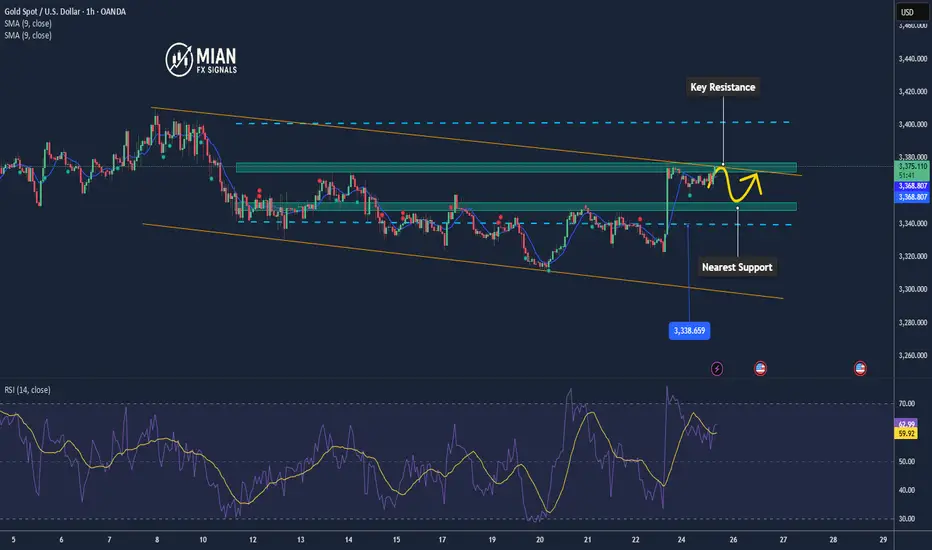
Gold Testing 3375 – Watch for Reversal or Breakout📊 Market Overview:
• Gold touched the $3,375 resistance zone, its highest level in two weeks, as the US dollar showed slight recovery.
• However, expectations of a Fed rate cut in September remain supportive for gold after Powell’s dovish remarks at Jackson Hole.
📉 Technical Analysis:
• Key Resistance: $3,375 – $3,378
• Nearest Support: $3,350
• EMA 09: Price trading above short-term EMA → bullish momentum intact
• Candle / Volume / Momentum: Indicators (RSI, MACD) show strong buy signals, but the 3375 level is a decisive barrier.
📌 Outlook:
Gold may continue upward if it breaks above $3,378 with strong momentum, targeting $3,392–$3,400.
If price fails at $3,375 and closes below $3,370, a short-term correction toward $3,355–$3,350 is likely.
💡 Suggested Trading Strategy:
🔻 SELL XAU/USD
Entry: $3,377 – $3,380
🎯 TP: $40/80/200 pips
🛑 SL: $3,385
🔺 BUY XAU/USD
Entry: $3,350 (support zone)
🎯 TP: $40/80/200 pips
🛑 SL: $3,344
Gold Pulls Back Slightly as USD Strengthens,Fed Support in Place📊 Market Overview:
Gold prices dipped around 0.2% to about $3,364/oz as the U.S. dollar rallied, reducing gold's appeal to foreign buyers. Still, expectations of an interest rate cut from the Federal Reserve continue to provide support for bullion
📉 Technical Analysis:
• Key Resistance: around $3,370 – $3,375, with potential upside toward $3,400 if broken
• Nearest Support: around $3,350 – $3,360
• EMA (assumed EMA 09): Price hovering near EMA09; short-term trend unclear—charts needed to confirm breakout or breakdown.
• Candlestick/Volume/Momentum: Slight selling pressure observed; momentum modest, while Fed-driven optimism limits downside.
📌 Outlook:
Gold may edge higher in the short term if the USD weakens and the Fed signals actual easing over upcoming policy moves. A stronger USD may trigger another short-term correction.
________________________________________
💡 Proposed Trading Strategy:
SELL XAU/USD around $3,373 – $3,375
🎯 TP: 40/80/200 pips
❌ SL: ~$3,378
BUY XAU/USD: $3,350 – $3,353
🎯 TP: 40/80/200 pips
❌ SL: ~$3,347

Gold Short-term: Selling Pressure Increases After Breaking 3340📊 Market Overview:
Gold broke 3340 due to strong selling pressure following hawkish Fed comments and strong USD data. Investor sentiment leans defensive, pushing gold down to 3328.
📉 Technical Analysis:
• Key resistance: 3335–3340
• Nearest support: 3320–3315
• EMA: Price below EMA09 → short-term bearish trend
• Candlestick / volume / momentum: Strong red candles with increasing volume indicate sustained selling pressure
📌 Outlook:
Gold may continue to decline in the short term if it fails to reclaim 3340, targeting support around 3320–3310.
💡 Suggested Trading Strategy:
🔻 SELL XAU/USD : 3335–3338
🎯 TP: 40/80/200 pips
❌ SL: 3340
🔺 BUY XAU/USD : 3319–3322
🎯 TP: 40/80/200 pips
❌ SL: 3315

XAUUSD – Gold in Tight Consolidation | Weekend Trading PlanGold is currently showing the classic sequence: accumulation – breakout – consolidation again. Price is moving within a narrowing triangle pattern, preparing for the next explosive move.
From both a technical perspective and the macro–geopolitical backdrop, Gold is hesitating to choose a clear direction in the short term. But remember: the tighter the range, the stronger the breakout.
👉 Strategy: Wait for the breakout, then follow the direction with clear key levels for reactions and take-profit setups.
🔑 Key Levels
Resistance: 3337 – 3343 – 3350 – 3356 – 3365
Support: 3325 – 3320 – 3314
📌 Scenario 1 – Buy Setup
Buy Zone: 3316 – 3314
SL: 3309
TP: 3320 – 3325 – 3330 – 3335 – 3340 – 3345 – 3350 – 3360 – 3370
📌 Scenario 2 – Sell Setup
Sell Scalp: 3348 – 3350
SL: 3355
TP: 3344 – 3340 – 3335 – 3330
Sell Zone (Main Reaction): 3365 – 3367
SL: 3372
TP: 3360 – 3355 – 3350 – 3345 – 3340
🎯 MMFLOW Notes
Price compression = incoming volatility.
Always prepare two scenarios when trading narrow ranges.
Patience is profit – wait for market confirmation at key levels.

Gold fell to 3325 after the US and EU reached a trade agreement📊 Market Overview
Gold is consolidating as traders await Fed Chair Powell’s speech at Jackson Hole. A slightly firmer USD is acting as a mild headwind.
Reuters reported spot gold trading around $3,340/oz earlier today with a wait-and-see tone.
📉 Technical Analysis
• Key Resistance: 3,361 → next levels 3,375–3,400.
• Nearest Support: 3,323 → next levels 3,300–3,285.
• EMA: Price is trading below EMA50, signaling short-term bearish pressure.
• Pattern / Momentum: Market is in a consolidation phase, with selling pressure emerging near resistance. Bearish bias likely if 3,350–3,361 fails to break.
📌 Outlook
In the short term, gold is expected to range-trade between 3,323 and 3,361.
• Holding above 3,323 favors a bounce toward 3,340–3,350.
• A break below 3,323 risks a move down to 3,315–3,310.
💡 Suggested Trading Strategy
SELL XAU/USD at: 3,350–3,360
🎯 TP: ~3,330 ❌ SL: ~3,370
BUY XAU/USD at: 3,330–3,322
🎯 TP: ~3,350 ❌ SL: ~3,312

XAUUSD: Channel Ride to the Top or Fakeout Incoming?Gold is moving inside an uptrend channel, building momentum after bouncing from support. Right now, price is testing the key zone 3344 – 3348 – this is where the market will decide its next move.
📊 MMFLOW Outlook
✅ Scenario 1: Trend continuation (main bias)
Holding above 3344 – 3348 keeps the bullish structure intact.
A clean breakout over 3348.7 opens the path to:
→ Target 1: 3361.2
→ Target 2: 3369.8 (top of the channel)
⚠️ Scenario 2: Deeper retest before the move
If price rejects 3348 – 3351, a dip back to 3334 is likely.
Buyers may step in here to reload positions and push price higher.
A break below 3334 would weaken the bullish setup short-term.
📌 Key Levels (NY Session):
Support: 3334 | 3344 – 3348
Resistance: 3361.2 | 3369.8
✨ MMFLOW Note:
👉 Bias stays bullish, but patience at liquidity zones is key.
👉 Follow the flow – manage risk before the market makes the move.

Gold Holds Steady Amid Consolidation Phase📊 Market Overview:
Gold is holding steady around $3,342/oz, slightly lower by ~0.1% as investors await Fed Chair’s speech at the Jackson Hole symposium. Meanwhile, geopolitical risks continue to support gold as a safe-haven asset.
📉 Technical Analysis:
• Key Resistance: $3,350 – $3,435
• Nearest Support: $3,300 – $3,310 (100-day MA)
• EMA: Price is trading above the 100-day MA but still below the 200-hour MA, signaling short-term recovery momentum but resistance ahead.
• Candle / Momentum: Market remains in a tight consolidation range; RSI shows potential cooling before the next move.
📌 Outlook:
Gold may edge higher in the short term if the Fed signals a dovish shift (rate cut), targeting the $3,400 zone. If policy remains unchanged, gold could consolidate further or retrace toward $3,300.
💡 Trading Strategy Suggestions:
🔻 SELL XAU/USD : $3,370 - $3,373
🎯 TP: 40/80/200 pips
🛑 SL: $3,376
🔺 BUY XAU/USD : $3,310 – $3,313
🎯 TP: 40/80/200 pips
🛑 SL: $3,307

Gold Holds $3310 Support, Trading Around $3319📊 Market Overview
Gold dropped to the $3311/oz zone (near a technical bottom) and then rebounded, currently trading around $3319/oz. This indicates buying interest emerging at a key support, while overall market sentiment remains cautious ahead of Fed signals.
📉 Technical Analysis
• Near-term resistance: $3325 and $3335
• Near-term support: $3310 and $3300
• The rebound from $3311 shows that the $3310 level is acting as strong short-term support.
• EMA20 on H1 still points downward, indicating selling pressure remains, but RSI shows an oversold condition, signaling a potential short-term technical rebound.
🔎 Outlook
In the short term, gold is likely to range between $3310 – $3330. Holding above $3310 could allow price to retest $3325 – $3335. If $3310 breaks, the decline could extend toward $3300.
🎯 Suggested Trading Strategy
🔺 BUY XAU/USD
Entry: 3300 – 3297
🎯 TP: 40 / 80 / 200 pips
🛑 SL: 3394
🔻 SELL XAU/USD
Entry: 3327 – 3330
🎯 TP: 40 / 80 / 200 pips
🛑 SL: 3333

Gold Plan M15 – Captain VincentContext:
The M15 chart shows price currently sitting right at the Premium Supply zone — a level that has repeatedly held and triggered bullish reactions in the past. However, with the short-term trend leaning bearish, this zone may no longer serve as a strong “shield.”
Today’s focus:
Sell in line with the main downtrend at the nearest resistance zone.
Buy from deeper levels if price breaks support and forms an FVG gap below.
1. Sell Zone – Premium Defense 🛡️
Entry: 3345 – 3347
SL: 3351
TP: 3343 → 3340 → 3337 → 3333 → 33xx
Meaning: A short-term resistance area, ideal for selling in line with the bearish momentum.
2. Buy Setup – Hidden FVG ⚓
Entry: Will wait at the lower FVG zone (to be updated once price approaches).
Meaning: If price breaks through the current Supply zone, shift bias to Buy at the lower FVG, taking advantage of a technical rebound.
Scenarios for today:
If price retests 3345 – 3347 → Sell with the trend.
If price breaks the Premium Supply zone → Watch for rebound strength and prepare to Buy at the lower FVG.
If neither zone is reached → Stay out, wait for a clear signal.
Captain’s Note:
“Lower timeframes like M15 are often stormy seas 🌊. Keep discipline: Sell only at the right zones, Buy only at the right levels, and never FOMO in the middle of the ocean. 🏴☠️”

GOLD (XAU/USD): IS THE BOUNCE ON THE CARDS?GOLD (XAU/USD): IS THE BOUNCE ON THE CARDS?
Alright, traders, let's have a quick look at Gold (XAU/USD).
The price has just hit the trendline right at the 3333 mark, and we're seeing a pretty strong rejection there. In my view, this isn't just traders taking profits; it looks like the buyers are already stepping in quite aggressively.
My Trading Plan
Buy Zone: I reckon this area is a great spot to get in and go long. It's an ideal entry to catch the potential next leg up.
Short-Term Targets:
My first target is 3345. We might see a slight reaction there before the price pushes higher.
The more ambitious target is the 3366 - 3368 zone.
Elliot Wave Outlook: The wave count isn't crystal clear just yet, but if this bounce holds up as expected, this move could be the start of Wave 3 in a new, medium-term bullish trend.
Strategy & Risk Management
Action: My priority is to buy into this strength.
Stop-Loss: To keep things safe, I'll place my stop-loss just below the recent M15 low. I'm looking to hold this for a potential medium-term trade.
What do you lot think? Do you reckon Gold is about to bounce higher from here? Share your thoughts below!

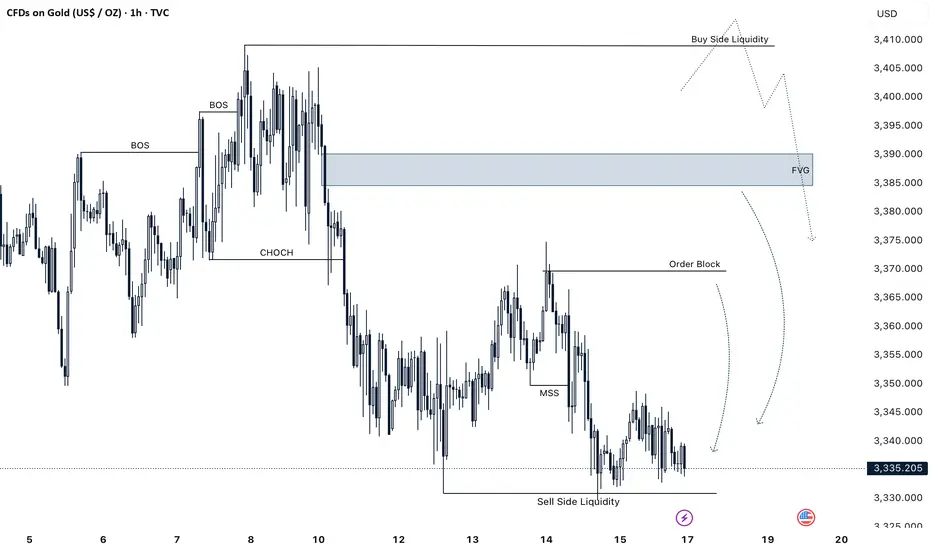
GOLD NEXT WEEK IDEA Hello Its ZGM
Next Week Gold Setups Looking 👀
Gold Takes Sell Side Liquidity
Now We Are Expecting Gold Next Move Will Be Bullish Then We Are Going To Sell At Order Block Price : 3368/3375 Selling Area
Next Zone For Sell At FVG Price : 3383/3390
Low Risk Sell Zone BSL Area Price : 3404/3412
Manage Your Trade Properly And Follow Us For More Trades
Gold Breaks $3,352 Support – Further Downside Risk📊 Market Overview:
• Spot gold is now trading at $3,352–3,356/oz, sliding sharply on profit-taking and uncertainty over potential U.S. import tariffs on gold.
• Weak buying interest at support pushed the price below the 200-hour MA, opening the door for deeper declines.
📉 Technical Analysis:
• Key resistance: $3,360–$3,365
• Nearest support: $3,345; next at $3,330
• EMA 09: Price remains below EMA09 → short-term trend is bearish
• Momentum: RSI below 45, sellers maintain control
📌 Outlook:
• Gold may continue to decline toward $3,345 or $3,330 if the H1 candle closes below $3,350.
• Only a break back above $3,365 with strong volume could trigger a short-term reversal.
💡 Suggested Trading Strategy:
SELL XAU/USD: $3,362–3,365
🎯 TP: 40/80/200 pips
❌ SL: $3,368
BUY XAU/USD: $3,345–$3,348 (only if clear bullish reversal candlestick forms)
🎯 TP: 40/80/200 pips
❌ SL: $3,342

Golden opportunities are not hard to grasp.Gold Market Forecast for Next Week: Gold News Analysis: The US dollar strengthened on Friday, but it is poised for a weekly decline as weak economic data led traders to price in the possibility of more interest rate cuts this year. Investors also assessed US President Trump's Federal Reserve nominations. Gold prices experienced a roller-coaster week from August 4th to 8th, particularly during the past two trading days, when reports of gold bar tariffs sparked market panic. Despite the White House's eventual clarification of the reports, gold prices remained near the peak of uncertainty, hovering around $3,400. Gold prices tested the $3,400 mark several times this week, but despite increasing expectations of a Fed rate cut and Trump's nomination of dovish Fed officials, prices remained above that level. Until Friday's news of gold bar tariffs, gold prices surged above the $3,400 mark, reaching a high of $3,409, the highest level since July 24th. Following the panic caused by the gold bar tariffs, and despite the US clarification of the reports, analysts and retail investors remain bullish on gold prices for next week. Next week, gold prices will focus on the meeting between Trump and Putin, as well as speeches by several Federal Reserve officials on the economic outlook, and the release of the July unadjusted CPI annual rate.
Gold Technical Analysis: Looking at the current gold price trend, after Friday's pullback and negative close, will gold prices continue to decline next week, or will they rebound and rise? I believe the former is unlikely. The possibility of a new low exists, but it is low. Several attempts at the 3380 support level have failed to break. First, looking at recent price trends, gold prices have continued to rise, with higher highs and lower lows, indicating that the 3268 support level is valid. After rebounding to 3409, it began to fall, closing near 3397, demonstrating the 3380 support level and the strength of bullish sentiment. This suggests that gold prices are currently range-bound at a high level. However, given that the support level remained intact and the price closed above it, the possibility of gold prices breaking below 3380 next week is ruled out. Gold prices failed to break below 3380 on Friday as expected, and the overall trend of rising, falling, and closing lower shows that bulls still have the upper hand. However, I think it is not advisable to conclude that bulls will control the market next week. Although bulls have repeatedly tested 3410 without success, the decline has not been strong. In other words, if the bulls were truly strong, there would be no decline the next day, and the opening of next week should continue to rise. However, the current gold price has not only slowed down its rise, but also shown signs of decline, which means that bears are still holding the 3410 resistance level.
Based on the above, we recommend a low-to-long strategy for early next week, supplemented by high-to-short strategies. Regarding support, watch out for 3380. After yesterday's repeated dips, this will become a key defensive point for bulls at the beginning of next week. A test or break of this resistance level is expected. An unexpected break below would disrupt the bullish short-term trend, with a high probability of seeing 3368 or a continuation of the decline to the 3350 area. However, we prefer a move higher above 3380. Regarding resistance, watch out for the 3410 area. Although this area is at 0.382, the dividing line between 3268 and 3500, and also represents resistance from Friday's high, after adjustments and with bullish momentum, the probability of a breakout is increasing. Therefore, we recommend focusing on the 3343 area, which provides strong resistance from the previous high and also represents the dividing line at 0.236. Upon first approaching or touching this area, try to enter a medium-term short position. On the whole, the short-term operation strategy for gold next week is recommended to focus on shorting on rebounds and long on pullbacks. The short-term focus on the upper side is the 3410-3420 line of resistance, and the short-term focus on the lower side is the 3380-3370 line of support.

Gold Breaks Support – Risk of Pullback Toward $3,310📊 Market Summary:
Gold prices initially rose on weaker-than-expected U.S. jobs data, which lowered Treasury yields and weakened the U.S. dollar. However, after breaking the key support at $3,365, gold continued to decline toward $3,354, and briefly touched $3,352, signaling rising technical selling pressure. Despite a 92% market expectation for a Fed rate cut in September, the technical breach increases the risk of a deeper correction.
📉 Technical Analysis:
• Key Resistance: Around $3,365–$3,370 – this zone now acts as short-term resistance; stronger resistance lies at $3,375–$3,380 if prices recover.
• Nearest Support:
The $3,365 level was broken.
New support is seen at $3,352–$3,350; a continued drop may bring prices to $3,335, and possibly toward $3,310–$3,300.
• EMA 09: Price is now below the 9-day EMA, suggesting a short-term bearish trend.
• Momentum / Volume / Candlestick:
RSI is near 50, slightly bearish; volume is tapering on the downside, indicating distribution.
Early signs of a head-and-shoulders (H&S) pattern are developing.
📌 Outlook:
Gold may continue declining in the short term if it stays below the $3,350–$3,352 zone.
A further drop toward the $3,335 – $3,310 region is possible.
If price rebounds and closes above $3,365, the bearish momentum could be neutralized.
💡 Suggested Trade Strategy:
🔻 SELL XAU/USD : $3,355–$3,358
🎯 TP: 40/80/200 pips
❌ SL: ~$3,361
🔺 BUY XAU/USD : $3,305–$3,302 (if price pulls back deeper)
🎯 TP: 40/80/200 pips
❌ SL: ~$3,299
