Huge fluctuations. Be wary of another sharp pullback.The gold market is never smooth sailing; volatility is the norm, and both rises and falls present challenges. Don't be impatient due to sudden surges, nor underestimate yourself because of brief pullbacks. Every market correction filters out the steadfast, and every adjustment prepares the ground for a new market trend. Anchor your direction with rationality, cultivate confidence with patience, and don't let short-term fluctuations disrupt your rhythm!
On Thursday, gold bulls tested the 5600 level, but the US session suddenly collapsed, with a rapid drop of 400 points in one hour and 212 points in five minutes – a truly breathtaking moment. Friday saw a similar pattern, reaching a high of around 5450 before quickly falling back to around 5111 in the early Asian session. Short-term fluctuations were tens of dollars per minute, making short-term trading extremely difficult. Currently, the technical picture shows a large range-bound movement, offering no favorable trading environment.
Under such violent volatility, any trade can be wiped out instantly. What we need to do now is patiently wait for market sentiment to cool down, for volatility to return to rationality, and for the trend to emerge clearly.
Friday will see the announcement of the new Federal Reserve Chair, with Kevin Warsh currently the frontrunner. If elected, his election would significantly boost the dollar and US Treasury yields, which would put downward pressure on gold prices. Therefore, everyone should be wary of another sharp price correction on Friday.I will post more strategies in the channel.
Goldpreis

Interest rate decision. Will the high point be surpassed again?The gold market has recently continued its strong upward momentum. As a globally recognized safe-haven asset, gold prices have hit new historical highs for eight consecutive days, successfully breaking through the $5250 mark and reaching the psychological barrier of $5300 during Wednesday's Asian trading session.
This phenomenon not only reflects the complexity of the current economic and geopolitical environment but also highlights investors' heightened sensitivity to uncertainty. Market funds continue to flow into gold due to the impact of decisions made by US President Donald Trump, while changes in the Federal Reserve's policy outlook further reinforce this trend.
Later interest rate decisions, even if the data is bearish, should not have a significant impact, as the market remains in a bull market. Currently, there is strong support around 5250-5230, which has now become a key support level. As long as this level is not broken, the market remains in an uptrend.
In summary, the short-term trading strategy for gold today should primarily focus on buying on dips, with selling on rallies as a secondary approach. The key resistance level to watch in the short term is 5290-5310, while the key support level to watch is 5250-5230.The gold market has recently continued its strong upward momentum. As a globally recognized safe-haven asset, gold prices have hit new historical highs for eight consecutive days, successfully breaking through the psychological barrier of $5250 and reaching $5300 during Wednesday's Asian trading session.
This phenomenon not only reflects the complexity of the current economic and geopolitical environment but also highlights investors' high sensitivity to uncertainty. Influenced by decisions made by US President Donald Trump, market funds continue to flow into the gold market, and changes in the Federal Reserve's policy outlook further reinforce this trend.
Later, even if the interest rate decision data is bearish, the impact should be limited, as the market is still in a bull market. Currently, the strong support level is around 5250-5230, which acts as a support-resistance flip point. As long as this level is not broken, the upward trend remains intact.
In summary, the short-term trading strategy for gold today is primarily to buy on dips and sell on rallies. The key resistance level to watch in the short term is 5290-5310, while the key support level to watch for buying opportunities is 5250-5230. I will post more trading strategies in the channel.

The market is strong. 5240 is not the end point.In the blink of an eye, the price of gold has reached $5,200. Gold no longer gives people time to think. A rise of $100 is as easy as breathing air. Just two days ago, people thought $5,000 was outrageous, but now that seems like a thing of the past. As for how high it can rise, no one can predict. As long as Trump is present, the US debt crisis exists, and geopolitical risks do not ease, the market's risk aversion will not be alleviated.
January is almost over, and the market delivered a perfect performance in the first month of 2026. The accelerated rise is impossible to keep up with, and the overall trend will continue to push prices higher. The Fed's interest rate decision was priced in, and nobody cares whether there will be a short-term rate cut. The market enthusiasm continues to push up gold prices as the rate cut cycle has not ended.
Current prices have no technical indicator relevance, and price analysis is becoming less important. The more people buy, the faster the price rises, which will further accelerate the increase in gold prices.
In the short term, the outlook for gold remains bullish. Pay attention to the 15-minute chart for potential pullbacks and look for entry points to go long during the trading session. The support level is between 5150 and 5170. As gold price volatility increases, stop-loss levels should be adjusted accordingly. With the market surging,I will post more strategies in the channel.

Pay attention to short-term resistance. Buy on dips.Gold Technical Analysis: The technical indicators show an upward channel, but short-term overbought conditions warrant caution. The technical chart shows that gold is currently in a clear short-term upward channel. Although it failed to break through the upper rail and fell back, the rapid rebound indicates that the bulls still dominate.
In terms of indicators, the MACD histogram has turned negative and continues to widen, indicating a weakening of short-term momentum; the RSI has reached 70.84, entering the overbought zone and beginning to decline, suggesting that bulls may face consolidation pressure. However, as long as the price stays within the channel, the overall upward trend remains intact. The technical outlook remains generally bullish, but short-term attention should be paid to the volatility risks brought about by the Federal Reserve's decision.
With multiple positive news factors converging, gold prices still have significant upside potential, and the current gold market is experiencing a confluence of favorable factors. Despite the potential for short-term uncertainty from the Federal Reserve's decision, the path of least resistance for gold prices in the medium term remains upward, and the possibility of breaking through $5100 and continuing to rise is increasing.
In summary, the short-term trading strategy for gold today is primarily to short on rallies and buy on dips. The key short-term resistance levels to watch are 5100-5150, and the key short-term support levels are 5020-5050..I will post more strategies in the channel.

Waiting for the adjustment to complete. Continue to push upwardsOn Monday, gold prices gapped higher, opening above $5090, repeatedly breaking through market expectations. The focus now shifts to the Federal Reserve's January interest rate decision. A rate cut is unlikely at this time, given that Powell is embroiled in legal issues and only has three months left in his term. A significant or dramatic rate cut is improbable; the appointment of a new chairman and their policy stance will be key.
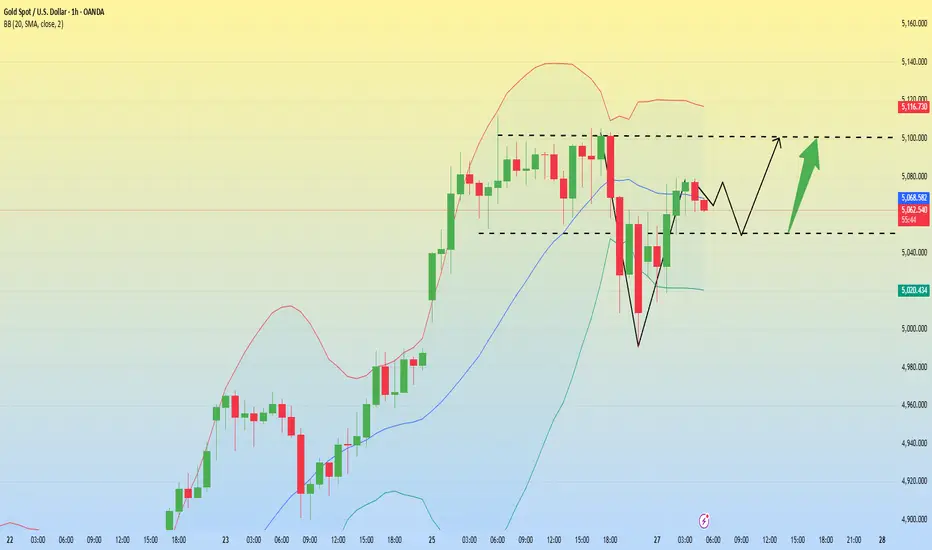
On the 1-hour chart, gold opened higher and continued to rise before entering a consolidation phase. Short-term moving averages are trending upwards, and the correction was relatively limited. After touching the intraday low of $5013 per ounce, the price rebounded quickly, demonstrating strong buying support. The Bollinger Bands are widening, maintaining the characteristics of an upward trend, with the price trading above the middle band, which acts as dynamic support. There is no sign of weakness or a break below the middle band.
In terms of momentum indicators, the MACD indicator shows a continued bullish crossover, although the red energy bars have slightly contracted, reflecting a short-term slowdown in bullish momentum – a rhythmic adjustment within an upward trend, not a sign of momentum exhaustion. The RSI is in the 60-70 range, not yet reaching extreme overbought levels, indicating some technical room for further upward movement. Overall, the upward channel on the 1-hour chart remains intact, and the consolidation is accumulating momentum for the subsequent trend. No obvious bearish volume signals appeared during the pullback.
The technical structure shows high-level consolidation within the $5100 range. In the short term, the direction of gold is still predominantly bullish, and a break above $5090-$5100 would further propel the price upwards.I will post more strategies in the channel.
The trend remains intact. Target price: 5150-5200.Gold prices rose to around 5111 today but encountered resistance and pulled back. It is currently continuing its correction. It is not recommended to chase the rally at the high point, as the bulls have just pulled back and are adjusting, and the technical indicators suggest that the price needs to consolidate below. The overall trend remains bullish; the strategy is to buy on dips and patiently wait for entry opportunities after the pullback.
Based on historical patterns of similar price movements, the theoretical target after this breakout points to the $5300-$5400 area. Gold prices have surged past the psychological level of $5,000 and are now heading towards that target area. Weekly momentum indicators still provide support: the MACD maintains a bullish signal, and while the RSI is high, it hasn't shown extreme exhaustion, indicating continued upward momentum.
The key support level has moved up to the recent breakout zone of $5000-$5040, with the most crucial support located at the breakout point of $4970. As long as the price holds above this area, the trend structure remains intact, and the path of least resistance remains upward.
Short-term strategy recommendation:
Buy at 5050-55, add to position at 5040, stop loss at 5030, target 5100-5120, and after a breakout, watch for 5150-5200.I will post more strategies in the channel.

Breaking through 5100. Aiming for even higher levels.For the past month, gold prices have consistently gapped higher at the open of Asian trading for four consecutive weeks. This time, due to Trump's tariffs on Canada, gold prices broke through the $5000 resistance level after the open, surging towards $5100. Risk aversion is amplified exponentially during a bull market.
Now, observing the 15-minute chart is sufficient for gold. Price fluctuations are becoming increasingly volatile. The volatility of gold hasn't changed, but because the base price has increased, a 3% fluctuation now represents $150. Even slightly positive news can send the price up by $100. Looking back at the high point reached, it has now become the support line for the pullback and a lower point.
The short-term direction for gold prices remains bullish. The support zone is concentrated in the $5030-$5520 range. The key to the rapid rise in Asian trading lies in its continuation during European trading. The $5100 level will likely be broken soon; after the breakout, watch for $5120-$5130.I will post more strategies in the channel.

The upward trend continues. Above 5000.On Friday, the market closed at $4987, after reaching a high of $4990 during the US trading session before consolidating until the close. The market is likely to continue its bullish trend next week, and reaching the 5000 level should be within reach.
Currently, the daily chart continues to show a bullish candlestick pattern with a lower shadow, supported by five consecutive days of gains. In the short term, the market is full of strong upward momentum. This is partly due to geopolitical factors, and partly due to continued buying of gold by major institutions, which keeps the price of gold so firm.
From a technical perspective, the MACD continues to show increasing volume, indicating strong bullish momentum. The Bollinger Bands are widening upwards, and the price is steadily climbing along the upper band. On the 4-hour chart, gold prices are consolidating at high levels, with the Bollinger Bands widening, indicating strong bullish momentum and continued upward potential in the short term. The key resistance level remains at the psychological $5000 mark, which may create some pressure. Short-term traders should be wary of potential pullbacks and patiently wait for entry opportunities after any retracement. The support level below is around 4945-4950.
Trading Strategy:
Buy at $4945-$4950, add to position on a pullback to $4925, stop loss at $4915, target $4990-$5000, hold if the price breaks through.I will post more strategies in the channel.

5000 is just around the corner. Consider buying at 4900.Gold prices have hit a new high once again. It's as easy as breathing air for prices to rise by $100 a day. In just a few minutes, the increase can be tens of dollars. With a 15% increase at the beginning of 2026, we're getting closer to $5,000, and the annual target has become a monthly target. Human greed has reached unprecedented levels, and respect for the market has become meaningless. $4900 was easily breached, leaving the upside potential completely untapped.
Therefore, the upward pressure on gold prices is currently minimal, and support is key for the upward trend. The $4900-$4910 range is the dividing line between bullish and bearish sentiment. However, Friday warrants attention to a potential pullback in US stocks, with a possible sharp drop followed by a sharp rise.
From a moving average perspective, all moving averages maintain a standard bullish alignment, with short-term moving averages consistently above medium- and long-term moving averages and diverging upwards in tandem, demonstrating the stability of the medium-term upward trend and providing strong technical support for further price increases.
In the short term, consider buying near 4900. The strategy remains unchanged until the US session begins, and we need to be wary of potential shifts in market trends.I will post more strategies in the channel.

Gold – Buy around 4900, target 4950-4999Gold Market Analysis:
Looking back at yesterday's market, gold was hovering between 47 and 48, but today it's already starting at 49 – incredibly volatile! We remain bullish on gold today; don't sell. Waiting for a pullback to profit isn't worthwhile. Gold has reached a frenzied level; even reckless buying could wipe out your entire investment. Today is also the weekly close, and barring any major surprises, gold should close positive again on the weekly chart. Technical support has reached 4887, and we can maintain a bullish outlook as long as the price stays above this level. Hourly support has also risen to 4900. I predict the Asian session will be dominated by buying, with any correction or pullback likely occurring during the US session. Also, be wary of the 5000 level; it's a historically significant resistance level and could see a sharp drop. We're not speculating, just being aware. If a sharp drop occurs, never buy in.
Support: 4887, 4900. Resistance is not visible. 4887 is the key level for determining market strength/weakness.
Fundamental Analysis:
The surge in gold prices has been fueled by various speculations about fundamental factors, but these are all in the past. Current fundamentals and geopolitical factors are relatively ordinary, and no major data releases are scheduled for this week.
Trading Recommendation:
Gold – Buy around 4900, target 4950-4999

XAU/USD(20260123) Today's AnalysisMarket News:
According to data released Thursday, U.S. gross domestic product (GDP), an inflation-adjusted measure of the value of goods and services produced, grew at an annualized rate of 4.4% in the third quarter of last year, the fastest pace in two years.
The report shows that this is one of the two strongest consecutive quarters of growth since the U.S. economy was still in the recovery phase of the pandemic in 2021. After rushing to import goods at the beginning of the year to avoid the implementation of President Trump's comprehensive tariffs, businesses slowed their pace of imports. Despite the volatile trade policy, consumer and business spending remained robust.
With strong growth, a more solid job market, and inflation still above the Federal Reserve's target, the Federal Reserve is expected to keep interest rates unchanged at its meeting next week.
Technical Analysis:
Today's Buy/Sell Threshold:
4882
Support and Resistance Levels:
5049
4987
4946
4818
4778
4716
Trading Strategy:
If the price breaks above 4946, consider buying, with a first target price of 4987.
If the price breaks below 4882, consider selling, with a first target price of 4818.

Gold remains strong. A pullback is a buying opportunity.Gold bottomed out and rebounded, maintaining an overall bullish trend. Gold is still in a major bull market. Although the US economic data released during the US trading session was negative for gold, gold did not fall. After a brief fluctuation, it continued its strong upward movement. Gold rose as expected, and the correction is over. Will gold continue to reach new historical highs?
The 1-hour moving average for gold continues to show a bullish upward crossover and bullish arrangement. The bullish momentum in gold remains very strong. Gold rebounded from around 4810 during the US trading session, which also coincided with the moving average support. Therefore, continue to buy on dips above 4810. The bullish trend in gold has not changed; pullbacks are opportunities to buy.
Trading Recommendations:
Buy at 4825, add to position at 4815, stop loss at 4800, target 4880-4900;I will post more strategies in the channel.

Strong support. Continued upward breakout expected.On Wednesday, gold prices surged again, reaching a high of 4889. Subsequently, the price consolidated at a high level, with continued trading around the 4880 mark during the European session. During the US session, a significant pullback occurred, with the price hitting a low of 4754, a drop of 130 points.
The current technical pattern for gold is very clear. The candlestick chart shows a series of large, solid bullish candles, clearly demonstrating the absolute dominance of the bulls. Even with technical pullbacks, the price is quickly pulled back up.
The market clearly shows strong buying support below, and any attempts by bears to push the price down have been effectively countered. With strong buying support, the short sellers have been put on the defensive, and gold prices have maintained a strong one-sided upward trend, constantly hitting new highs. Based on current momentum, gold prices are expected to continue their upward trend before the holiday.
Today, pay close attention to the key support area at 4770. As long as the price remains above this area, the overall bullish outlook remains unchanged, and we can continue to look for opportunities to buy on dips.
Trading Strategy:
Buy at 4770-4780, stop loss at 4760, target 4820-30.I will post more strategies in the channel.

Gold – Buy near 4800, target 4860-4900Gold Market Analysis:
Gold has reached 4849, isn't that incredible? It's surprised the whole world. That's the market for you; it's always right. We're just small followers. We bought in at 4658, 4865, 4721, and 4728, and all positions have yielded profits. Today, it's already starting at 48, so let's look for pullbacks to buy. This kind of market makes those who try to guess the top and intercept sell orders question their existence. Gold rallied again in the Asian session today, and based on this rhythm, a correction is expected in the European and American sessions. Don't try to guess the top or place sell orders during a big rally; following the trend is the key to winning in the end. Gold previously corrected at high levels for three weeks, and the current breakout is basically a weekly upward breakout. Coupled with fundamental support, gold is now like a surging tide that's hard to stop. Hourly support is still at 4766, and daily support is around 4700. If a correction occurs later, the magnitude will be very large. Good timing is crucial.
Resistance is not visible; support levels are at 4766 and 4800. The key level for market strength/weakness is 4766.
Fundamental Analysis:
This week's data is mostly routine and will have little impact on the market. Geopolitical factors also have little influence.
Trading Recommendation:
Gold – Buy near 4800, target 4860-4900.

Very strong upward movement. Follow the trend.In the blink of an eye, gold prices have surged to $4800, a level previously unimaginable. Now, few dare to offer advice, and the biggest risk in the market is missing out on the rally. Gold and silver have gone completely crazy.
Gold and silver are showing strong upward momentum, with the market continuously pushing prices higher. This surge can only have two possible outcomes: either a strong rally to overwhelm short sellers and force a short squeeze, or a sudden reversal after emotions reach their peak. As the base price of gold increases, the daily price fluctuations also become larger, amplifying profits while simultaneously increasing the underlying risks.
With the increasing volatility of gold prices, the monitoring timeframe should be shortened. Focusing on 15-minute and 30-minute charts is sufficient. While larger timeframes (1 hour and above) show price changes of tens of dollars, the focus in shorter timeframes should be on entry points. The strategy should be to observe the larger trend but trade on smaller timeframes, with trend reversals starting from smaller timeframes and propagating to larger ones.
Today, the support zone for gold is within the $4800-$4805 range, followed by the $4790-$4785 range. The key to the strong rally in the early morning is its sustainability. Nobody knows how high it can go, and I don't know either. We can judge by whether the support level is breached or not. There is a vacuum above the resistance level..I will post more strategies in the channel.

XAU/USD(20260121) Today's AnalysisMarket News:
The Polish central bank has approved a plan to purchase 150 tons of gold, increasing its gold reserves to 700 tons.
Technical Analysis:
Today's Buy/Sell Threshold:
4729
Support and Resistance Levels:
4835
4795
4770
4688
4663
4623
Trading Strategy:
Consider buying if the price breaks above 4795, with a first target price of 4835.
Consider selling if the price breaks below 4729, with a first target price of 4688.

Gold – Buy around 4660, target 4680-4699Gold Market Analysis:
Yesterday was Martin Luther King Jr. Day, and most Americans were on holiday, resulting in a slow and steady market consolidation at high levels. The short-term strength was almost unbelievable, but the daily chart still closed positive. Our buy order at 4658 yesterday was profitable, and our Asian session buy order at 4665 also yielded profits. Today, we continue to buy. The moving averages are starting to move upwards, and the divergence level has reached 4625 and 2642, as we mentioned in yesterday's analysis. If it doesn't break 4625 today, we maintain our bullish outlook; if it does, we should consider whether it could be a new major correction or a sharp drop. Gold has been prone to large swings lately, and it likes to fluctuate wildly. Following its rhythm is crucial. The price action above forms a flag pattern, suggesting a higher probability of an upward move after the consolidation phase. The hourly bottom is around 4652, and the 30-day moving average on the hourly chart is starting to rise. Don't chase the price after it broke the new high of 4690 today, as 4700 is a strong resistance level. I predict it will consolidate and fluctuate below this level. These pullbacks during the consolidation phase will present buying opportunities. Focus on the 4652-4699 range during the Asian session.
Support levels are 4652 and 4642, with a slightly stronger level at 4625. Resistance is at 4690-4699. The key level for determining market strength is 4652.
Fundamental Analysis:
Recent geopolitical news seems to have calmed down considerably, and the market hasn't fallen as a result. Pay close attention to the Federal Reserve's new monetary policy.
Trading Recommendation:
Gold – Buy around 4660, target 4680-4699.

XAU/USD(20260120) Today's AnalysisMarket News:
According to sources who spoke to CNBC on Monday, Federal Reserve Chairman Jerome Powell plans to appear before the U.S. Supreme Court on Wednesday for oral arguments. The case centers on whether President Trump has the authority to remove Federal Reserve Governor Lisa Cook from her post.
Powell's planned appearance comes as he faces a criminal investigation by the U.S. Attorney's Office for the District of Columbia for his involvement in a multi-billion dollar renovation project at the Federal Reserve headquarters and related congressional testimony. The Associated Press first reported Powell's plans.
It is extremely rare for a Federal Reserve chairman to personally appear for oral arguments in such a case. However, the question of whether a president can remove a Federal Reserve governor in the manner Trump has attempted is considered within the Fed to be a potentially fundamental issue concerning the central bank's survival.
Technical Analysis:
Today's Buy/Sell Threshold:
4662
Support and Resistance Levels:
4730
4705
4688
4635
4618
4593
Trading Strategy:
If the price breaks above 4688, consider buying, with a first target price of 4705.
If the price breaks below 4662, consider selling, with a first target price of 4635.

Strong upward trend. Buy after the gap at 4640 is filled.Gold opened higher in Asian trading on Monday, breaking through the resistance level of 4640. The 4640 area has now become a new support level after a top-to-bottom reversal. The bullish momentum is strong, and gold is expected to reach a new historical high.
With the US stock market closed today, attention should be focused on the European trading session. If there is a technical correction, we will monitor the repair of the 4640 gap.
From the current market perspective, the key resistance level to watch is 4700, while the first support level is 4640, followed by 4615.
The 1-hour chart shows that last Friday, during the "Black Friday" trading session, gold fell to $4530, a drop of nearly $100. After touching the low point, it rebounded quickly and reached a new high in early Asian trading, a gain of $200 from last Friday's low.
Currently, the key points for a potential pullback are the top-to-bottom reversal and the gap created by the higher opening in Asian trading, with 4640 and 4615 dollars serving as the dividing line between bulls and bears. As long as the price remains above the support levels, the bullish trend will continue. On Monday, it is recommended to buy at the support levels of 4640 and 4620 dollars.I will post more strategies in the channel.

XAU/USD(20260119) Today's AnalysisMarket News:
President Trump vowed last Saturday to impose a series of escalating tariffs on EU member states Denmark, Sweden, France, Germany, the Netherlands, and Finland, as well as the UK and Norway, until the US is authorized to purchase Greenland. On March 17th, Trump announced on social media that a 10% tariff would be imposed on goods imported from Denmark, Norway, Sweden, France, Germany, the UK, the Netherlands, and Finland starting February 1st, and declared that the tariff rate would increase to 25% from June 1st, until an agreement is reached on the US's "full and complete purchase of Greenland."
Technical Analysis:
Today's Buy/Sell Threshold:
4584
Support and Resistance Levels:
4667
4636
4616
4552
4532
4501
Trading Strategy:
A break above 4636 suggests a buy entry, with a first target price of 4667.
A break below 4584 suggests a sell entry, with a first target price of 4552.

The trend is flat. Buying opportunities exist around 4570.Gold has been fluctuating at recent highs, with geopolitical developments driving short-term volatility. Gold prices plunged to around 4,536 on Friday, mainly due to the easing of tensions in Iran, which reduced demand for safe-haven assets.
From a technical perspective, the daily chart shows a spinning top bearish candlestick with a long lower shadow, indicating strong buying support below. After rising to $4,642, gold prices entered a technical correction and are currently fluctuating mainly between $4,580 and $4,640. The short-term moving average system on the 4-hour chart is converging, clearly indicating a volatile trading pattern with both bulls and bears vying for dominance. Overall, the consolidation after the surge is beneficial for market development and helps to build momentum for future trends. It is worth noting that the recent low of 4580 has been tested six times, forming strong support.
Overall, gold remains in an uptrend. The key technical level is $4,570. If this level is not broken, gold prices will find it difficult to open up further downside potential and are likely to continue to build momentum for an upward attack. A break below this level could trigger a correction towards $4520 or even lower. Strategically, as long as the key support level remains unbroken, a strategy of buying on dips is recommended.
Strategy Recommendation: Buy at 4575-4585, stop loss at 4560, target 4620-4630.I will post more strategies in the channel.

Black Friday. Consider buying at 4570 points.Gold experienced another rollercoaster ride during the US trading session, with a dramatic shift in market trends occurring in just 15 minutes. The price of gold plummeted by $83 from 4620, reaching a low of around 4537. Currently, the price has rebounded after hitting the low point and is encountering minor resistance at 4600.
The price rebound was halted at the 4615-4620 resistance zone, after which momentum faded, leading to a further decline. The technical analysis predictions closely matched the market's movement.
Currently, the market is showing a V-shaped bottoming and rebound trend. With the price rising to around 4600, the bullish trend remains intact. In the short term, focus on the important level of 4570; as long as the price remains above 4570, there is still upward momentum and potential. The market is always cyclical, alternating between trending and consolidating phases. The current correction is accumulating energy for the next trend.
Strategy Suggestion:
Buy on a pullback to 4570, with a stop-loss at 4560, and a target of 4610-15. Hold the position if the price breaks through this level.I will post more strategies in the channel.

Friday. Waiting for a breakout from the range.The recent market trend has been volatile, with no further breakthroughs in the upside and no significant pullbacks in the downside. The price action has been largely consolidating within the 4570-4640 range, indicating a relatively tense market. However, judging from the daily closing prices, gold is still biased towards the bulls overall, as the current high-level consolidation suggests that the bears have not been able to suppress the upward movement of the bulls.
Today is Friday, and whether it will be a "Black Friday" remains to be seen, but Fridays often see significant price changes. The key now is that the range will eventually be broken, and the direction of the breakout and the subsequent trading strategy are crucial.
Within this range, I personally still tend to be bullish based on the lows, since the trend structure remains intact. Even if there is a decline today, a sustained deep drop is unlikely, and the bearish momentum will be limited. For medium-to-long-term positions, a sharp decline would actually be a better buying opportunity.
Key levels:
The low point of 4580-4570 still serves as support for long positions; a stabilization above this level could lead to a rise towards 4640-4650. If 4570 is broken, the next support levels to watch are 4540-4510. Pay attention to the strength of the rebound after touching these levels, especially 4510, which has strong support. In any case, maintain your pace and patiently wait for the market to give a clear signal.I will post more strategies in the channel.
