Don’t fight the market, act when the time is right!Driven by rising expectations of a Federal Reserve rate cut and a weakening US dollar, gold prices continued to climb this week, reaching a historic high of $3,700 on Tuesday. Market expectations are that the Fed will announce a 25 basis point rate cut in its upcoming meeting. If Chairman Powell further emphasizes concerns about the job market and confirms a path of three rate cuts this year in a subsequent press conference, gold prices are expected to gain renewed upward momentum.
From a technical perspective, the hourly chart shows solid support in the 3665-3660 range. If gold prices hold this level before the European session, it will provide a strong defensive foundation for bulls and can also be considered a useful reference area for short-term long positions. Once the price re-establishes itself at the 3700 level, it is expected to further challenge the 3710-3720 resistance level. A breakout with strong volume could open up further upside potential, continuing the bullish trend.
Prior to the Federal Reserve's interest rate decision, the market is likely to remain volatile at high levels, accumulating momentum for major news releases. We recommend primarily buying on dips. The current bull-bear watershed is 3650; if this level falls, be wary of the risk of a further correction.
Goldpreis

The trend after 3700 mark is more worth looking forward to!Gold has been hitting new highs recently. Yesterday, it broke through the previous high of 3674 in the US market and surged towards 3685. Despite a brief pullback in early trading, it surged back to 3698 in the European session and even broke through 3703 in the US market, maintaining a clear bullish trend. The current pullback is a normal technical correction and has little impact on the overall uptrend, but instead builds momentum for a subsequent surge. The key support level at 3670 is currently under consideration. This level has become a short-term dividing line between bulls and bears. A break below this level will clearly indicate a bullish advantage, but a potential decline should be viewed with caution. Above this, focus on the 3705 level. A break above this level could test the 3710-3720 area, and a strong breakout could open up further upside potential. Trading strategies should include a light short position near 3705 to capture profits on pullbacks, waiting for a pullback to the 3685-3675 area to stabilize before entering a long position. The bullish trend continues to target the 3700-3705 area. The overall strategy remains to prioritize buying on dips, with a secondary focus on selling on higher levels.

The opportunity is right in front of you, don’t miss it!Yesterday, the technical analysis of gold showed a rapid downward retreat in the Asian session, breaking through the 3630 mark and stabilizing and rebounding. It fluctuated and consolidated around the 3630 mark in the European and US sessions, and finally ushered in a strong rise by bulls. The price of gold accelerated to break through and stand above the 3670 mark to set a new historical high. The gold bulls rose as expected, and there are still new highs above, so we are patiently waiting for gold to continue to rise. When it falls back, we will continue to look for opportunities to enter the market and go long. Yesterday, we responded flexibly around the key points, and made precise arrangements with two-way thinking to achieve a double kill of long and short, a steady harvest, and perfectly reach our goals. Today we continue to wait for further declines. After all, all indicators are bullish. Don’t guess the top if the bulls are strong. If the Federal Reserve’s interest rate decision is on Thursday, then the line around 3700 will also be within reach. At present, don’t blindly chase the longs above the 3680 line. If your current trading is not ideal, I hope I can help you avoid investment pitfalls. Welcome to communicate with us!
From the 4-hour analysis, the support below is around 3670-3360. If it pulls back to this position, the main bullish trend will remain unchanged. The short-term bullish strong dividing line is 3650. As long as the daily closing level does not fall below this position, any pullback is an opportunity to go long, and the main tone of participating in the trend will remain unchanged. I will provide you with the specific operation strategies at the bottom, please pay attention to them in time.
Gold operation strategy: Go long when gold falls back to around 3675-3360, target 3690-3695. If it breaks, look at the 3700 line.

Will gold continue to rise?Brothers, we've been buying gold all the way up from 3350 to 3697. While our take-profit points aren't ideal, the general direction is correct, ensuring we won't be crushed by the market. Trend is king; go with the flow. When you trade with the trend, it feels effortless; when you fight it, everything turns messy.
I know full well that when gold was surging, many of you didn’t dare to chase the rally. There were also friends stuck in losing positions, fixated on articles that called for shorting, while pieces advocating going long were ignored. But here’s a key point: the market won’t change because of your personal emotions.
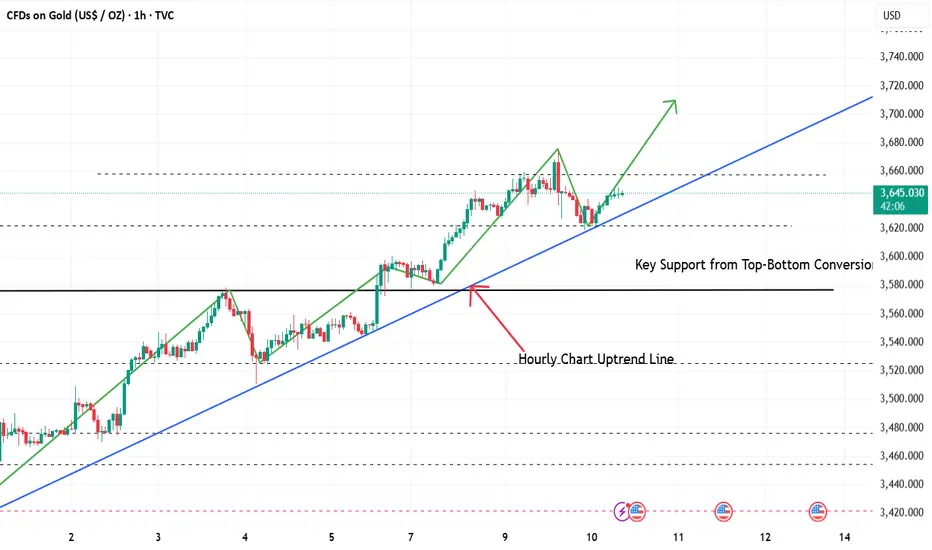
After days of consecutive consolidation, gold has held firm above the strong support at $3,600. A powerful bull market only requires courage and conviction. The prerequisite for a trend reversal is the breakdown of a key top-bottom conversion level.
The hourly moving average has formed a golden cross and bullish formation, further expanding the upside potential for gold. Gold continues to hit new highs and higher lows, clearly maintaining a bullish trend. However, as the Federal Reserve's monetary policy announcement draws closer, while considering the possibility of "buying in anticipation and selling in reality," and in order to control risk, everyone should exercise caution when chasing high prices. There is no obvious pressure from the top, and we need to pay attention to the recent top and bottom conversion position of 3658-3662. Before falling below this position, the market will remain strong.
Which comes first, 3600 or 3700?International gold prices continued to fluctuate within a narrow range, hovering around the 3640 level. The range continued to narrow, and market sentiment clearly became more cautious. This phenomenon is due to investors entering a cautious wait-and-see phase regarding the upcoming Federal Reserve interest rate decision, which has weakened trading appetite and led to low price volatility.
From the 1-hour candlestick chart, gold prices are currently under pressure from a short-term downward trend line, with 3650 becoming the core bull-bear dividing line for today's market. If prices remain below 3650, short-term range-bound consolidation is likely, and caution is advised regarding the risk of a subsequent test of support. If prices break through and stabilize at 3650, it will indicate that short-term resistance has been broken, bullish momentum is expected to be re-released, and the market may resume its strong upward trend, heading towards the previous highs of 3656-3660.
Regarding downward support, the primary focus is on the lower band of the ascending channel. If this fails, strong support will focus on the 3600 mark. This level is not only a key support level that has been repeatedly tested previously, but also a crucial defensive line for the bullish trend on the daily chart. A break below this level would trigger a periodic correction.
Considering the high market uncertainty before the Fed’s interest rate decision is implemented, the recommended operating strategy is to focus on short-term trading: whether going long or short, positions must be strictly controlled to avoid large losses due to sudden fluctuations in news. The core principle is to “quit while you are ahead.”

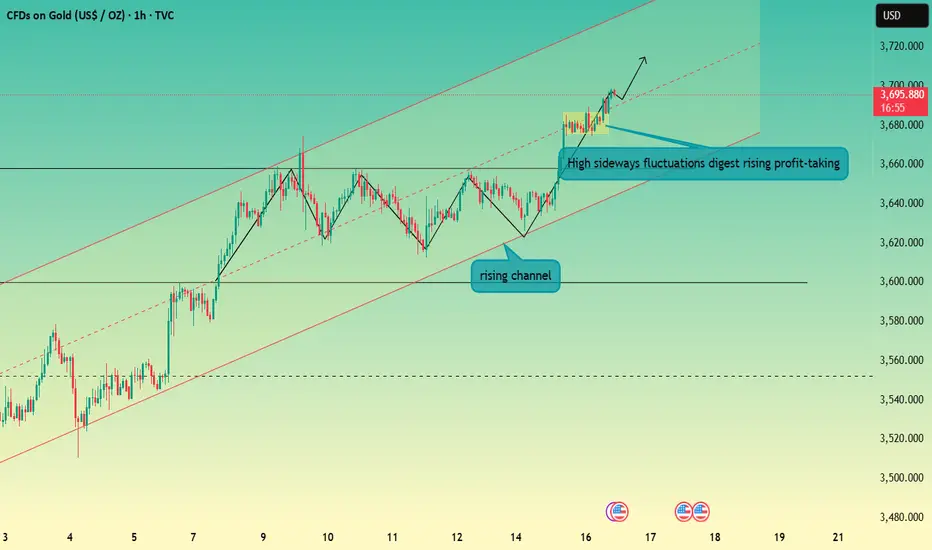
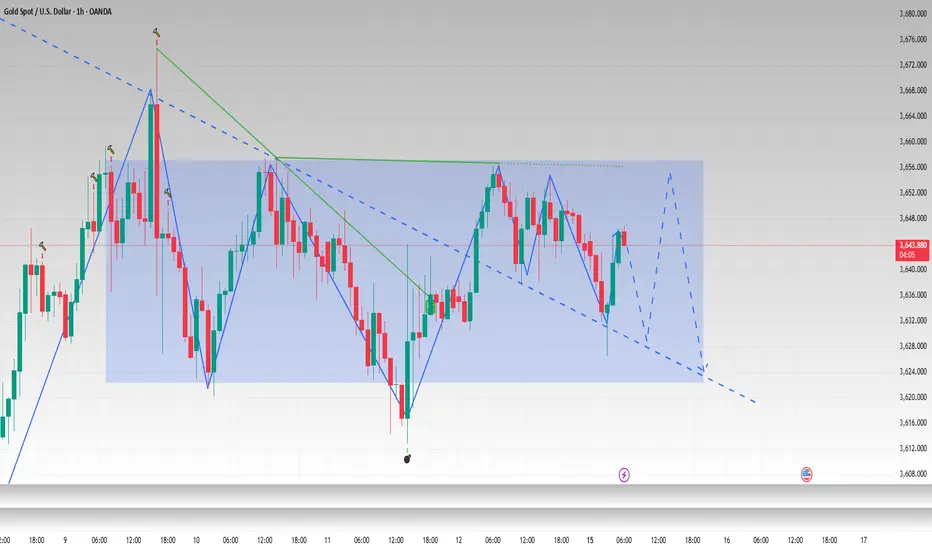
Gold continues to fluctuate before the US interest rate decisionGold, after last Friday's continuation of the previous day's bottoming out and rebound, continued to fall into a range-bound oscillation mode, and after opening today, it continued to retreat to around 3626 before rising. Although there is no breakthrough between the bulls and bears at present, it is still in a tug-of-war, and the support below will also be maintained near the low point of 3626. This position is also the first watershed related to whether gold can continue to fall in the later period. The key pressure above is maintained near the previous secondary high point of 3655. This position is also the key suppression point for the recent retracement after multiple touches. It is also the shoulder position of the head and shoulders top, which also plays a role. It plays a connecting role, and once this position continues to suppress, gold may be under pressure again in the later period. If it does not break through again this week, gold may retreat again next week to test the support level of 3610. Although the daily line is still in a high sideways trend, the upward momentum has also declined significantly. If it bottoms out and rebounds, it needs a secondary definition of the European session, which is also an advance forecast of the US session. If gold rebounds to 3645-3655 during the day, short it and target around 3630-20. The strength of the European session may also determine the direction of the US session.

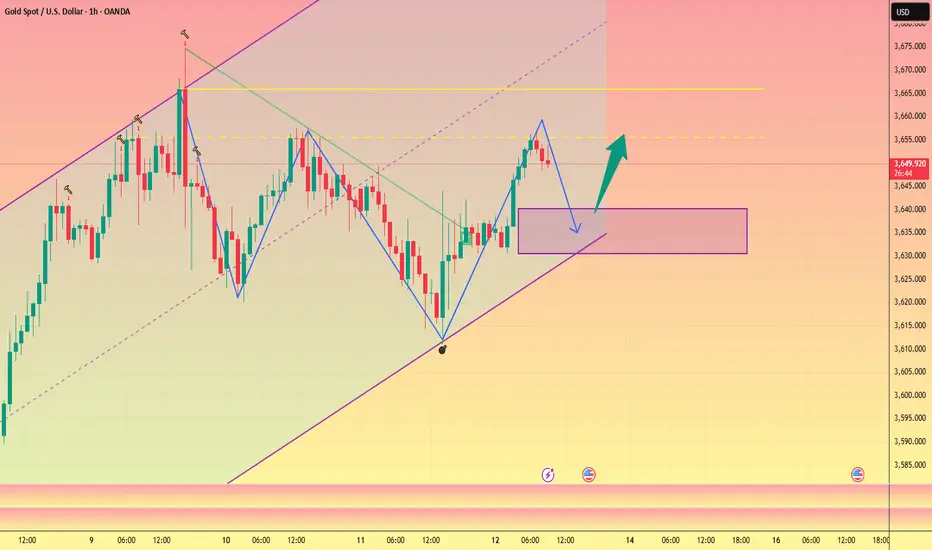
The support is not broken,continue to go long when it falls backThe overall gold price is currently fluctuating and consolidating at a high level. Although gold has a slight correction in the Asian session this morning, it has not fallen out of the upward channel.
The market focus is still on the Federal Reserve's interest rate cut. In addition to this news, the fourth US-China meeting in Spain today is also worthy of our attention. If the two sides can reach a good negotiation on the tariff issue this time, then gold may fall. Otherwise, the price of gold will continue to rise.
Currently, gold has rebounded again and is consolidating around 3645. The short-term pressure from 3655-3665 is still there. If it fails to effectively break through this resistance area, then gold still has room for a short-term correction. Pay attention to the short-term support of 3635-3625 below. If the support is not broken, you can still consider going long on gold.
Can gold break through the resistance level?Whether you go long or short, you can make money, the only exception is the greedy. To invest, you must block excitement, or at least don't get excited at the wrong time. Emotions play a key role in all transactions. Spend all your time studying trends, never go against the trends, learn to follow, and then you can learn the essence. There is no invincible general in the financial market, and a person cannot make money beyond the scope of cognition. Investing itself is an assessment of self-cognition.
After gold fell to 3626, it rebounded slightly. It is still in a state of volatility as a whole, and the volatility is narrowing. From a technical point of view, the bullish momentum has not been exhausted, and the sideways movement of the gold market at this stage is far from over. From a big cycle perspective, 3675 is not a high point. However, as the interest rate decision approaches, both bulls and bears may turn to wait and see, and the short-term market is expected to be dominated by fluctuations, waiting for the Fed's monetary policy guidance! The upper resistance level is the pressure level formed by the two recent high points, and the support is at the lower track of the rising channel and the strong support of 3600.

Can gold continue to rise next week?With the right direction, the journey is not a problem. Time will prove your strength, and strength will win the future. Let trust become profit. The market is ever-changing, and following the trend is the best path. When the trend emerges, act accordingly; don't buy against the tide.
Gold had a relatively perfect week. After a slight pullback on Friday, it rose again. It found resistance around 3656-60 before oscillating and stalling. This level serves as a bridge between the past and the future. Next week's interest rate decision will be a key focus, and both market news and technical indicators are bullish for gold. Let's wait and see. If your current trading is not ideal, I hope I can help you avoid mistakes.
From the 4-hour analysis, the support below is 3628-30, and the short-term bullish strong dividing line is 3600. If the daily level stabilizes above this position, it can continue to maintain the rhythm of pulling back to low and buying in line with the bullish trend. The main strategy is to buy on dips.
I will remind you of the specific operation strategy during the trading session, so please pay attention to it in time.

XAU/USD technical analysis Read The captionSMC Trading point update
Technical of Gold (XAU/USD) using the 4H timeframe. Let’s break down the idea behind it:
---
Key Technical Insights:
1. H4 FVG (Fair Value Gap) Zone:
The yellow box (~3602 zone) is marked as an imbalance area (FVG) where price is likely to retrace.
Market structure suggests that price may dip into this zone to fill the imbalance before continuing upward.
2. Price Pattern (Consolidation / Pennant):
Current price action shows a triangle/pennant-like consolidation after a strong bullish move.
This usually indicates continuation, but first, liquidity grabs may occur.
3. Liquidity Grab (Liquidity $$$):
The chart notes a liquidity sweep above resistance (~3659).
This suggests that price could fake out higher first, then drop to fill the FVG zone before resuming the bullish move.
4. Target Points:
Short-term downside target: 3602.487 (H4 FVG support).
Upside target 1: 3659.154 (liquidity area).
Upside target 2: 3699.778 (main bullish target).
5. RSI (Relative Strength Index):
Currently around 57–60, showing moderate bullish momentum but not overbought.
Supports the idea of a retracement before continuation.
---
Trade Idea Summary:
Bias: Bullish (after retracement)
Scenario:
1. Price may first grab liquidity (fake-out up) or directly retrace down.
2. Dip into the 3602 FVG zone.
3. Strong bounce expected → rally toward 3659 and 3699 targets.
Entry Idea: Look for long entries near 3602–3610 zone (confirmation with bullish candle patterns preferred).
Targets:
TP1: 3659
TP2: 3699
Stop-Loss: Below the FVG zone (~3580).
Mr SMC Trading point
---
Conclusion:
This is a bullish continuation setup where Gold could correct down into the H4 FVG zone before resuming its larger uptrend. The plan focuses on buying dips rather than chasing highs.
---
Please support boost 🚀 this analysis

Can gold reach new highs?Gold is currently in a critical phase of long-short confrontation, with key focus on the resistance zone of 3,656-3,658 on the upside. This range is not only a periodic resistance formed after the previous price rally, but also a core verification point for the sustainability of short-term bullish momentum. From a technical perspective, only when the gold price breaks above and holds the 3,656-3,658 range effectively can the bullish trend reactivate its strong momentum, thereby continuing to challenge the previous high of 3,674. If the price remains constrained by this resistance before breaking through 3,656-3,658, the market will most likely maintain a range-bound consolidation pattern, with prices possibly fluctuating repeatedly at current high levels while awaiting guidance from the Federal Reserve next week.
From a short-term perspective, gold generally presents a "consolidation with bullish bias" trend. Although the low points fluctuate, there is no obvious downward shift, and the price can quickly recover part of the lost ground after each pullback—this indicates that there is still support from buying interest below. Based on this, the evening trading strategy will center on "building long positions on pullbacks".

3655 accurately shorted gold to seize the opportunity of declineGold fluctuated higher today, rising from 3630 all the way to 3657. However, after encountering resistance at this level during the European session, it ultimately retreated. The overall trend remains consistent with our previous analysis and strategy. Today's strategy is to short on rebounds around 3655, watching for pullbacks. The current low has been around 3637, resulting in a small short-term gain of approximately 150 pips. Congratulations to those who followed this strategy for a solid win! For those who are short-term traders, it's recommended to lock in profits or lower your stop-loss to avoid profit taking. For those holding medium-term positions, manage your positions appropriately and patiently await the next wave of opportunities. Following the trend and executing your plan are the keys to stable profits in the market.

Wait for new highs and go long on pullbacksA good day starts with profits, now let's analyze the trend of gold today.📊
Gold is currently consolidating around 3650, with 3655-3665 forming short-term resistance above. The 4H MACD indicator is correcting a top divergence. Having first touched this resistance level in the European session, gold may experience a pullback. 📉As the price of gold continues to rise, the short-term support also moves up. Pay attention to the short-term support area formed by 3640-3630. 🌈If gold retraces support and then rebounds above this resistance level, it could first reach 3675, or even reach a new high of 3690-3700, as we anticipated yesterday.🚀
Intraday operations are mainly long at low levels, supplemented by short at high levels, and participate in trading in key ranges.
Stay bullish, stick to the direction.Gold prices did not continue to rise but instead fluctuated at high levels. Such fluctuations do not mean a short-term peak; only a drop back below $3,600 would warrant considering short-term short positions. The high-level consolidation on the 1-hour chart has not broken down, and after such a substantial rally, a minor short-term pullback is perfectly normal—there's no need for excessive concern. What's more important is to grasp the overall trend; pullbacks are just opportunities to get on board at a better price.
The market is currently focused on next week's Federal Reserve interest rate decision, which will be the real game-changing news. Therefore, holding the $3,600 level is crucial. As long as this level remains unbroken, the bullish momentum will continue to stay strong.
I will closely track and analyze the market daily. If you're losing direction in this kind of market, feel free to follow me or leave me a message.

A brief discussion on my views on recent gold price trendsLast night, I clearly outlined my outlook for gold. Today, the gold price retreated to the support range of 3635-3620 and then stabilized and rebounded. Our long orders have reaped considerable profits. It is a pity that the limit long order set at 3620 before going to bed failed to be triggered, and I missed out on a bigger profit.
Currently, gold's volatility is relatively low, and it has rebounded again to around 3645, which aligns with my view that gold will remain in a range-bound pattern in the short term. Our trading strategy is still highly referenceable. If gold falls back to test the lower support again in the short term, we can still consider going long again. If gold slowly fluctuates upward in the European session, the first thing to pay attention to is whether it can effectively break through 3655. Once it effectively breaks through, gold may retest the short-term resistance of 3665-3680.

Pullback for accumulation; bullish momentum remains promising.Gold broke upward against the resistance of the trendline, rising to a high of around 3,658. As indicated in the morning analysis, we have advised everyone to take partial profits first on positions entered below the 3,600 level to lock in gains. From the 1-hour candlestick chart, gold has consistently maintained a "gradual upward movement amid consolidation" rhythm, with lower lows continuing to move higher, and the stability of the trend structure is remarkable.
During a one-sided upward trend, the market's response to data is biased: bullish news will be amplified, while bearish news will be overlooked. One should not rely excessively on data for trading; more seasoned traders understand the logic behind the data and the current market environment.
For subsequent moves, when the price retraces to the hourly support level, those who have already taken profits can continue to follow up with long positions. We will closely track and analyze the market daily. If you lose your direction in such a market, you are welcome to follow us and leave a message for communication to obtain more targeted analysis and trading advice.

XAU/USD) Bullish trend analysis Read The captionSMC Trading point update
Technical analysis of Gold (XAU/USD) 1H analysis:
---
Technical Breakdown
1. Ascending Channel
Price is trending higher within a clear ascending channel, respecting both support and resistance trendlines.
The bullish structure remains intact as long as price holds above channel support.
2. Demand Zones (Yellow Boxes)
Price respected a Fair Value Gap (FVG) demand zone around $3,600 – $3,620, leading to bullish continuation.
Another demand area around $3,640 acted as a recent support after a market structure shift (MSS).
3. Market Structure
A bullish MSS confirms upside momentum.
Higher highs and higher lows support the ongoing bullish trend.
4. RSI (14)
RSI at 59.46, leaning bullish but not yet overbought — leaving room for continuation to the upside.
5. Target Point
Projection points towards $3,689 as the next target, aligning with channel resistance and Fibonacci extensions.
Mr SMC Trading point
---
Summary Idea
Gold is trading strongly within an ascending bullish channel, bouncing off demand zones and maintaining upward structure. As long as price holds above $3,640, the bias remains bullish with a target at $3,689.
---
please support boost 🚀 this analysis

A pullback with a pause, yet the uptrend remains unchanged.The higher the gold price climbs, the more hesitant people become to take action. Those who sold gold early or waited for a lower entry point have completely missed out on this rally—some regret buying too little, some regret not buying at all, and even more regret exiting at a loss.
The market works this way: it can never satisfy everyone. When it’s in consolidation, people long for a one-sided trend; when a one-sided trend arrives, they want to wait for a correction. Life is much the same—things rarely go smoothly at every turn.
In an uptrend, a sharp drop is hard to sustain. Only when the secondary rebound fails to hit a new high and the subsequent pullback breaks below the previous low can the market shift into consolidation. Right now, $3,618 has become the key long-short dividing line.
Currently, the market is edging higher along the hourly support level. Personally, I still hold a bullish view overall, but today’s momentum is noticeably weaker than before. Therefore, I will consider taking partial profits around the $3,658 level.
I will closely track and analyze the market every day. If you lose your direction amid such market moves, you can follow me or leave me a message.
Detailed Analysis of Gold (XAU/USD)Gold recently tested record highs around $3675, but prices are showing corrections as traders must have started booking profits from the extreme high level.
On the 4H chart, the price action remains within an ascending channel, suggesting that the broader trend still carries mild bullish momentum.
After touching the lower trendline of the channel, gold is showing signs of stabilization, but upside momentum is weakening.
The immediate support lies between $3636 (Fib 0.236 level) and $3620 (middle Bollinger Band) — a breakdown below this zone could trigger further correction toward $3612–$3593 (Fib 0.382–0.5 levels).
On the upside, if gold holds above the channel support, recovery toward $3675 highs cannot be ruled out, though momentum indicators suggest caution.
Overall: Gold is still in a short-term bullish structure but vulnerable to deeper pullbacks if the key $3636–3620 zone breaks.

Is gold at its peak?Gold has staged a "buy the rumor, sell the fact" move. The U.S. nonfarm payrolls data was bullish for gold, yet gold plummeted after the data release. There’s no need for confusion—it’s not as you might think, that bullish data means the price rises and bearish data means it falls. If it were that simple, everyone would be making money.
Data and fundamentals are reflected in prices, but such reflections can be ahead of time, lagging, exceeding expectations, or falling short of expectations. Judging which scenario it is depends solely on the historical database one has accumulated and long-term real-trading experience.
Today, I added to my gold positions twice and am still holding them. Even if the price falls further, my profits won’t decrease. This is because I believe today’s decline is most likely a result of some profit-taking traders closing their positions on the opportunity—after all, there have been no major bearish factors in the fundamentals yet. Whether a daily-level correction will occur still requires further observation. After all, since the rally started on August 20, there has been no real daily-level correction except for the sharp intraday pullback on September 4, and a correction would actually make the trend healthier.
The period from now to next week is a critical short-term window for gold. I will closely track and analyze the market every day. If you lose your direction in such a market, you can follow me or leave me a message.

GOLD– Market Outlook
🔼 Bullish Scenario:
• If the price holds above 3635, the upward momentum is expected to continue.
• Target: 3675 (main resistance level).
• If 3675 breaks, the price may rise further and enter the bullish zone.
🔽 Bearish Scenario:
• If the price stabilizes below the retracement level, a temporary correction may start.
• Target: 3595 (strong support).
• If the price breaks below 3595 and closes under it (especially on the 1h or 4h timeframe):
→ The next bearish target will be 3546.
⚠️ However, if 3595 holds and is not broken, the price will likely bounce and resume the bullish trend.
⸻

In a bull market, stick to the long position to the endThe biggest challenge in a one-sided trend lies in courage—the courage to enter the market, the courage to not fear high prices, and the resolve to stop guessing the top. No one can predict how high the price will go. The key to determining long or short positions lies in the starting point of the rally and whether the last top-bottom conversion level has been broken. Trend is king; go with the trend. In a bull market, short-term pullbacks do not disrupt the bullish trend. However, since gold is currently at a high level, it is essential to set up risk protection measures every time before looking for further upside. This will help avoid being caught holding positions at the peak during the final phase of the gold bull market. There’s no need to predict the top in a rally—gold is still in a major bull market, and we’ll keep the gold bullish trade going all the way.
From the perspective of the 1-hour trend structure, the overall market movement is extremely sound, including the top-bottom conversion levels and the early-morning rally starting points. While identifying the trend direction may seem simple, this logic is highly effective in a one-sided market. As long as we hold onto the key levels and maintain the bullish outlook unchanged, any pullback is an opportunity to enter the market. For those who haven’t entered yet—this has been emphasized many times—you can go long with a small position around the 3640-3642 range today. For those who entered the market with me earlier, simply hold onto your positions.
If you feel confused about the future market trend, or if you have not yet made profits in such a market, follow me and leave me a message – let me help you resolve this issue.

Never predict the top; go long with the trendThe bullish momentum for gold is unstoppable, with basically no significant pullbacks. Therefore, gold will only continue to stay strong for now. It is basically impossible to wait for a major pullback in gold at the moment—if a sharp pullback starts, it will no longer be a correction. The current market follows the rule: "A strong trend sees no correction; a correction means no strength."
The 1-hour moving averages of gold remain in a bullish divergence pattern with a golden cross trending upward. After breaking above the 3,600 level, gold has continued to move higher. Now that it has broken through and held above 3,600, this level will become a key support for gold in the short term. In such a strong market, gold usually resumes its strength after a pullback of around 20 US dollars. Those who haven’t entered the market can go long on dips around 3,620 in line with the trend. Those who already hold positions can just keep holding.
A real trending market won’t end so soon. Gold is now in a major bull market cycle—there’s no need to predict the top during a rally. Following the trend means going long; we’ll keep the gold bullish trade going all the way.
If you feel confused about the future market trend, or if you have not yet made profits in such a market, follow me and leave me a message – let me help you resolve this issue.
