Buy gold around 4105, target 4160-4199Gold Market :
Analysis: Yesterday, we maintained our buying stance on gold, placing buy orders at 4047, 4073, and 4078. Today, we will continue to place buy orders. Gold has broken through the previous daily chart's correction high and started a new major rebound. The strength and magnitude of this rebound are very significant. Do not try to catch it; those who sold yesterday are mostly at a loss. Trying to guess the top makes it very difficult to capture the absolute highest point. The daily chart closed with a strong bullish candle with no upper or lower shadow. Today's buying will continue to push the price higher. Where is the top? Such a strong upward trend has no clear top. We need to follow it, even if it means risking everything to buy. The area around 4046 on the daily chart is already the bottom of the daily consolidation range. Even if there is a pullback later, it's unlikely to break through this level again. Pullbacks are our buying opportunities.
Gold prices rose sharply in the Asian session, presenting buying opportunities on minor dips. Waiting for strong support is unlikely; hourly support is around 4105. The key level to avoid in the Asian session is 4161. A break below this level could lead to further upward movement on the daily chart. I anticipate a period of consolidation around this level. I expect a rise in the Asian session followed by consolidation in the US session.
Support: 4105 and 4075; Resistance: 4161; Key level for market strength/weakness: 4105.
Fundamental Analysis:
Recent comments from Federal Reserve officials signaled continued interest rate cuts, suggesting a continuation of rapid easing policies, which should support further upward movement in gold.
Trading Recommendation:
Buy gold around 4105, target 4160-4199.
Goldpreis

XAU/USD) Bullish trend analysis Read The captionSMC Trading point update
technical analysis of Gold (XAU/USD) on the 4-hour timeframe. Let’s break down the technical analysis presented:
Overall Idea
The analysis suggests that Gold is likely to continue its upward movement after a possible short-term retracement. The chart projects a move toward the target point at 4,160.549.
---
Key Technical Elements
1. Break of Structure / Trendline Break
A descending trendline (black) has been broken to the upside, signaling a potential trend reversal from bearish to bullish.
The breakout candle is strong and supported by volume, confirming bullish momentum.
2. Fair Value Gap (FVG) Zone
A Fair Value Gap (blue box) has been marked where price may retrace to fill imbalance before continuing higher.
This FVG area also aligns with the previous resistance turned support, adding confluence for a bullish continuation.
3. Exponential Moving Averages (EMAs)
EMA 50 (blue): 4,016.295
EMA 200 (black): 3,965.661
Price has crossed above both EMAs, indicating a strong bullish trend shift.
A bullish EMA crossover may be forming, further confirming upward bias.
4. Projection Path
After a short retracement into the FVG zone, the expected price structure shows:
A bounce upward forming higher highs.
The final target zone is projected at 4,160.549, where a potential take-profit level lies.
---
Target and Confirmation
Target Point: 4,160.549
Retracement Zone (Buy Area): Within the blue FVG zone (around 4,060–4,080 range).
Confirmation: Watch for a bullish reaction (e.g., bullish engulfing or rejection wicks) within the FVG zone before entry.
---
Risk Considerations
If price closes below the FVG or drops back under 4,016 (50 EMA), it could invalidate the bullish continuation setup.
Fundamental catalysts like U.S. Dollar strength or economic data releases could cause volatility and affect momentum.
Mr SMC Trading point
---
Summary:
This analysis outlines a bullish continuation setup on Gold, expecting a pullback into the FVG for liquidity collection before resuming upward momentum toward 4,160.549.
Please support boost 🚀 this analysis

XAU/USD) Bullish trend analysis Read The captionSMC Trading point update
Technical analysis of Gold (XAU/USD) on the 4H timeframe, following Smart Money Concepts (SMC) and structural confluence trading. Let’s break down the full reasoning behind this setup
---
Overall Concept
The chart suggests that Gold is preparing for a bullish breakout after a successful retest of the trendline and demand zone, signaling potential institutional accumulation before a push toward the target level at 4,080.231.
---
Technical Breakdown
1. Market Structure
Price recently broke above a descending trendline, signaling a potential change of character (ChoCH) from bearish to bullish structure.
The higher lows and multiple rejections from the blue demand zone confirm buyer interest.
The small arrow and upward projection illustrate an expected retracement and continuation pattern (impulse → correction → new impulse).
2. Key Levels
Current Price: 4,001.275
50 EMA: 4,003.110 → Price is now testing and starting to close above this level, showing renewed bullish strength.
200 EMA: 3,960.048 → Dynamic support confirming mid-term bullish bias.
Demand Zone (blue area): Around 3,985–3,995 — key zone for re-entries and confirmation of buyer defense.
Target Point: 4,080.231 (aligned with a liquidity zone or prior imbalance area).
3. Confluences
EMA Cross: Price pushing above both 50 and 200 EMA — often a signal of trend reversal strength.
Trendline Retest: The green arrow indicates a successful retest of broken resistance turned support.
Bullish Structure: Higher highs and higher lows forming above the EMAs.
Volume: 101K+ — healthy momentum supporting institutional buy continuation.
4. Expected Scenario
1. Short-term retracement into the blue demand zone or along the ascending trendline.
2. Bullish reaction (engulfing candle or rejection wick).
3. Continuation move toward the 4,080 target zone.
---
Trade Idea Summary
Aspect Detail
Bias Bullish
Entry Zone 3,985 – 3,995 (demand + trendline confluence)
Stop Loss Below 3,960 (under EMA200 and previous swing low)
Take Profit 4,080
Risk-to-Reward (RR) ≈ 1:3 or better
Mr SMC Trading point
---
Confirmation to Watch
Bullish candle close above 4,005 (EMA50)
Rejection from the blue demand zone
Break of short-term high around 4,015 confirming continuation
---
Summary
Gold appears ready for a trend continuation following accumulation above major EMAs and a clean retest of structure. The next impulsive move is projected toward 4,080, aligning with prior liquidity and smart money target areas.
please support boost 🚀 this analysis

Gold – Buy around 3985, target 4020-4060Gold Market Analysis:
Gold saw a strong upward surge yesterday, with prices consistently rising and even reaching 4000. However, it dipped back to 3965 during the US session, which is typical of the market. We placed buy orders at 3990 and 4004 yesterday and profited. Today, we expect a consolidation phase with opportunities for both buying and selling. The NFP employment data is anticipated to push gold out of this consolidation. Yesterday's daily chart showed a doji candlestick, and today's resistance level is yesterday's high. A break above this level could lead to further gains. Recent daily price action has been volatile, with several consecutive days of consolidation. The current movement is a significant correction after a sharp drop. The long-term trend for gold still depends on the weekly chart signals, and the current weekly top signal remains intact.
Today, pay attention to the 3956 and 3965 levels. A break below these levels would warrant a bearish shift in strategy. The current trading range is 3965-3940. During the Asian session, consider buying on dips. Yesterday's US session saw a pullback, and buying in initiated a new upward move. Resistance is around 4003 and 4020. The US session includes NFP data; before the data release, continue the strategy of buying on dips within the range, aiming for a rebound.
Support: 3965 and 3956, minor support: 3983, resistance: 4003 and 4020. The key level for market strength/weakness is 4000.
Fundamental Analysis:
Today's NFP employment data will change market expectations for the Fed's monetary policy, but in the long term, the possibility of further interest rate cuts is greater.
Trading Recommendation:
Gold – Buy around 3985, target 4020-4060.

Latest gold price trend analysis today!Market News:
On Friday (November 7th) in early Asian trading, spot gold traded sideways, currently hovering around $3990 per ounce. Yesterday, spot gold prices experienced extremely volatile fluctuations, with a daily range of $55. Weak US employment data initially spurred a surge in London gold prices, but international gold prices failed to hold onto their significant gains, partly due to profit-taking by investors, ultimately closing essentially flat.
The protracted US government shutdown, the legal battle over the legality of tariffs, the stark contrast in the labor market, and the growing expectation of a Fed rate cut all provided structural support for gold, but could not withstand the immediate impact of the US stock market crash. This led traders to seek safe haven in cash, instantly shattering gold's luster.
With the shutdown potentially taking a turn for the better and the Supreme Court's tariff ruling settling, gold's safe-haven narrative may be revived. If the Fed cuts rates as expected in December, gold could end the year with a strong rally. Traders should remain vigilant, closely monitoring the developments in private economic data, speeches by Federal Reserve officials, news regarding the US government shutdown, and international geopolitical developments.
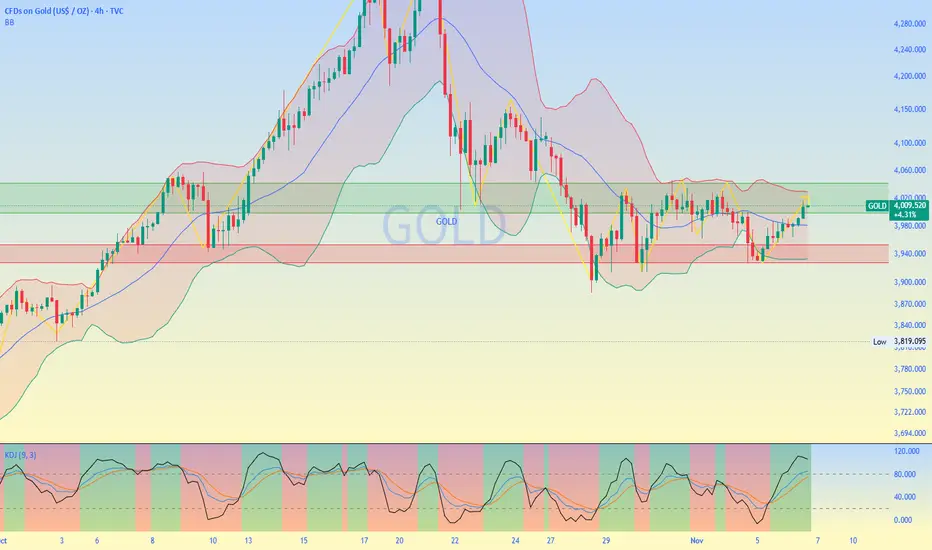
Technical Analysis:
Gold has been trading within a range for eight consecutive trading days. The daily chart shows the 10-day and 7-day moving averages flattening, and the RSI indicator adjusting towards the midline. On the 4-hour chart, the Bollinger Bands are narrowing, with the price consolidating around the middle band. Currently, short-term moving averages are turning downwards, and the MACD indicator is showing a death cross signal, but it's getting closer to the zero line, so a continued consolidation is possible. The large-cycle consolidation range on the daily chart is locked at 4050-3900. Without breaking out of this range, a trend is unlikely to form. Currently, a break above 4050 is not considered strong, and a break below 3900 is not considered extremely weak; both buying and selling lack sustained momentum. We have consistently emphasized that gold is currently in a consolidation phase. Don't assume a major surge or reversal is imminent just because there's a rebound. It's still in a consolidation phase, and the overall center of gravity is still shifting downwards! The main trading strategy is to sell high and buy low!
Gold Intraday Trading Strategy:
Buy gold at 3960-3965, stop loss at 3950, target 4010-4030;
Sell gold at 4035-4040, stop loss at 4050, target 3980-3960;
Key Levels:
First Support: 3963, Second Support: 3952, Third Support: 3936
First Resistance: 3996, Second Resistance: 4010, Third Resistance: 4028

XAU/USD) Bullish trend analysis Read The captionSMC Trading point update
Technical analysis of Gold (XAU/USD) — expecting a retracement into a demand/Fibonacci zone before a continuation to the upside toward the target at 4,030.68.
Here’s the detailed breakdown
---
Overall Idea
The analysis suggests a pullback-entry buy scenario, where Gold is expected to retrace to a key Fibonacci confluence + trendline support zone, then resume the uptrend toward 4,030.
This setup fits the Smart Money Concept (SMC) and market structure shift logic — from bearish to bullish.
---
Key Components
1. Market Structure Shift
Price broke above the descending trendline, signaling a potential bullish reversal.
The pullback is seen as a retest of the breakout zone, which often becomes a new support area.
The overall expectation is for a higher-low formation, leading to continuation upward.
2. Fibonacci Retracement Zone
The 0.5–0.79 retracement area (highlighted blue box) is the ideal buy zone.
Price is expected to tap into this area before continuing higher.
The 0.705 Fibonacci level aligns with the previous structure and EMAs, adding confluence.
3. EMA Confluence
50 EMA (3,986.37) and 200 EMA (4,007.71) are key dynamic levels.
Price is retesting around the 50 EMA, which supports the idea of a bullish continuation if respected.
Once price breaks above the 200 EMA, momentum confirmation strengthens.
4. Projected Path
The expected pattern:
➤ Pullback into 0.62–0.79 zone →
➤ Formation of a higher low →
➤ Impulsive move toward 4,030.68 target point.
The projected move aligns with structure and Fibonacci extension.
Mr SMC Trading point
---
Summary
Market bias: Bullish
Setup type: Retracement buy / Trend continuation
Entry zone: 3,975–3,985 (Fibonacci 0.62–0.79 area)
Target point: 4,030.68
Confirmation: Bullish rejection from zone or structure break above 4,000
Invalidation: Break below 3,960 (previous swing low)
---
pelas support boost 🚀 this analysis

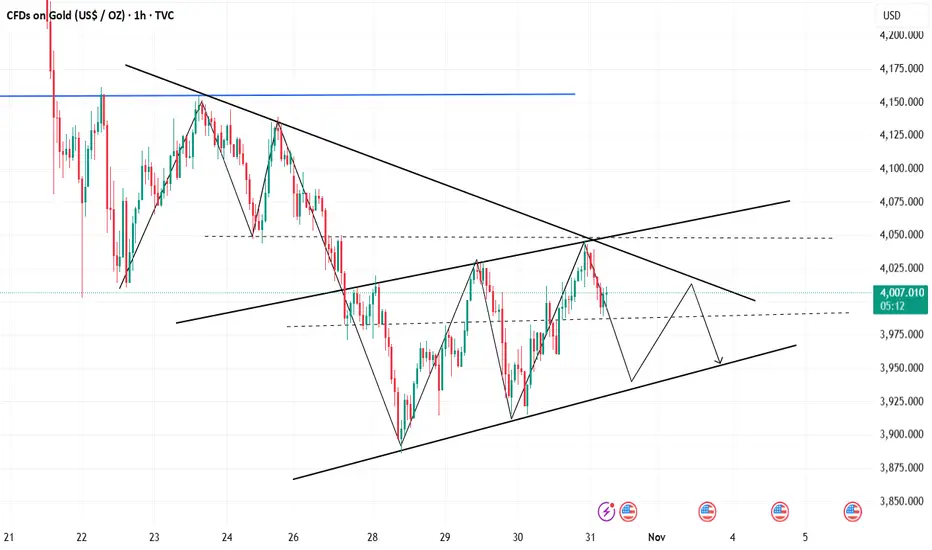
XAU/USD) Bullish trend analysis Read The captionSMC Trading point update
Technical analysis of Gold (XAU/USD) on the 1-hour timeframe, with a clean structure suggesting continuation toward the 200 EMA. Here's the idea summary:
---
Analysis Idea: Bullish Continuation Setup
1. Structure Overview:
Price is currently trading above the ascending trendline, showing a short-term bullish bias.
The 50 EMA (3,974.93) has recently been retested and held as support.
The 200 EMA (4,011.37) acts as the next resistance / target point.
2. Setup Logic:
After a breakout above the 50 EMA, price is forming a retest zone (highlighted box).
A bullish reaction from this zone aligns with the trendline confluence and EMA support.
This suggests buyers may step in again to push price higher.
3. Entry & Target:
Entry Zone: Near 3,974–3,978 (trendline + EMA confluence area).
Target: 4,011 (200 EMA / key resistance).
Stop Loss: Below 3,965 (below the trendline and retest box).
4. Market Psychology:
Recent candles show higher lows and strong bullish momentum after rejection from previous lows.
Break and retest of dynamic resistance (50 EMA) supports bullish continuation.
Mr SMC Trading point
---
Trade Idea Summary:
Bias Entry Zone Stop Loss Target Confirmation
Bullish 3,974–3,978 <3,965 4,011 Bounce from trendline or bullish candle pattern
---
Pelas support boost 🚀 this analysis

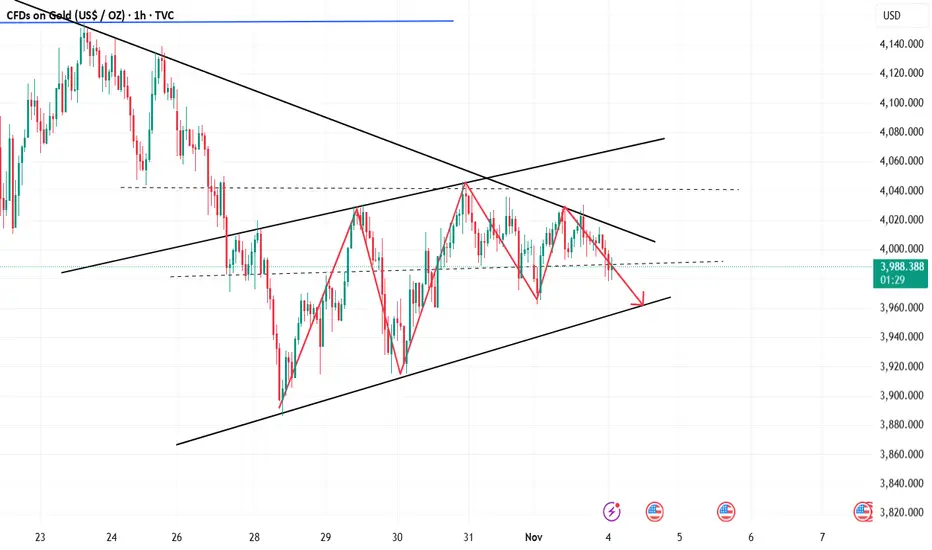
Gold Analysis and Trading StrategiesGold is currently in a range-bound market, failing to break through the 4000 level. The overall trend remains range-bound, with bulls struggling to gain traction. The market is expected to continue its sideways movement, but without a sustained break above 4000, gold will likely remain in a weak, range-bound market.
The 1-hour moving averages for gold are still in a bearish crossover pattern. After a period of consolidation within a triangle pattern, gold broke down on the 1-hour chart, and any rebounds are currently facing downward pressure. The 3990-4000 area remains a significant resistance zone.
Gold opened this morning around 3981, rallied to 3984, and then quickly plummeted to 3968. Based on the volatility, bears still have the upper hand, and market information suggests there is potential for further downward movement.
Today, I will still primarily focus on shorting, but there's one thing to note: the market's bull trap isn't over yet. Therefore, I won't be looking for the perfect shorting entry point. Instead, I'll be tentatively shorting in batches, for example, in the 3980-3985 area. If it climbs further, I'll wait for the 3990-3994 area, and then in batches in the 4000-4010-4020 area. Please don't blindly follow my advice. After all, we dare to operate this way with profits as a foundation. Without profits, blindly holding short positions may be counterproductive, and if there's an unexpected surge, the damage could be significant. Please be mindful of this.
If you don't have a gold trading plan or strategy and are struggling to achieve consistent profits, you can follow my updates. If you have any questions, feel free to message me privately.

Gold Important Trading Range SignalsGold Technical Analysis: Gold bulls broke out upwards first, and gold is now oscillating within a range of $4030-$3920. In the short term, this range-bound movement is expected to continue. This week's non-farm payroll data will determine whether a breakout occurs and a one-sided trend emerges. However, if the non-farm payroll data fails to break through key short-term support and resistance levels, the oscillation will likely continue, and this time, it is expected to last for a considerable period.
Short-term Data Impact: The non-farm payroll data fuels expectations of a December rate cut by the Federal Reserve. Other factors include easing trade tensions and the US government shutdown. Therefore, the probability of gold experiencing a significant surge in the short term is low. Even if it breaks through the rebound high of 4046, the upside potential is expected to be limited.
Gold – Buy around 3960, target 3980-4000Gold Market Analysis:
Gold rebounded sharply yesterday after touching 3930. The expected rebound followed by a further decline didn't materialize; instead, it underwent a significant correction and consolidation at higher levels. The daily candlestick pattern closed positive again, indicating significant buying and selling pressure due to the alternating bullish and bearish candles. Finding the right rhythm during short-term consolidation is crucial. Today's strategy for gold is to maintain a bearish overall trend while expecting short-term consolidation, with opportunities for both buying and selling. The 5-day and 10-day moving averages are about to cross, potentially indicating a direction today. Note the upcoming Non-Farm Payrolls (NFP) data; a large one-sided trend is unlikely. We anticipate needing the NFP to provide direction. Our target direction is a breakout from the short-term consolidation. Today, focus on the 3990 level during the Asian session; a break above this level would trigger a new buying opportunity, forming a large V-shaped pattern on the 4-hour chart. For the Asian session, look for two buying opportunities: a slight dip to the 3965-3960 area, and a pullback after breaking 3990. Gold's consolidation will likely be volatile; chasing the market today requires confirmation of signals to avoid losses. Our strategy for gold remains to follow the trend and trade based on understanding the market.
Support levels are 3965 and 3956, with strong support at 3930. Resistance is at 3990, with strong resistance at 4020. The key level for market strength/weakness is 3990.
Fundamental Analysis:
Yesterday's ADP employment data was -2.9, with an expected 2.8, but the result was 4.8. The positive data is bearish for gold, but gold only saw a small rebound, so the reaction was not significant .
Trading Recommendation:
Gold – Buy around 3960, target 3980-4000.

XAU/USD(20251106) Today's AnalysisMarket News:
US ADP employment rose by 42,000 in October, the largest increase since July 2025, exceeding market expectations of 28,000. The US ISM non-manufacturing PMI for October came in at 52.4, a new high since February 2025.
Technical Analysis:
Today's Buy/Sell Threshold:
3955
Support and Resistance Levels:
4031
4003
3984
3926
3907
3879
Trading Strategy:
A break above 3955 suggests a buy entry, with a first target price of 3984.
A break below 3926 suggests a sell entry, with a first target price of 3907.

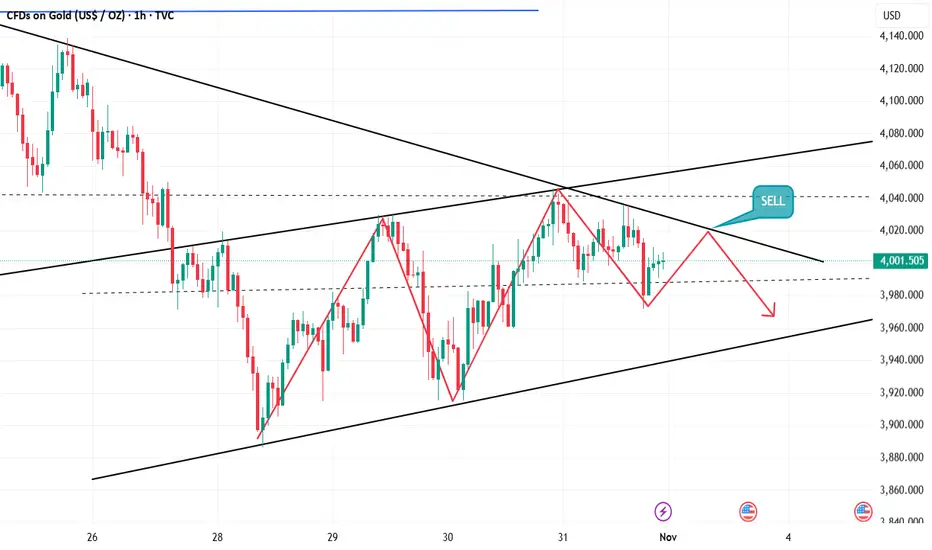
XAU/USD) Bearish trend analysis Read The captionSMC Trading point update
Technical analysis of XAU/USD (Gold Spot) – Bearish Continuation Setup
Timeframe: 1H (Capital.com)
Concepts: Smart Money Concepts (SMC), Trendline Break, FVG & EMA Confluence
---
Market Structure Overview
The uptrend structure was recently broken, confirming a shift to bearish order flow.
Price has broken the ascending trendline, retested near the FVG / premium retracement zone, and is rejecting from the supply area.
The structure and EMAs both support further downside continuation.
---
Key Technical Elements
Retracement Zone (Short Entry Area):
0.5 – 0.79 Fibonacci levels align with the Fair Value Gap (FVG), showing potential for bearish mitigation.
Price currently trading near 0.62–0.705 level (premium zone).
EMA Confluence:
EMA-50 ≈ 3,992
EMA-200 ≈ 4,024
Both EMAs are above price, acting as dynamic resistance.
Trendline Break:
The ascending trendline has been decisively broken and retested, indicating trend reversal confirmation.
---
Targets
Immediate Target (0-level structure): 3,940 zone
Extended Bearish Target: 3,796 — marked as the final target point on the chart
---
Scenario Plan
1. Expect minor retracement to the FVG zone (3,990–4,010).
2. Watch for bearish confirmation (rejection or lower-timeframe BOS).
3. Target downside continuation to 3,796, completing the swing projection.
Mr SMC Trading point
---
Bias:
> Bearish – Market showing structure shift, EMA confluence, and FVG rejection setup aligning toward deeper downside movement.
---
please support boost 🚀 this analysis

Gold – Technical Outlook🔴 Bearish Scenario (Downtrend)
Pivot Level: 4000
If price trades below 4000, continuation to the downside is expected.
🎯 First target: 3930 (support zone)
If 3930 breaks → full bearish extension towards:
🎯 Next targets: 3895 – 3865
🟢 Bullish Scenario (Uptrend)
If price breaks and holds above 4000, upside momentum will strengthen.
🎯 First target: 4030 (resistance zone)
If 4030 breaks and holds on the 1H or 4H timeframe → strong bullish continuation towards:
🎯 Next targets: 4081 – 4133

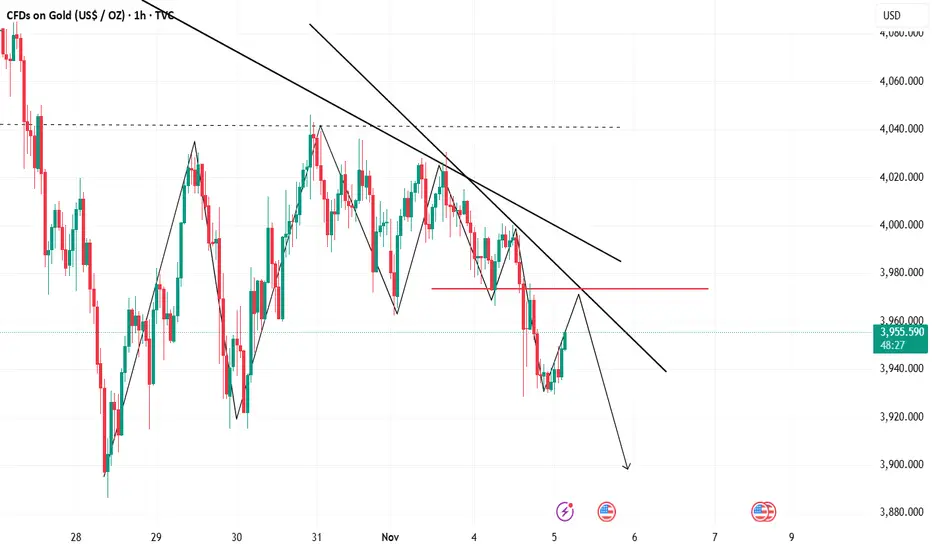
Gold's break below support was expected; continue shorting.Gold traded sideways yesterday, repeatedly encountering resistance around the $4000 level. After a failed attempt to break through in the final wave of trading last night, it experienced a sharp drop, consistent with our bearish forecast.
The breakdown is normal; after all, a break above $3960 inevitably leads to a faster decline. Last night, it ultimately fell to around $3928, breaking the recent consolidation range. Short-term pressure suggests further downside. There is some support around $3930, but I believe this level will be difficult to hold today. Gold prices may test $3915 or even $3900.
On the 4-hour chart, upward momentum in gold is lacking. The overnight high provided resistance around $3975, while the $3962 level was the point of accelerated decline after the breakdown. Currently, bulls are under significant pressure. Unlike the previous consecutive gains, this week has been characterized by weak consolidation with an overall downward bias. The bulls currently lack strength, and the short-term trend remains bearish.
The key levels to watch are 3960-62, which was the resistance level encountered during the first round of rebound, and 3975-77, the high point of yesterday's rebound, which is also the starting point of the decline.
Today's Trading Strategy:
The 3900 area is a key defense zone for the bulls. Gold prices previously rebounded from this area, reaching a high of around $4045. Will gold prices find support again and rebound this time? I think it's unlikely. The bulls encountered strong resistance during the rebound and ultimately broke through this area, indicating that the gold price trend is weakening. We should follow the trend and focus on selling on rallies, only considering going long after gold prices break below 3900.
Aggressive traders can establish short positions around $3960-$3962; conservative traders can establish short positions in the $3970-$3975 range.
If you don't have a plan or strategy for gold trading and are struggling to achieve consistent profits, you can refer to and follow my updates for guidance and help you avoid mistakes.
Gold - Sell around 3966, target 3940-3900Gold Market Analysis:
Our strategy for gold yesterday was bearish, and the market followed our expectations. We placed four short orders: selling at 3981, 3999, 3945, and 3958. The rhythm of gold trading is crucial. Even if you're certain of the direction, you need to find its rhythm, because now even a small rebound can be as high as 30 points. Yesterday, gold plummeted to around 3928, closing with a large bearish candle on the daily chart. Today, the Asian session saw another rebound, but the daily chart pattern suggests an initial rebound followed by further declines. The daily target is a break below 3900. Based on the current indicators, gold still has significant downside potential. The daily moving averages are starting to decline, so we're not considering bottom-fishing for now. Continue selling today; following the trend is the only way to profit in the long run.
Today, pay attention to two levels: 3966, a resistance level based on chart patterns and the first resistance level in the Asian session; and 3975, the high of yesterday's US session rebound. Additionally, the daily moving averages are around 3985, indicating that all resistance is shifting downwards. Selling today could lead to new lows.
Support levels are 3928 and 3945, resistance levels are 3966 and 3975. The key level for market strength/weakness is 3966.
Fundamental Analysis:
Today, focus on the ADP employment data, a leading indicator for non-farm payrolls. Also, pay attention to the new crude oil inventory data.
Trading Recommendation:
Gold - Sell around 3966, target 3940-3900.

Latest gold price trend analysis today!Market News;
On Wednesday (November 5th) in early Asian trading, spot gold fluctuated narrowly, currently trading at $3940 per ounce. Yesterday, international gold prices plummeted by nearly 2%. Increased internal disagreement among Federal Reserve officials and a cooling of market expectations for a December rate cut by the Fed helped the US dollar index break through the 100 mark, rising to a three-month high. This made gold relatively expensive for investors holding other currencies. In the short term, selling pressure slightly favored gold, and the price faces further downside risk.
The US government shutdown has lasted for 35 days, and the Labor Department's monthly employment report is definitely not due on Friday. Investors can only pin their hopes on Wednesday's ADP national employment report. In addition, the Treasury will also announce its quarterly refinancing plan on Wednesday. If the massive bond issuance pushes up long-term yields, the pressure on gold will be further exacerbated.
In the short term, the ADP report will be a crucial turning point in determining the fate of gold prices—a weaker-than-expected report will lead to selling to cover losses, while a stronger-than-expected report will lead to further selling pressure. However, looking at the long term, the global central bank gold-buying momentum remains strong, geopolitical risks in the Middle East are surging, and inflation remains sticky. Therefore, gold's strategic value as the ultimate safe-haven asset remains unshaken.
Technical Analysis:
Gold's rebound this week was capped by a break below the week's low. We have repeatedly emphasized that the strategy of selling on rallies remains unchanged. Those who follow us can see that the selling trend in gold has not changed for the time being. We can enter selling positions when rallies encounter resistance. The daily chart for gold closed with another bearish candlestick. The latest 10-day and 7-day moving averages have moved downwards to 4000/3967, and the RSI indicator is below the 50 level. On the short-term 4-hour and hourly charts, gold is trading in the lower half of the Bollinger Bands. The moving averages have formed a death cross at the 4000 level and are trending downwards. The RSI indicator is below the midline, indicating a bearish bias and a downward correction in gold. The trading strategy is to sell on rallies and buy on dips. From the 4-hour chart, the current focus is on the short-term resistance level around 4000, a key resistance zone that failed to hold after multiple rebounds on Tuesday. Therefore, the strength or weakness of the market hinges on whether this level is breached. However, it's too early to say the market is extremely weak, as it has been fluctuating within a range recently, currently exhibiting weak consolidation. Use 4000 as resistance; place sell orders on rallies below this level. Further action will be taken if the level breaks down.
Gold Intraday Trading Strategy:
Short-term buy gold at 3885-3890, stop loss at 3875, target 3950-3980;
Short-term sell gold at 3985-3990, stop loss at 4000, target 3930-3900;
Key Levels:
First Support: 3923, Second Support: 3900, Third Support: 3882
First Resistance: 3953, Second Resistance: 3986, Third Resistance: 4005

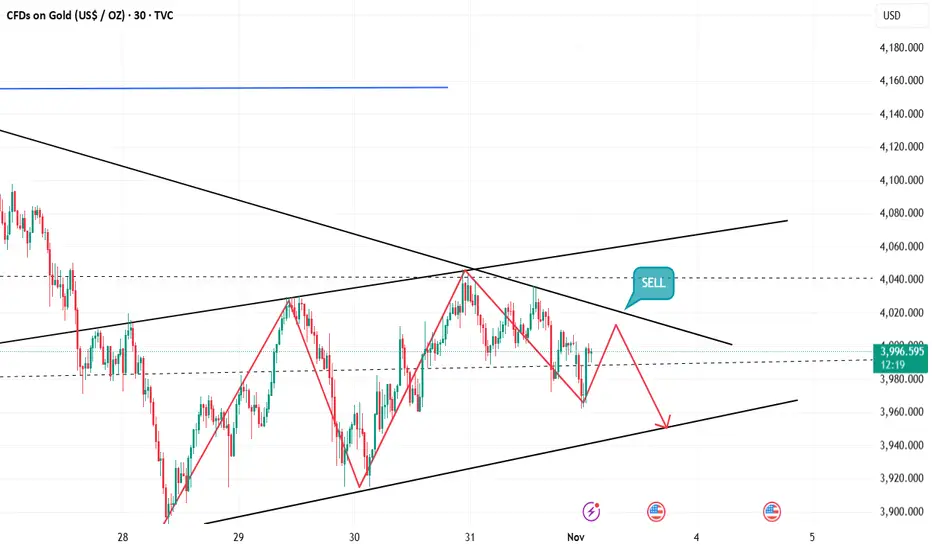
Gold faces key resistance at 4030; continue shorting on rallies.Gold is currently in a consolidation phase, moving back and forth, constantly pulling and tugging. This has been the typical gold price action for a considerable period after major price movements, so it's important to get used to this rhythm. Don't assume a significant surge is imminent just because the price rises; this is currently just a corrective rebound. The overnight short position at 4020 yielded the expected profit. The article explicitly advised shorting, and gold ultimately fell as predicted. Continue to short on any rebounds during the Asian session.
Gold is still consolidating on the 1-hour chart, without a clear directional breakout. Current rebounds present opportunities to short. Multiple attempts to break through resistance levels haven't resulted in a significant upward breakout, indicating insufficient bullish momentum and a generally bearish bias. The 4030 level is a key resistance point. Until a strong, one-sided trend emerges, shorting at the trendline resistance is advisable. Only a break above 4050 could bring a bullish resurgence.
Gold's consolidation without breaking below 3960 suggests a possible trap for long positions. If this continues, a further collapse in gold prices is quite possible. Traders need to be adaptable to these situations. In terms of trading strategy, it is recommended to open a short position at 4000. If there is a strong upward movement, pay further attention to 4020-4030 to continue shorting. On the downside, focus on the 3930-3900 range.
Above 4000, continue to be bullish on gold.#XAUUSD OANDA:XAUUSD TVC:GOLD
Gold prices fell after opening lower in Asian trading today, but rebounded after touching the key support zone of 3960-3950 and then entered a narrow range of fluctuation. Judging from the current trend, gold is still in an upward channel, and the price is still stabilizing above the daily MA5. Therefore, as long as it does not break below the daily MA5 of 3985, we can continue to maintain a bullish view.
Observing the 1H and 4H charts, we can see that the moving average support is basically maintained in the 4010-4000 range. If the gold price retraces to this range in the short term, we can consider going long on gold. Meanwhile, the first resistance level to watch is 4035-4045, which is both the rebound high point that gold prices repeatedly tested last Friday and the location of the daily MA10 moving average. Only by breaking through and stabilizing above this level will gold prices further test the upper resistance of 4050, or even higher.

You can short gold after it fills the gap.Gold opened lower at the start of the week, having closed near 4002 on Friday, but opened at 3983, falling as low as 3962, a drop of nearly $40. Currently, the market is range-bound with no clear trend in either direction. Trading should focus on buying low and selling high based on support and resistance levels, rather than chasing the market. The overall market is still oscillating within the 3850-4150 range. The 3880 area, which has been tested twice without a breakthrough, has become a key support level for the decline.
Gold opened lower and filled the gap. Short-term selling pressure is warranted, as bullish momentum is weak and further weakness is possible in the short term. The overall market remains in a large range-bound pattern. The short-term bullish movement is merely a rebound and has failed to drive a significant upward trend. The market opened lower this morning following weekend news and continued to decline. After filling the gap this morning, the bears may continue to exert pressure. Short positions can be considered on rallies to 4005-4015.
Gold Analysis! Trading Strategy for Next WeekWith just over ten hours until the gold market opens, I'll briefly review last week's market performance and outline my strategy for next week.
On Friday, gold rose to 4046 in the Asian session before encountering resistance and falling back. After retracing to 3990, it tested the trendline resistance level again, before falling back again in the US session, resulting in significant volatility throughout the day.
As mentioned on Friday, the volatile market offers opportunities for both bulls and bears. The key lies in the entry point. If the Asian session rises, the European session retraces and breaks the low, and the US session surges, it's a bull trap. Once the high point appears, go short. We followed this approach and achieved good results.
Gold continues to fluctuate, and next week will be crucial for whether the gold bulls can regain their footing. If gold continues its strong performance on Monday, it is likely that the rebound will continue, but it will be a rebound, and the daily chart of gold will then begin a long period of adjustment.
The gold market will continue to face numerous uncertainties, and the battle between bulls and bears is expected to continue. From a news perspective, a series of important economic data will be released next week, such as the US non-farm payrolls and PMI data. The performance of these data will directly affect market expectations for the US economic outlook, and thus influence gold price movements. In addition, speeches by Federal Reserve officials and developments in the geopolitical situation also require close attention.
Next week, the initial resistance level for gold is expected to be in the $4050-$4070 range. This area represents the previous rebound high and the location of the 5-week moving average, making it a relatively strong resistance level. If gold prices can break through this resistance level, they may further challenge the resistance near $4100. The key support level is at $3950, which is the starting point of this week's rebound and the lower Bollinger Band support on the daily chart. A break below this level could lead to a further decline to around $3900 for support.
Next week's trading plan will be launched soon. If you have any trading questions, please feel free to contact me.
How to trade gold stably as the weekly and monthly charts close?#XAUUSD TVC:GOLD OANDA:XAUUSD
As we expected, gold broke through the previous strong resistance at 4030 and continued its bullish trend, reaching a high of 4046, very close to our target of 4050. Although the price of gold retreated somewhat after the brief surge, from the daily chart, the short-term price of gold is still above the MA5 moving average, while from the 4-hour chart, the middle band coincides with the MA20. Therefore, I don't think this means the bulls have given up; on the contrary, it's more like a way to better accumulate momentum at the bottom. This strategy remains effective, and we can still consider going long on gold when the price retraces to the 3985-3975 range.

Range trading, opportunities exist for both bulls and bearsGold prices fluctuated throughout yesterday, breaking through the intraday high in the evening and reaching near the previous high again, ultimately closing positive on the daily chart, essentially at the highest price. During the Asian session, prices rose another $30, touching around 4046, before slightly retreating. Judging from the recent trend of gold prices, the price has been fluctuating and neither the bulls nor the bears have been able to sustain their gains. Gold prices have once again reached high levels. After several rounds of fluctuations of 150 points each, the current support and resistance levels are quite clear. Gold prices are oscillating between 3900 and 4050.
This adjustment and reshuffling is a good thing. It gives those who missed the boat a chance to get on board, and it also slaps those who chased the highs in the face. The game between bulls and bears is itself an extension of the consensus of emotions.
Gold prices extended their rebound, returning to $4,050. This rebound was significant, recovering from a drop of about $500 to a gain of approximately $200. Whether this rebound represents a reversal depends on the weekly closing price. If the weekly candlestick closes as a doji, it indicates that the bulls remain strong. If the weekly candlestick continues to close negative, short-term consolidation and profit-taking will continue.
In volatile markets, both bulls and bears have opportunities; the key lies in the price level. If the Asian session rises, the European session retraces and breaks the low, and the US session surges, it's a bull trap. Once the high point appears, go short. Trading strategy: Sell gold on a rebound to 4015-4020, with a stop loss above 4045 USD, and target 3980-3960 USD on the downside. Watch for further downside targets at $3980-$3960.
Gold's downward trend shows no signs of stopping sell on ralliesGold prices priced in the Fed's rate cut expectations yesterday, and quickly retreated after the data release. The bullish momentum was short-lived. After gold prices broke through $4000, almost everyone in the market believed a rebound was imminent. However, I maintain my view: yesterday's rebound was merely a corrective bounce after a sharp decline, just a sign of market recovery. The market is only rebounding, not reversing. Our short positions bought at 4020 have yielded substantial profits; you can refer to my post yesterday to verify its accuracy. The overall trend for gold remains bearish and volatile. Today, during the Asian session, we recommend selling on any rebounds.
The 1-hour moving averages for gold continue their downward crossover and bearish alignment, and the price has now fallen back below the moving averages, indicating that the bears are still slightly stronger. After the Fed data release, the price quickly retreated after reaching 4007, and the resistance at the 4000 level suggests that selling on rallies is the best strategy. The bulls failed to hold above 4000, and the bears have the upper hand.
Market conditions are constantly changing. Now that the bullish expectations have been priced in, gold has returned to a weak trend, and there is still room for further decline. The gold correction will continue.
Today's trading strategy: Short gold at 3985-3995, with a target of 3930-3920.
