Perfect grasp of key points Insight into market trendsWith the downgrade of the U.S. credit rating and the recent weak U.S. economic data, market expectations for a U.S. interest rate cut have increased. The U.S. dollar index has plummeted and is once again facing the 100 mark. Risk aversion sentiment has rebounded again, and gold has once again been sought after. It opened higher in the Asian session. However, we have mentioned the repetitiveness of sentiment many times recently, so we remind you not to chase the rise too much. We remind you to short near 3245, long at 3209, and short again near 3245. Both long and short positions are very accurate, giving perfect entry opportunities and successfully taking profits.
Judging from the current trend, gold is under pressure again in the European session near 3248, and the US session has fallen back. The short-term strength has turned into a wide sweep again. Focus on the gains and losses of 3230. If it falls below or looks at the gap area of 3206-3203, go long if it falls back and does not break. The upper pressure is still focused on the area near 3253-60. Short-term fluctuations are increasing. If there is any adjustment, we will notify you in time.
Operation suggestion: Go long in gold near 3206-03, look at 3230 and 3252!
Goldpreis

Gold Price Soars After Moody's US Downgrade: What's Next?Gold's Resurgence: A Deep Dive into the Moody's Downgrade and Market Tremors
The world of finance is a complex ecosystem, where a single event can trigger a cascade of reactions across global markets. Recently, such an event unfolded as Moody's Investors Service, one of the leading credit rating agencies, delivered a significant blow to the United States' financial standing by downgrading its sovereign credit rating. This unexpected move, occurring after a period of notable decline for gold, sent shockwaves through the financial landscape, prompting a sharp rally in the precious metal's price. In the early hours of Asian trading, gold surged by as much as 1.3%, reaching approximately $3,245 an ounce, a clear testament to its enduring appeal as a safe-haven asset in times of uncertainty.
The Catalyst: Moody's Downgrade and its Implications
Credit ratings are critical indicators of a borrower's ability to meet its debt obligations. For a sovereign nation, its credit rating influences borrowing costs, investor confidence, and its overall standing in the international financial community. Moody's decision to lower the U.S. sovereign credit rating by one notch, from the pristine Aaa to Aa1, was not taken lightly. The agency pointed to a confluence of persistent and concerning factors. Chief among these were the United States' chronic budget deficits, which have shown little sign of abatement despite various economic cycles. Moody's also highlighted a perceived erosion of political will and institutional strength to effectively address the nation's deteriorating fiscal trajectory. The growing burden of national debt and the escalating costs of servicing this debt were explicitly mentioned as significant concerns underpinning the downgrade.
This wasn't the first time the U.S. had faced a credit rating downgrade. In 2011, Standard & Poor's (S&P) stripped the U.S. of its top-tier AAA rating, a move that also sent tremors through global markets. The parallels are noteworthy, as both instances underscored deep-seated concerns about the sustainability of U.S. fiscal policy. A sovereign downgrade, particularly for an economy as pivotal as the United States, has far-reaching consequences. It can lead to higher borrowing costs for the government, potentially impacting everything from infrastructure spending to social programs. Furthermore, it can dent investor confidence, leading to capital outflows or a re-evaluation of risk associated with U.S. assets.
The immediate market reaction to Moody's announcement was a textbook flight to safety. The U.S. dollar, typically a beneficiary of global uncertainty, found itself under pressure. As the world's primary reserve currency, the dollar's value is intrinsically linked to the perceived strength and stability of the U.S. economy. A credit downgrade, by questioning that stability, naturally led to a weakening of the greenback. This weakening, in turn, provided a direct tailwind for gold. Gold is priced in U.S. dollars, so a cheaper dollar makes gold more affordable for investors holding other currencies, thereby stimulating demand.
Simultaneously, U.S. Treasury bonds, long considered one of the safest investments globally, experienced a sell-off. This might seem counterintuitive, as a flight to safety often includes government bonds. However, a credit downgrade directly impacts the perceived creditworthiness of those bonds. Investors demand a higher yield (return) to compensate for the increased perceived risk, leading to a drop in bond prices (yields and prices move inversely). The Treasury yield curve, which plots the yields of bonds with different maturities, steepened, indicating greater uncertainty about longer-term economic prospects and inflation. U.S. stock futures also registered declines, reflecting concerns that higher borrowing costs and diminished confidence could negatively impact corporate earnings and economic growth.
Gold: The Evergreen Safe Haven
Amidst this turmoil, gold shone brightly. Its rally was a classic demonstration of its role as a premier safe-haven asset. Throughout history, gold has been a store of value, a tangible asset that retains its worth when paper currencies or other financial instruments falter. Its appeal transcends economic cycles and geopolitical shifts. Unlike fiat currencies, which can be devalued by inflation or government policy, gold's supply is finite, giving it an intrinsic scarcity value.
In times of economic stress, such as those signaled by a sovereign credit downgrade, investors flock to gold for several reasons. Firstly, it acts as a hedge against currency depreciation. If the U.S. dollar weakens significantly, holding gold can preserve purchasing power. Secondly, gold is often seen as a hedge against inflation. If a government resorts to inflationary policies to manage its debt burden, the real value of money erodes, while gold tends to hold or increase its value. Thirdly, in periods of heightened geopolitical risk or systemic financial instability, gold provides a sense of security that other assets may not offer. It is a universally accepted medium of exchange and store of wealth, independent of any single government or financial institution.
The downgrade by Moody's amplified concerns about the U.S.'s fiscal health, a narrative that has been building for some time. Commentators pointed to over a decade of what they termed "fiscal profligacy," where successive administrations and Congresses have struggled to implement sustainable long-term solutions to the nation's growing debt. The phrase "ticking debt timebomb" resurfaced in financial commentary, underscoring the anxieties surrounding the long-term implications of current fiscal policies for the world's largest economy. These anxieties naturally fueled demand for gold as a protective measure. Adding another layer to these concerns were reports of a U.S. House panel approving proposed tax cuts, which, according to some economic analyses, could add trillions more to the national debt, further exacerbating the fiscal imbalance.
The Preceding Slump: A Market Breather
The vigorous rally in gold prices was particularly striking given its performance in the preceding week. The metal had been on a downward trajectory, poised for what was described as its steepest weekly decline in six months. This earlier weakness was primarily attributed to a strengthening U.S. dollar and an apparent easing of trade tensions between the United States and China. When geopolitical risks appear to subside and economic optimism grows, investors often rotate out of safe-haven assets like gold and into riskier assets, such as equities, in pursuit of higher returns. This is often referred to as a "risk-on" environment.
The announcement of a 90-day pause on tariffs between the U.S. and China had injected a dose of optimism into the markets. This temporary truce in the protracted trade war improved investor sentiment, reducing the perceived need for the kind of insurance that gold provides. Consequently, capital flowed towards assets perceived to benefit more directly from improved global trade and economic growth, leading to a pullback in gold prices. However, the Moody's downgrade swiftly reversed this trend, highlighting how quickly market sentiment can pivot in response to unexpected news.
Navigating a Complex Web of Global Influences
Gold's price is rarely determined by a single factor. It is subject to a complex interplay of global economic data, geopolitical developments, central bank policies, and investor sentiment. While the Moody's downgrade was the immediate catalyst for the recent rally, other elements continue to shape the landscape.
Ongoing geopolitical tensions in various parts of the world provide a persistent undercurrent of support for gold. Any escalation of conflicts or emergence of new geopolitical flashpoints can quickly send investors seeking refuge in the yellow metal. Furthermore, mixed economic data from major economies contributes to market volatility. For instance, softer-than-expected economic indicators from China, the world's second-largest economy, can dampen global growth expectations and influence risk appetite, which in turn affects gold.
Statements from key policymakers also carry significant weight. Comments from U.S. Treasury Secretary Scott Bessent regarding the potential reimposition of "Liberation Day" tariffs if trade negotiations with certain partners were not conducted in "good faith" served as a reminder that trade uncertainties remain. Such pronouncements can easily reignite concerns and support gold prices.
The Long-Term Horizon: Bullish Undertones Persist
Despite the short-term volatility, many analysts maintain a constructive long-term outlook for gold. Several underlying factors are expected to provide structural support for the precious metal in the coming years. One such factor is the potential for ongoing U.S. dollar weakness, driven by the country's twin deficits (budget and current account) and a gradual shift by some central banks to diversify their foreign exchange reserves away from an overwhelming reliance on the dollar. This diversification trend, if it continues, could provide a sustained tailwind for gold.
Moreover, the policies of major governments and central banks can also influence gold's trajectory. For example, periods of expansionary monetary policy, characterized by low interest rates and quantitative easing, can reduce the opportunity cost of holding gold (which yields no income) and potentially lead to inflationary pressures, both of which are typically gold-positive.
It's important to note that gold had already demonstrated strong performance in 2025, even before this latest surge. Year-to-date, the metal had appreciated significantly, reportedly by around 23%, and had even briefly surpassed the $3,500 an ounce mark for the first time in history during April. This underlying strength suggests that broader market forces were already favoring gold.
Major financial institutions have also echoed this optimistic long-term view. JPMorgan, for instance, has projected that gold could average $3,675 an ounce by the end of the year, with a potential to reach $4,000 before the close of 2026. Similarly, Goldman Sachs maintained its forecast of $3,700 by year-end and a $4,000 target by mid-2026. These forecasts often consider a range of scenarios, including the path of Federal Reserve interest rate policy and the likelihood of a U.S. recession. Even with expectations of delayed Fed rate cuts and a potentially lower U.S. recession risk, these institutions see considerable upside for gold.
Investor Strategy in a Shifting Landscape
For investors, the recent events serve as a potent reminder of gold's role in a diversified portfolio. While gold can be volatile in the short term, its ability to act as a hedge against various risks makes it a valuable component for long-term wealth preservation. The Moody's downgrade and the subsequent market reaction underscore the importance of not being complacent about sovereign risk, even in developed economies.
Retail investors might consider gold through various avenues, including physical bullion (coins and bars), gold exchange-traded funds (ETFs) that track the gold price, or shares in gold mining companies. Institutional investors, such as pension funds and endowments, often allocate a portion of their portfolios to gold as a strategic hedge and a diversifier.
The key is to view gold not as a speculative tool for quick profits, but as a long-term strategic holding that can provide stability and protection during periods of economic or geopolitical stress. The optimal allocation to gold will vary depending on an individual's risk tolerance, investment goals, and overall market outlook.
Conclusion: Gold's Enduring Relevance
The sharp rebound in gold prices following Moody's downgrade of the U.S. credit rating is a multifaceted event with significant implications. It highlights gold's unwavering status as a safe-haven asset, its sensitivity to shifts in U.S. dollar valuation, and the profound impact of sovereign creditworthiness on global financial markets. The downgrade served as a stark reminder of the underlying fiscal challenges confronting the United States and their potential to create ripples of uncertainty that benefit traditional stores of value.
Looking ahead, investors and market observers will be keenly focused on upcoming U.S. economic data, pronouncements from the Federal Reserve regarding monetary policy, and the evolving geopolitical landscape. While short-term fluctuations are inevitable, the fundamental factors that have historically supported gold – its role as an inflation hedge, a currency hedge, and a crisis commodity – remain firmly in place. As the global economic and political environment continues to navigate complex challenges, gold is likely to retain its allure as a critical component of a well-diversified investment strategy, a timeless guardian of wealth in an ever-changing world. The recent bounce may be more than just a fleeting reaction; it could be a reaffirmation of gold's enduring value proposition in an era of increasing uncertainty.

(XAU/USD) Buy Trade Setup – Entry, Target & Risk Management PlaEntry Point:
3,140.34 USD
This is the suggested level to enter a long (buy) trade.
Stop Loss (SL):
3,121.66 USD
A protective level to limit losses if the trade goes against the setup.
Target Point (Take Profit - TP):
3,251.33 USD
This is the EA target point — where profits are expected to be taken.
---
3. Risk/Reward Ratio:
Risk: From 3,140.34 to 3,121.66 = 18.68 points
Reward: From 3,140.34 to 3,251.33 = 110.99 points
Risk/Reward Ratio ≈ 1:6, which is very favorable.
4. Resistance Point:
Around 3,222.45 - 3,227.27
This area might act as a challenge for price movement, potentially leading to temporary retracements.
5. Indicators:
Moving Averages: Red (shorter period) and Blue (longer period) lines help indicate trends.
The price is moving above the short-term MA but currently under the long-term MA, which might suggest a short-term bullish move within a broader downtrend or sideways range.
Conclusion:
This is a bullish setup, anticipating a reversal or continuation to the upside after a pullback:
Buy Zone: 3,140.34
Stop Loss: 3,121.66
Take Profit: 3,251.33
If the price drops to the entry point zone

3235 line becomes short-term resistance? Golden layout at night!🗞News side:
1. Trump's dialogue with Russia and Ukraine on ceasefire
2. The seriousness of the situation in Israel
📈Technical aspects:
In the short term, the three key factors affecting the gold market are the certainty of tariff policies, geopolitical risks, and the pace of the Fed's interest rate cuts. The Russian-Ukrainian conflict is a tail risk that deserves attention. Its impact on the global order far exceeds other geopolitical conflicts. It is expected that the conflict may see a key turning point in May and June, and the Fed's interest rate cut is likely to be implemented in the third quarter. At that time, the gold and silver markets may face greater negative pressure, and prices may fall back to 3000-2800 or even lower. Technically, the double top pattern at the daily level has been established. Although there is a certain resistance at the 3235 line of gold in the short term, considering the tail risk, the possibility of evolving into a triple top cannot be ruled out, and we need to be vigilant against the inducement of multi-money rises and washes.
🎁BUY 3220-3215
🎁TP 3230-3240
🎁SELL 3250-3255
🎁TP 3235-3225
If you agree with this view, or have a better idea, please leave a message in the comment area. I look forward to hearing different voices.
OANDA:XAUUSD FX:XAUUSD TVC:GOLD FXOPEN:XAUUSD FOREXCOM:XAUUSD

Bet on a short position near 3265!
On Monday, the international gold price rose again by more than 1%. Benefiting from the weaker US dollar and the boost of safe-haven demand, gold first fell to 3206 and then rebounded to 3250, reversing the decline in the early trading. Gold has been under pressure in recent weeks because the market has gradually digested the expectation of stagflation and repriced the expectation of interest rate cuts. The market currently expects the Federal Reserve to cut interest rates by about 58 basis points by the end of the year, while the expectation at the peak of panic in April was as high as 120 basis points.
Views on the trend of gold in the evening!
The market trend in the past few days is a little speechless for friends who like unilateralism. The market is nothing more than falling or rising first, but basically it rises as much as it falls, and it always fluctuates back and forth in a range. This is actually quite similar to the trend last week. It is nothing more than not as drastic as last week. Tonight, I still prefer to see shocks rather than breakthroughs! The upper resistance is at the previous high of 3265±3, and the lower support is to continue to look at the 3200 integer mark!
From the hourly chart, the step-by-step rise is quite obvious, but the first resistance is at 3251. Only after the rise can we continue to see the suppression of 3265. So for today, the position near 3251 is the first attempt at short positions, and the second is 3265. If the rebound is in place, we will continue to play a short position. It is not a big problem to see a profit of 20 to 30 points. If it falls directly below 3200, there will be more room for surprises!
Gold: Short when it rebounds near 3251, defend above 8 US dollars, and if you are prudent, just wait for 3265, and target the 3230-20 line!

XAU/USD) back up Trand analysis Read The ChaptianSMC Trading point update
Technical analysis for XAU/USD (Gold vs. US Dollar) on the 4-hour timeframe suggests a bullish reversal setup from a key support zone. Here's a breakdown of the idea:
Key Observations:
1. Support Zone (Yellow Box at ~3,100–3,140):
The price recently touched a significant support area marked by multiple previous bounces (green arrows).
The latest green arrow shows a bullish reaction from this zone, indicating potential for an upward move.
2. Resistance Zone (~3,220–3,250):
This intermediate zone is expected to be the first area of interest for bulls.
The analysis suggests a brief pullback or consolidation before continuation.
3. Target Point (~3,375):
The chart outlines a projected move to around 3,375, aligning with a previous supply zone and the upper channel line.
This is likely the main target for a swing trade.
4. EMA 200 (Blue Line - ~3,221):
Price is hovering around the 200 EMA, acting as a dynamic resistance.
A breakout above this would add bullish confirmation.
5. RSI Indicator (~41):
RSI is recovering from an oversold region (~38), indicating potential momentum building for a reversal.
Mr SMC Trading point
---
Conclusion:
This is a bullish reversal setup with:
Entry zone: Around 3,120–3,140
Short-term resistance: ~3,220–3,250
Final target: ~3,375
Invalidation: A clear break and close below the yellow support box (~3,100)
Pales support boost 🚀 analysis follow)

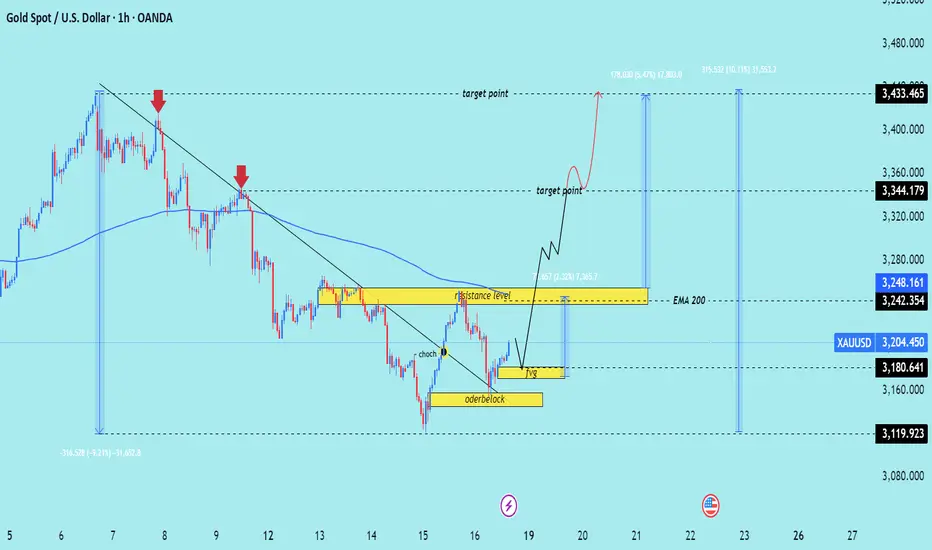
XAU/USD) bullish trend analysis Read The ChaptianSMC trading point update
Technical analysis of XAU/USD (Gold Spot price against USD) on a 1-hour timeframe, featuring a Smart Money Concept (SMC) approach. Here's a breakdown of the key ideas presented:
---
1. Downtrend & Trendline Break
The chart initially shows a downtrend with two red arrows marking lower highs.
A trendline is broken, indicating a potential shift in market structure.
CHOCH (Change of Character) is labeled — a key SMC concept signaling a reversal from bearish to bullish structure.
---
2. Orderblock & FVG (Fair Value Gap)
A bullish orderblock is highlighted, indicating an area where institutional buying may have occurred.
A Fair Value Gap (FVG) is shown, which often acts as a magnet for price to fill inefficiencies before continuing in the intended direction.
---
3. Resistance & Target Zones
A resistance level is marked near 3248–3250, which price may revisit and possibly break.
Two target points are identified:
First target: ~3344
Final target: ~3433
---
4. EMA 200
The EMA 200 is acting as dynamic resistance; a break above it adds confluence to the bullish bias.
---
5. Expected Move
The analysis anticipates:
1. A pullback into the FVG or orderblock.
2. A bullish continuation after mitigating those zones.
3. Price aiming for the resistance and eventually the upper targets.
Mr SMC Trading point
---
Conclusion
This is a bullish outlook based on a structural break (CHOCH), institutional demand (orderblock), and gap-filling logic (FVG). The price is expected to pull back slightly and then rally toward the 3344 and 3433 levels if it holds the orderblock zone.
Pales support boost 🚀 analysis follow)
XAUUSD Bearish Setup with Key Entry, Stop Loss & Target LevelsEA GOLD MAN XAUUSD
Entry Point: $3,235.94
Stop Loss: $3,235.94 (above current price, suggesting a SELL trade)
Target Points:
EA Target Point (Downside): $2,974.71 (Short target)
EA Target Point (Upside): $3,505.03 (Long target — likely alternate scenario)
Resistance Level: $3,121.49
Nearby Support Zone: Around $3,000–$2,975
📉 Trade Strategy Implied
This appears to be a short position setup:
Sell at: ~$3,220–$3,235
Stop Loss: $3,235.94
Take Profit: $2,974.71
Risk/Reward Ratio: ~1:3 (very favorable setup if thesis holds)
The upside target ($3,505.03) might be for a different scenario — if price reverses and breaks above resistance.
🧠 Market Structure Observations
Trend: A bearish break from a previous ascending channel.
Momentum: Price has bounced slightly after hitting support, but the moving averages suggest bearish momentum may persist.
Key Risk: If price breaks above $3,236 convincingly, it could invalidate the short setup and trigger a bullish run.
📌 Summary
Bias: Bearish (based on current setup)
Setup: Short with tight stop above resistance
Confirmation Needed: Watch for rejection at the $3,220–$3,236 zone and a breakdown below $3,200 for follow-through.

Gold ended this week successfully!In terms of news, first, the easing of the trade situation weakened the safe-haven property of gold. Secondly, a series of data released this week and the Fed's emphasis on not rushing to cut interest rates also suppressed the gold price. In addition, the parties involved in geopolitical conflicts also began talks. Although there are differences in negotiating positions, they still have to solve the problem when they can sit down and talk. Because of the repeated news, the closing price at the end of the week was also above 3200, so some people still believe that the gold price will go to 3500, and even think that it will exceed this position. I have mentioned this in my previous analysis. The gold price was first stimulated by multiple news and buying rushed up. Now that the risk aversion has receded, I think it is reasonable to see the gold price fall.
Let's analyze it from the technical side: the rhythm of gold has changed rapidly recently, and next Monday is actually the key. The 1-hour moving average of gold has begun to show signs of turning around, so whether it can form a golden cross upwards is the key next time, or it will oscillate a few times and continue to diverge downward. The strength of gold on Monday is very critical. Gold closed with a big positive line on Thursday, which was a very fast trend. However, it fell directly on Tuesday and broke through more than half, so it cannot be said that the bulls are strong. Although it rebounded slightly in the late trading, it still closed with a big negative line. There will be two key positions on Monday next week. Pay attention to 3180 on the bottom of gold. If it falls below 3180 soon after the opening on Monday, then gold will still be weak as a whole. Pay attention to 3215 on the top. If gold breaks through 3215, then gold will be strong as a whole. If gold opens flat on Monday and the upward momentum is not strong, and it is under pressure at 3215, then you can continue to go short in the short term.
TVC:GOLD OANDA:XAUUSD FOREXCOM:XAUUSD

Gold still has room to fall and rebounds to continue to shortGold fell as expected in the Asian session, which was in line with our thinking and expectations. Our short position was shorted near 3237-38 and exited with profit, and then shorted near 3194 and exited with profit again, and we made good profits both times. There are many people who followed the trend and went long in today's market, or even chased the long position, and without exception, they were trapped and wailing. We have repeatedly emphasized that we should treat it with a sweeping approach, and different market rhythms should be responded to with different methods. Judging from the current market trend, the European session continues to weaken. The focus should be on the gains and losses of 3180 support. If it breaks through, it will continue to look at 3150 and 3120. In this case, the short-term will return to weakness. If it does not break, we will look at a wide sweeping range. The upper pressure will focus on 3200, 3215, and 3230. The rebound will be mainly high. The weekly line will be closed tonight, and volatility will intensify.

XAUUSD TRADE Entry from Support with Targets at 3,347 and 3,503Entry Point: 3,219.45
Stop Loss: 3,171.35
Target Point One: 3,347.49
EA Target Point (Final Target): 3,503.87
Trade Plan:
Risk Zone: Between entry (3,219.45) and stop loss (3,171.35). The trader risks roughly 48.1 points.
Reward Zone: From entry to:
Target Point One: ~128 points.
Final Target (EA Target): ~284.4 points.
Risk-Reward Ratios:
To Target Point One: ~2.66:1
To EA Target Point: ~5.9:1
Indicators and Signals:
Price appears to be bouncing off a support zone near 3,212–3,219, indicating a potential reversal.
200 EMA (blue) and 50 EMA (red) are shown; price is slightly above the 200 EMA, suggesting long-term support.
There is a downtrend before the bounce, so this might be a counter-trend trade or the start of a new trend.
Summary:
This setup is a classic bounce from a demand/support zone with a clear upside potential. The risk is tightly managed, and the reward is significantly higher, aligning with favorable risk-reward principles. However, the position is speculative and relies on bullish follow-through from the support level. Watch price behavior near the 3,288 and 3,347 resistance zones to assess momentum.

XAUUSD remains bearish unless it breaks 3265🗞News side:
1. India considers using new Indus River project to cut water supply to Pakistan.
2. Pay attention to the news of Russia-Ukraine ceasefire negotiations today
📈Technical aspects:
Today's opening correction is due to technical repair and adjustment, which is why I shorted. The support of 3200-3210 is of great significance to the short-term trend. If it can be supported here again, it may further promote the upward expansion space. However, after the rebound in the morning Asian session, it did not break through the 3265 line. On the contrary, the bulls began to weaken. Today is Friday, and the market is not expected to show a unilateral strong attitude. It will be treated as a shock during the day. Before breaking through 3265 above, we can short at a small level during the intraday rebound. Short-term operation suggestions, temporarily look at 3235-3240 on the upper side, and look at the support of 3210-3200 on the lower side.
If you agree with this view, or have a better idea, please leave a message in the comment area. I look forward to hearing different voices.
FOREXCOM:XAUUSD FXOPEN:XAUUSD TVC:GOLD FX:XAUUSD OANDA:XAUUSD

Gold has a strong deep V, 3200 support is good for longThe 1-hour moving average of gold begins to turn and continue, so the momentum of gold bears begins to weaken, and gold bulls may begin to exert their strength. However, gold started to rise all the way from 3120 to 3252 yesterday. Gold rose by about 130 points, so the volatility began to increase. Therefore, we must wait patiently for gold to adjust. Because of such a large fluctuation, an adjustment will also be tens of dollars. We must wait patiently for the adjustment and stabilize before going long. After gold breaks through 3192, it is considered a strong deep V breakthrough of important resistance. Then 3192 of gold has now become an important support level. If it falls back to 3192 in the Asian session, go long on dips. If gold falls back to near the 3200 mark, you can try to go long.
Since gold has started to reverse strongly, gold bulls have begun to show their muscles. In the short term, we should not be stubbornly bearish anymore. We should be flexible and adapt to the market. The market is like this, changing rapidly. We should adapt to the market and not be too obsessed with bears or bulls. Obsession is a trap. Gold bulls are strong now, so gold is now the home of bulls. Go long when the Asian session falls back.

Gold is abnormal, we still need to go long when we find an oppor
Gold has a perfect V-shaped reversal today. It opened at 3177 and fell unilaterally in the Asian session. It hit 3120 at noon and then rose slowly. As of the time of writing, it has completely recovered the decline and is currently trading around 3195. I have analyzed the European session. After the gold price broke through the extreme drop of 3200, it needs to be repaired, but it has taken another rebound correction. The analysis also gave attention to 3156 to 3168 to continue to be bearish. With the slow rise and break, the bearish view is invalid. Now make a new analysis.
Since the gold price has been rising slowly since 3120, let’s not guess whether this wave of upward movement is a rebound or a trend reversal. In terms of operation, I suggest to follow the trend and look at its upward movement first. Because we have analyzed the general trend before, it is still in the second wave of decline since the high-level decline and has not reached the trend target; secondly, the rebound of 70 points from the low level is not enough to judge the trend reversal. So first pay attention to the stagflation after this wave of slow bull trend and then make a trend judgment.
At the hourly level, the gold price has been rising slowly since the opening of the US market. This slow rise is generally not a top. We will wait for a correction and break through the previous hourly K before analyzing it. In terms of specific operations, we can first follow the trend and enter the market with long orders, with protection at 3176. The upper target is 3110. After breaking through, wait for a correction of 8-10 points to continue to go long and look at 3239. Then pay attention to whether the 3200 mark can be stabilized at the close of today, which is related to our layout ideas at the end of the week.

Gold plummets, pay attention to the 3100 first-line support🗞News side:
1. Russia and Ukraine hold ceasefire talks
2. Initial jobless claims data released during today's US trading session
3. Trump administration exposed to trillions of national debt
📈Technical aspects:
Gold has been in a sideways consolidation yesterday, and we did not have a good entry opportunity to trade in the evening. Today, it has been falling with inertia since the opening of the market. It has now fallen to around 3130, successfully breaking through 3150, the key early point. At present, the daily chart of gold is in a downward wedge arrangement, with the focus on 3130 support below and 3200 suppression above. If the European market cannot fall below 3130, then be wary of bullish counterattacks.
On the other hand, if we fall below the 3130 line, we will fall back and continue to focus on the 60-day moving average support 3105-3110 area. Therefore, in terms of operation, gold will first focus on the 3130 first-line support. If it breaks below, wait for the 3105-3110 area and then consider buying based on the long-short game. The top target is the 3190-3200 area. If it does not break 3200, then go short!
If you agree with this view, or have a better idea, please leave a message in the comment area. I look forward to hearing different voices.
FOREXCOM:XAUUSD FXOPEN:XAUUSD TVC:GOLD FX:XAUUSD OANDA:XAUUSD

Gold continues to fall seize the opportunity to enter the market
📌 Driving factors
China-US container shipping routes rose sharply - factories rushed to produce overnight, taking advantage of the tariff cooling-off period, those who should stock up are working overtime to complete the tasks. This is the situation seen on the first day after the tariff reduction, indicating the complementarity between China-US trade.
The long-awaited US-Japan and European and American tariffs have not yet ushered in substantial benefits, but Europe said that this is an unfair negotiation and has not been concluded yet.
Trump went to the Middle East and signed a 100 billion weapons order, stabilizing the Middle East before Europe.
📊Comment analysis
The Asian session fell in the morning, pay attention to a few points:
1. The upper watershed opened at 3193 in the morning, the short watershed.
2. Directly break the 3168 long watershed, the next support is at 3145, 3130.
3. For now, the Asian session will continue to fall in a cycle, the European session will pull back after breaking the bottom, and the US session will continue to retreat.
💰Strategy Package
For short-term operations, short selling can be done near 3166, stop loss 3169, target 3140, 3135.
Labaron believes
Guaranteeing the principal is the bottom line for survival, controlling risks is the armor for survival, earning profits is a stage medal, and long-term stable and continuous profits are the only proof of being able to stand up from the sea of blood and corpses.

Do you think gold can still rise? Don't be naive.
The support strength of 3200 should not be underestimated, but I don't think it is difficult to fall, it's just that the market is too weak.
If you say that every decline is very fierce and infinitely close to the rebound of 3200 points, then you can say that it has strong support. The problem is that it only tried on Monday and never tried to break through since then? It just started to fluctuate after 3207 points. The so-called support effect must be accompanied by a rebound and counterattack, which can prove its significance, but have you seen a big rise in gold? I can only call it a slight rebound performance. .
You have seen the rise, right? Soaring, continuous rise, retracement rise, unilateral rise, all of these premises require a steady stream of buying orders in the market, don't care why it is, it is like this when the emotional rise comes, does every rise not need any reason at all? But now you actually start to use CPI data or other news to see the rebound of gold. Isn't this originally contrary to the emotional rise? From offense to defense, you should be more static and wait until the market really goes up, not too far, to recover above 3,300 points, and then regain bullish interest, right?
Or do you think the decline is over? Yes, I once shorted and thought that 3,200, 3,100, and 3,000 could not go up, and it was over, because I was also on the defensive at that time, but what was the result?
Regarding last night's CPI, why was I able to excitedly notify everyone to short after seeing the data? The reason is very simple. Before the announcement, everyone thought that inflation would rebound in April, including me, after all, there was the impact of tariffs in April, but if there was no impact of tariffs, I would definitely think it would fall back, after all, the wage growth rate in the employment market in April was falling, and it would not cause spiral inflation. Even gold was sold in advance before the data was released, and it fell. I didn't expect that the inflation would fall back in the end, which was bullish for gold. This was already a surprise, and I couldn't help but short it after seeing it.
The data was bullish, why short?
Let me make it clear first, don't always say that gold is like this now. If you see good data, you go short, and if you see bad data, you go long. If you have this idea, you should put down your phone and work hard.
The positive CPI proves that inflation is falling. On the other hand, the US job market is very stable now, and the economic activity PMI capacity is warming up. This means that the economy will have signs of a soft landing and will not cause the so-called stagflation. Moreover, at this stage, inflation has already fallen from 9.1% to the rated target of 2%. The Federal Reserve has successfully reduced inflation. Then I ask you, what do people want gold for at this time? Why not buy risky assets? Many people can't turn this corner. Let's put it this way. If inflation really rebounds during a period of high interest rates, what do you think the Federal Reserve will do? Raise interest rates, but who will bear the systemic risks caused by your interest rate hike? Isn't the collapse of SVB Bank an example? I won't talk about the pressure on companies and households to repay debts. Your concerns about stagflation will arise, and gold will take off without saying much. I hope you can understand this logic.
So, why is there such a question as why gold doesn't rise when there are good news? Why would there be such a thing?
Oscillating market is often the most complicated to analyze, but I like this complexity because it can broaden my trading horizons.
Since Monday night, the low point headed by 3207 has started to fluctuate. Note that it is not a rebound, because it was flat until yesterday. . It was just that the final step back to 3225 formed this rising trend line. Although the angle is wider, it is at least an upward trend line, but the subsequent upward momentum is not enough.
Last night, I gave a 42 short, 50 plus, and the retracement was controlled at 60. It rebounded directly at 25V, which is equivalent to giving the strategy an opportunity to increase the entry. It did not complete the reversal, otherwise the previous high point would have been broken long ago. You are an upward trend line, and the high point must be higher than the previous wave to maintain stability. As a result, it was directly lower than the previous high this morning. What do you think I am not bearish?
Also, it is nothing to simply break the trend line, but if you break the previous low last night, you are doomed. You see, the current price is not only below the trend line, but also below 25, so there is a suspicion of a trend reversal on the right side, right? Although it cannot be called a reversal, gold has been at the bottom after a sharp drop, but as far as this rising trend line is concerned, it must turn into a falling trend line, otherwise gold will not fall when it pulls back to the trend line! Pressure has been formed here, so I know how to operate in the short term. I will directly bearish near 38, and the retracement only needs to be controlled at 50. You must look at 3200 points below.
I compare the intraday decline. The second stage of the N-shaped decline should also be 3201. As for whether you break 3200, since we can get considerable trading profits last night, I definitely have the chips to try it, so I will bearish it!

Gold price plummeted below 3200, how should gold be deployed?🗞News side:
1. The rise in U.S. stocks is worrisome, and the risk of backlash is growing.
2. Pay attention to initial unemployment claims data
📈Technical aspects:
The US gold price fell below the key support of 3200. At present, the gold shorts continue to exert their strength and are expected to further test the support of 3170-3160, or even the previous key point of 3150. Before the market trend becomes clear, it is not recommended for brothers to enter the market at will. If the gold price successfully touches the support area below and obtains strong support, then enter the market to do more.
If you agree with this view, or have a better idea, please leave a message in the comment area. I look forward to hearing different voices.
OANDA:XAUUSD FX:XAUUSD TVC:GOLD FXOPEN:XAUUSD FOREXCOM:XAUUSD

Gold's consolidation is over and bears will break 3200!Gold market analysis:
Short-term gold has entered a repair period. The previous tariff negotiations led to a sharp drop in gold. It has now fallen to around 3200 and is stuck. The shape and indicators show that 3200 is a super support. This position is greatly beneficial for selling on the weekly and daily lines. Yesterday, the daily cross star, the overall trend is still empty, the short-term repair range is 3265-3220. If you want to grasp the trend trading, sell at a high price and arrange the selling order. Lao Gu believes that the possibility of continuing to fall after the shock is over is greater, and it will break 3200 later. The daily moving average indicator is also broken. The gold fluctuation rhythm is very large, that is, a technical rebound and repair are basically dozens of points. It is most important for us to grasp the rhythm in operation. Today's idea can rely on the upper edge pressure of the shock to sell.
If the Asian session rebounds around 3256 first, consider selling it first. There are opportunities for buying and selling in the volatile market. What we need is patience and waiting. In addition, the daily moving average begins to rush down, and selling begins to move. If it breaks 3200, we will consider selling. We must learn to follow the recent market. We rarely follow it before, because the recent gold will not turn back when it falls or rises, and the speed of buying and selling is also very fast. It is very important to control the rhythm.
Support 3220, 3207, strong support 3200, pressure 3244, 3256, 3265, the watershed of strength and weakness of the market is 3230.
Operation suggestion
Gold-----short around 3256, target 3150-3200

Gold has now fallen by 3200, and the next support level is 3160
📌 Driving factors
As Sino-US trade tensions ease, market concerns about a global recession have eased, investor risk appetite has increased, and the attractiveness of gold as a safe-haven asset has declined, and gold prices fell on Wednesday (May 14). After the tariff truce announced over the weekend, the stock market rose sharply, weakening the safe-haven appeal of gold in the short term, which was an important factor that pushed gold prices to new highs in the previous few months, and it is also the starting point for the current large number of sell-offs!
Driven by bargain hunting, gold prices rebounded on Tuesday, and the weaker-than-expected US inflation data released that day also helped gold prices rise. However, trade optimism limits the strength of gold's rebound.
📊Commentary Analysis
Gold began to fall in the early trading of the US market and is about to fall to our expected point. The support below is 3160!
💰Strategy Package
🔥Selling Gold Area: 3245-3240 SL 3250
TP1: $3230
TP2: $3210
TP3: $3190
🔥Buying Gold Area: $3167-$3165 SL $3160
TP1: $3178
TP2: $3189
TP3: $3200!
Labaron believes
Guaranteeing the principal is the bottom line for survival, controlling risks is the armor for survival, earning profits is a stage medal, and long-term stable and continuous profits are the only proof of being able to stand up from the mountains of corpses and seas of blood.

Focus on 3200 for some support during the day🗞News side:
1. Sino-US tariffs have been eased
2. U.S. trade progress and focus on geopolitical risks
📈Technical aspects:
Yesterday we gave a long trading strategy and have been waiting to see whether the gold price can touch our target point of 3270. However, gold did not fluctuate much after the opening of the Asian market, so I chose to manually close the position near 3256.
To be honest, the market did not fluctuate much today whether it was up or down, and it is still consolidating within our box range of 3220-3265. Although gold is generally weak, it has a higher probability of strengthening during the day, and the early gap may be ready for market recovery. At present, the gold price has tested the 3240 line many times. If it cannot stand above 3240, it may test the strong support of 3200 again. If there is no breakthrough below the strong 3200 support, the market may repeat
If you agree with this view, or have a better idea, please leave a message in the comment area. I look forward to hearing different voices.
FOREXCOM:XAUUSD FXOPEN:XAUUSD TVC:GOLD FX:XAUUSD OANDA:XAUUSD

Gold comprehensive analysis summaryTechnical analysis of gold: In recent trading days, gold has experienced a rapid decline during the Asian session, then stabilized and rebounded, fluctuated during the European session, and rebounded after rising in the US session. Today, under pressure during the Asian session, the high point of yesterday's US session, 3258-60, has already experienced a rapid decline. It depends on whether it can stabilize and rebound next. Overall, continue to pay attention to the medium-term support of 3202-07. Before breaking down, once the bulls stabilize, they will fill the gap of Monday's gap in the area of 3320-25; if it breaks down, it will open up the downward space, further 3160-3120, and then gradually fall to 3060 and the starting point of this round of bulls, 3000. The M top or W bottom we emphasized is still waiting for the market to choose!
From the hourly chart, gold is currently facing some downward pressure, especially since the current price has fallen below the previous support range. After falling below the support level, the gold price rebounded again, but this rebound failed to break through the original support level and turned into resistance, indicating that the price has not recovered effectively. For now, multiple rebounds have hit around 3257 to form a double top pattern, and the scope of short-term long and short consolidation has been reduced. Including today's Asian session decline, it did not fall below the 3220 US dollar line. The short-term consolidation range temporarily refers to the 3257-3220 US dollar range, and the break will be adjusted. Today, the 1-hour SAR indicator 3246 pressure is referenced above. If it breaks above, it will look at the recent double top 3257 pressure short. Secondly, look at the 3265-78 range multi-directional suppression short. It is recommended to refer to the Asian session low near 3220 for long below. If it breaks below, it will look at the 3207-3200 range for long. On the whole, today's short-term operation strategy for gold is mainly to do more on the pullback and short on the rebound. The short-term focus on the upper side is the 3257-3265 line of resistance, and the short-term focus on the lower side is the 3215-3220 line of support.
Gold operation strategy reference: short gold near 3250-3260, target near 3240-3230. Gold pullback near 3225-3220 to do more, target near 3240-3250.

Don't panic, gold will continue to fall.
Don't worry, dear traders, gold is still falling.
Two views remain unchanged:
1. After the trade talks between the United Kingdom and the United States and China are eased, Europe, the United States, Japan, the United States and Canada will follow suit, and the short-term tariffs will be eased. This wave of gold rise is actually affected by the increase in tariffs, so the ebb is also affected by the ebb of tariffs.
2. This agreement is only 90 days. In the long run, the tariff talks are only temporarily eased. Trade frictions have not been eliminated and will become more and more serious, so the logic of long-term gold rise has not changed.
From a technical point of view, it has been cyclical recently:
The cycles we often talk about have three forms, time, price, and trend.
Look at the recent market yourself:
1. The opening is a retracement.
2. The continuity of the European market is not high and the rebound is the main one.
3. The volatility of the US market did not continue.
4. It will retrace around noon.
I didn't say it, you didn't feel it, I said it, you can see if it is going this way recently.
The same is true today. The market fell in a cycle around the opening, and the hourly line was in a continuous negative trend. The rebound continued to be short.
1. A correction in a weak situation, a single positive line is enough.
2. If the low point of yesterday's noon is broken, it means that the retracement will continue.
3. In terms of position, this kind of continuous decline pattern can be shorted by referring to the continued decline position in 5 minutes or the hourly line turning positive and pulling back. The first resistance level is 3232-33.
4. The morning continuous decline, the watershed morning high.
5. Whether the European session can break the previous low point is the key to weakness.
6. Still pay attention to the cycle. The European session is weak, and the US session continues to be short after the rebound. If the 3200 line is broken, the European session will fluctuate, and the US session will still fluctuate, and it will be weak in the early morning.
7. In any case, it should be noted that the possibility of gold's short-term retreat is very high, and it is not the right time, especially for long-term, short-term does not matter.
