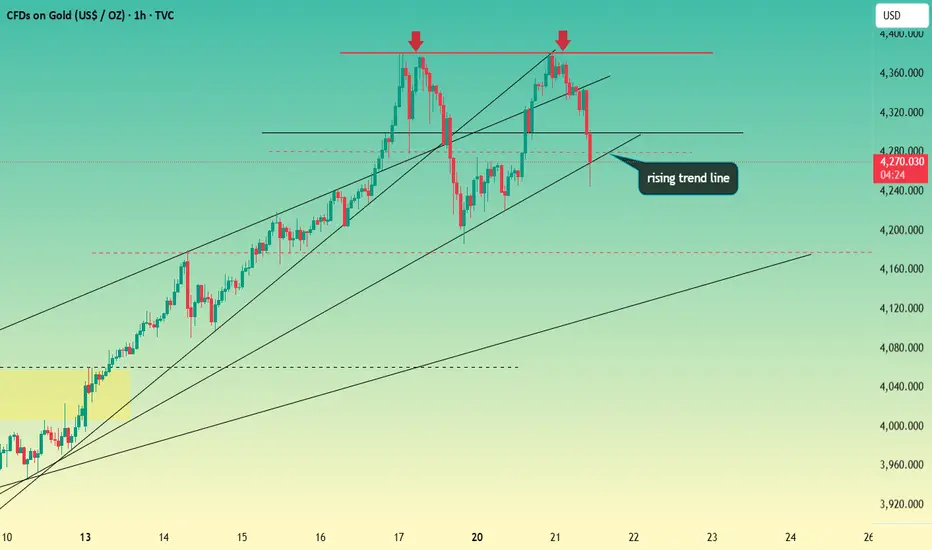
This is just a rebound, not a reversal. Continue to short gold.The Fed's interest rate decision is highly anticipated, and the question remains whether gold bulls can stage a comeback. Gold is currently in a rebound and correction phase after an oversold condition. It's premature to declare a complete reversal of the bullish trend. Gold's rebound from its lows suggests a period of consolidation in the short term, awaiting the Fed's decision to determine its direction.
The 1-hour moving averages for gold continue their downward crossover, indicating that the bullish momentum hasn't fully materialized. However, there is gradually building support at lower levels. If a strong upward surge occurs before the Fed's decision, the bullish momentum may wane afterward. A break above 4020 would confirm a true V-shaped reversal for gold. Failure to break through 4020 suggests continued range-bound trading, with support around 3890. A hold above 3890 would likely lead to a rebound.
With the Fed's interest rate decision looming, let's wait patiently. Whether gold has finished its correction and whether the bulls have begun their counterattack remains to be seen. We'll observe the strength of the bulls after the Fed's decision. If gold breaks through and holds above 4020, the short-term upward momentum will increase.
Trading Strategy: Sell gold at 4010-4020, with a target of 3950-3930.
Goldpreis

Gold Consolidates Weakly Around $3925 – Sellers Still in Control📊 1. Market Overview
Gold prices rebounded slightly from the $3900 level, reaching $3931 before losing momentum. The market is now moving sideways around $3925 in a weak consolidation phase. The U.S. dollar remains firm as Treasury yields stay elevated, while traders await the upcoming PCE inflation data, limiting gold’s recovery potential.
🔍 2. Technical Analysis
• Main Trend: Bearish, with weak corrective rebounds.
• Immediate Resistance: $3930 – $3935
• Higher Resistance: $3948 – $3960
• Near-term Support: $3900 – $3890
• EMA50 & EMA200 (H1): EMA50 remains below EMA200, confirming the ongoing bearish bias.
• Candlestick Pattern: Small lower-tail candles around 3925 indicate mild buying but no clear reversal signal.
• RSI (H1): 45 – neutral, suggesting potential range-bound movement before breaking above 3930 or below 3900.
💡 3. Outlook
Gold is currently in a short-term accumulation phase after a steep drop, but the broader trend remains bearish. A rejection from the $3930–$3935 resistance zone could trigger another decline toward $3900 or even $3880. Conversely, a decisive breakout above $3935 with strong volume may extend the rebound toward $3960.
🎯 4. Trading Strategy
🔻 SELL XAU/USD: $3928 – $3932
🎯 TP: 40 / 80 / 200 pips
🛑 SL: $3938

Analysis of the latest gold price trends today!Market News:
On Wednesday (October 29th) in early Asian trading, gold rose slightly, currently trading above $3960. Yesterday, gold experienced significant volatility, with London gold prices plunging to a three-week low of $3886. News of progress in US-China trade negotiations weakened gold's safe-haven appeal. However, the latest news on the Middle East situation rekindled some safe-haven buying, stimulating a surge in international gold prices from their lows, ultimately closing with a significant reduction in intraday losses. Gold's safe-haven appeal has been impacted by expectations of a de-escalation in the US-China trade war, leading to continued capital flows into riskier assets such as US stocks. Meanwhile, escalating geopolitical tensions in the Middle East suggest that if hostilities in the Middle East erupt again, gold prices could recover some of the losses from the past two weeks. In the short term, gold prices may continue to be under pressure, and the $3886 low may not be the bottom. However, in the medium to long term, if the Fed's interest rate cut cycle deepens or geopolitical events reignite, gold still has the potential to regain its upward momentum. Short-term attention should be paid to the resistance level near $4000. Today's market focus will shift to the Federal Reserve's interest rate decision and Chairman Powell's press conference.
Technical Analysis:
Gold has completed its phase of adjustment after bottoming out and rebounding. The daily chart shows a long lower shadow, finding support at the 3886/3900 level. The RSI indicator has also found some support at the midline. Technically, the market is biased towards buying, with a strategy of selling high and buying low. Secondly, today's fundamental news, including the Fed's interest rate decision and Powell's speech, will have a significant impact on the gold and silver markets and requires close attention. Looking at the hourly chart, gold prices rebounded after a series of declines, stopping at $3886, but have not yet broken through the resistance at the 4000-4005 level, a previous support/resistance level. The current market is still dominated by sellers! The current hourly moving average resistance is around 3985, and a break above this level could lead to a test of the 4004 level. Unless gold experiences a sharp V-shaped reversal, the selling pressure is unlikely to end easily. There is no such thing as a market that only falls; rallies are necessary to enter the market!
Gold intraday trading strategy:
Short-term gold buy at 3915-3920, stop loss at 3905, target at 3980-4000;
Short-term gold sell at 4005-4010, stop loss at 4020, target at 3950-3920;
Key points:
First support level: 3925, second support level: 3900, third support level: 3883
First resistance level: 3985, second resistance level: 4004, third resistance level: 4033

Gold bulls are powerless to recover rebound continues to bearishThis week, global financial markets are focused on the Federal Reserve's upcoming interest rate decision. Gold prices typically have a negative correlation with real interest rates. Rate cuts typically reduce the opportunity cost of holding gold, thus supporting prices. In the current environment of rising risk appetite, even if the Fed cuts rates as expected, gold's safe-haven appeal may be offset by trade optimism.
Yesterday, gold prices broke through the psychologically important 4,000 level as expected, and we saw significant returns on both short positions. After consolidating below the 4,160 high, gold is poised to break lower, generally in line with expectations. The daily candlestick pattern formed a doji candlestick pattern, followed by a mid-sized bearish candlestick pattern that engulfed the lower level, continuing its downward trend. The daily and weekly corrections are still ongoing. The daily chart finally closed at 3982, with a long black candlestick with a long upper shadow. Today's market continues to short. Gold's resistance level is currently moving downwards. The four-hour chart is entirely filled with long black candlesticks. Any rebound is easily swallowed by these large black candlesticks. These large black candlestick bodies demonstrate the strength of the bears, breaking through all support levels. The only lower support level is around 3950. If this breaks down, bears will target around 3800. Therefore, we will continue to focus on long positions, clearly at yesterday's support point, around 4040.
From a technical analysis perspective, gold is showing clear bearish signals on the one-hour chart. The moving averages are showing a bearish alignment, with the short-term moving averages pushing downward, indicating that short-term bears have the upper hand. Furthermore, the MACD indicator's death cross continues to diverge, and the growing green momentum bar further confirms the downward price trend. During the Asian session, watch for a rebound in gold prices to the 4035-4040 range. A small position can be entered into a short position with a stop-loss above 4050 to protect against losses from a sudden price reversal. Target prices can initially target the 4000 mark, with further downside potential targeting the 3980-3950 range.

Gold - Sell near 4019, target 3980-3970Gold Market Analysis:
Yesterday, we sold gold at 4066, 4037, 4049, and 4050, maintaining a bearish outlook. Yesterday's blog analysis and chart clearly demonstrated this bearish outlook. Gold's selling price dipped to as low as 3970, surprisingly breaking through 4000 with ease. In fact, from a broader perspective, 4000 is a major support level and a round number. I predict there will be further trading around 4000. Today's strategy remains bearish, so continue selling on rallies. Yesterday's decline was too large, and today's decline is expected to correct. Gold has been volatile recently, so we should try to follow the trend and chase orders. If you follow orders, the probability of losses is higher. A small rebound can result in 30-50 pips, making it difficult to take technical positions. We must also stick to our direction and not change it easily. Today's Asian session tested resistance at 4019. If this level holds, selling is still acceptable. The current pattern suggests a stronger resistance level at 4049, which has transformed from a previous strong support level into a new resistance level. Yesterday's daily chart closed negative, and after breaking 4000, selling today suggests continued downward momentum. Furthermore, if 4049 unexpectedly breaks, it will be necessary to observe whether there is a new rally.
Resistance levels are 4019 and 4049, support is 3970, and 4019 is the dividing line between strength and weakness.
Fundamental Analysis:
The decline in gold prices is attributed to the fading of news, which has led to a decline in risk aversion. We will continue to monitor the Federal Reserve's new monetary policy.
Trading Recommendation:
Gold - Sell near 4019, target 3980-3970.

XAU/ USD Bullish trend analysis Read The captionSMC Trading point update
-
Technical analysis of XAU/USD (Gold Spot)
Timeframe: 1H (OANDA)
Technical Basis: Smart Money Concepts (SMC) + EMA Confluence
---
Market Structure
Current trend: Bearish, price respecting a descending wedge/channel.
Recent Break of Structure (BOS) confirms bearish momentum continuation.
Price is retracing after forming a new low and may move back to mitigate imbalance (FVG).
---
Key Technical Areas
Retracement Levels:
0.5 – 0.79 Fibonacci zone marks the premium shorting area.
Fair Value Gap (FVG) zone between 0.62–0.79 levels is the ideal entry region.
EMA Resistance:
EMA-50 ≈ 4,067
EMA-200 ≈ 4,120
Both EMAs align with the supply zone, strengthening sell bias.
---
Projected Move
1. Expected retracement toward the 4,067–4,100 zone (supply/FVG region).
2. Potential short entry within that area.
3. Bearish continuation targeting the next structural low at 3,960 (as marked).
---
Targets
Next Target (retracement zone): 4,089
Final Bearish Target: 3,960
Mr SMC Trading point
---
Summary
Gold remains under bearish pressure within a contracting structure. A retracement to the premium zone (4,067–4,100) offers potential short opportunities aligned with structure and EMA resistance. A break below 3,995 would further confirm bearish continuation toward 3,960.
---
Pelas support boost 🚀 this analysis

Weak market rebound can short goldGold prices encountered resistance near 4,084 and began to pull back. The short position we entered in the morning has now been closed for profit around 4,044. Currently, gold has broken below the triangular consolidation zone, which aligns with our expectations. Based on the current technical structure and market sentiment, we do not plan to enter any long positions for the time being.
The key support below gold prices now is the market’s psychological level of 4,000. Judging from the current market conditions, unless a major risk event occurs unexpectedly, a break below 4,000 is only a matter of time. After the Asian session’s rally followed by a pullback, and the European session’s break below today’s low, we can continue to enter short positions if there is a rebound during the U.S. session.

Gold - Sell near 4097, target 4050-4020Gold Market Analysis:
Gold has recently experienced significant volatility. Once again, we remind everyone to respect the market when trading. Such extreme fluctuations are also the most likely to lead to margin calls. Last week, gold surged and then retreated, ultimately closing with a large negative weekly candlestick. This was the first negative weekly candlestick closing after nine consecutive weeks of positive days. Has a major top appeared? Current indicators and patterns suggest only a short-term top has appeared. A long-term top still needs to be confirmed on the weekly chart. A further negative closing this week could signal a weekly top. This week, our focus remains on a correction, and we will continue to follow this strategy. Major tops require time and space to form. Current fundamentals and international trends still support buying gold. The Federal Reserve's loose monetary policy and high debt levels are both favorable for gold buying. If this is merely a technical correction, gold prices will continue to set new highs.
Gold's potential correction from its highs lies between 4003 and 4161, with room for a 160-point correction. Gold plunged sharply in today's Asian session, leaving significant resistance. We should focus on the minor resistance level of 4097. If it fails to break above, selling will require further declines to find deeper support. Avoid selling near 4003 on the K-line chart. If the bottom of the oscillation pattern is broken this week, a deeper sell-off could occur.
Resistance levels are 4097 and 4035, while support levels are 4065 and 4045. The market's strength-weakness dividing line is 4097.
Fundamental Analysis:
For fundamental analysis, we are focusing solely on key data and geopolitical developments. This week will feature the Federal Reserve's significant interest rate decision, and the market currently anticipates continued easing.
Trading Recommendations:
Gold - Sell near 4097, target 4050-4020

Analysis of the latest gold price trends today!Market News:
In early Asian trading on Monday (October 27), spot gold prices opened sharply lower, falling nearly $50 to $4,058 per ounce. Over the weekend, China and the United States reached a preliminary consensus on the safe resolution of several key economic and trade issues. Market optimism regarding the international trade situation has significantly increased, dampening safe-haven demand for gold. In addition to trade factors, improved geopolitical dynamics and investor profit-taking have also weakened the appeal of London gold prices. Overall, international gold prices may fluctuate and adjust in the short term, but in the long term, the Federal Reserve's easing cycle and lingering potential risks may support a rebound. Expectations of a Fed rate cut, moderate inflation, and uncertainty surrounding the government shutdown provide a buffer, preventing a gold price collapse.
Technical Analysis:
From the daily chart, last Friday closed with a small bearish star candlestick pattern. Today's Asian session opened lower and closed higher, forming a "lower shadow," echoing the previous low of $4,044, forming the initial stage of a short-term double bottom support. While the MACD indicator maintains a death cross, the green momentum bar shows signs of narrowing, indicating that selling momentum is fading. The middle Bollinger Band is near $4080. The current price has returned above the middle band and has not fallen below the key support of the 10-day moving average ($4050). The daily buying trend structure has not been broken, and the low-open-high trend further confirms the strength of buying below. On the hourly chart, after a low Asian session, the price quickly dipped to $4058, forming a bullish candlestick pattern with a long lower shadow. Subsequently, the price continued to rise along the 5-day moving average, breaking through the resistance of the 20-day moving average and the middle Bollinger Band. The Bollinger Band opening is currently showing signs of widening. The MACD indicator has formed a golden cross below the zero axis, and the red momentum bar continues to expand, indicating sufficient short-term rebound momentum. However, it is important to note that the hourly RSI indicator is approaching the overbought 70 level, and the price is facing pressure from the previous range above $4100. A short-term correction may be needed, which provides technical logic for a short-term sell strategy. Overall, today's short-term gold trading strategy recommends selling at high rebounds, supplemented by buying at low pullbacks!
Gold Intraday Trading Strategy:
Short-term gold buy at 4005-4010, stop loss at 3995, target at 4080-4100;
Short-term gold sell at 4135-4140, stop loss at 4150, target at 4060-4030;
Key Points:
First Support Level: 4058, Second Support Level: 4025, Third Support Level: 4000
First Resistance Level: 4100, Second Resistance Level: 4138, Third Resistance Level: 4165

Gold analysis with trading ideasAfter nine consecutive weeks of strong gains, gold has entered a sharp correction phase. Driven by intense selling pressure, its nearly three-month winning streak has officially come to an end. However, given the persistently high levels of global geopolitical and economic uncertainty, the likelihood of a significant further decline in gold prices remains low, as safe-haven trading activity remains robust and dynamic. Currently, trade negotiations between the U.S. and China are still ongoing, while President Trump has announced the termination of all trade talks with Canada. Meanwhile, due to the U.S. Congress’ prolonged failure to pass an appropriations bill, the release of economic data continues to be disrupted, shifting traders’ focus back to central bank policies once again.
From a technical perspective, following the formation of a "double top" pattern on the 1-hour chart, gold has been oscillating under the resistance of the pattern’s neckline. Despite the bullish CPI data last Friday, gold bulls failed to push prices above the 4,160 level, indicating that short-term bullish momentum is still under significant pressure and gold is likely to remain in a wide-range consolidation. Looking at the 4-hour chart, after prices fell from the "double top" pattern, they rebounded with support from the acceleration line: the lower boundary of the range was reclaimed last Thursday, followed by a second bottoming-out and rebound on Friday—signaling that the short-term support at the lower boundary has been basically confirmed.
The key range currently lies between 4,060 and 4,170, and these two levels can be regarded as the dividing lines for short-term bullish and bearish trends. A break above 4,170 would suggest strengthened rebound momentum, potentially leading to a further test of the upper channel edge around the 4,300 area. Conversely, a break below 4,060 may trigger a continued decline toward the 4,000 support level—this forms the core framework for the current market movement.
Today’s trading strategy will revolve around the 4,000–4,170 range, prioritizing short positions at higher levels and long positions at lower levels. If prices break above 4,170, it will indicate that gold bulls have regained control, requiring a timely strategy adjustment to enter long positions on pullbacks.
Gold is weak. Short-term short selling is recommended.Spot gold rebounded on Friday, paring intraday losses after weaker-than-expected US Consumer Price Index (CPI) data, closing above 4,100. However, it remained in a negative trend for the week, ending the previous nine-week winning streak. The weak inflation data reinforced market expectations of a 25 basis point interest rate cut by the Federal Reserve at its October 29-30 monetary policy meeting. Market sentiment improved on hopes of a easing of the Sino-US trade standoff. The White House confirmed on Thursday that US President Trump will meet with the President of Korea on the sidelines of the APEC summit in South Korea on October 30, a development that could help ease recent trade tensions.
Technically, gold is showing initial signs of consolidation after a strong rebound. The short-term outlook has turned bearish, as gold prices are currently trading below the 21-, 50-, and 100-period simple moving averages (SMAs) on the 4-hour chart, suggesting fading bullish momentum. From a wave perspective, the 4-hour chart shows an ABC corrective wave pattern, with 4380 as the starting point for wave A. Currently, gold is in the stage of confirming the high point of a wave B rebound, with a high probability of a subsequent wave C decline.
On the 1-hour chart, after forming a double top at 4380 this week and then retreating, the overall market is currently in a consolidation phase with a more bearish outlook. Resistance lies above 4160-4185, while support lies below 4004. Range-bound trading is expected next Monday. If there is risk-averse news over the weekend or if 4160 is broken directly, the weak trend can be reversed.

XAU/USD Bullish trend analysis Read The captionSMC Trading point update
Technical analysis of XAU/USD – Bullish Continuation Setup (1H Chart)
Technical Overview:
Instrument: Gold Spot (XAU/USD)
Timeframe: 1 Hour
Current Price: $4,114
Next Target: $4,220
---
Chart Breakdown:
1. Demand Zone (Blue Box):
The price has respected a key bullish order block / demand zone between $4,040 – $4,080, showing strong buyer reaction (green arrows).
2. Ascending Trendline Support:
Multiple rejections from the ascending trendline confirm higher lows, signaling ongoing accumulation from buyers.
3. Fibonacci Retracement:
The market retraced around the 0.618 – 0.786 Fibonacci levels — a strong buy zone for continuation setups.
4. Moving Averages (EMA 50 & EMA 200):
EMA 50 (Blue) is trying to cross above the EMA 200 (Black), hinting at a possible bullish crossover.
A successful break above both EMAs would confirm bullish momentum.
5. Bullish Flag / Wedge Pattern:
The structure shows a bullish flag/wedge forming after an impulsive upward move — indicating potential for another breakout rally.
---
Trade Idea:
Buy Zone: $4,070 – $4,100
Target 1: $4,160
Target 2: $4,220 (main target on chart)
Invalidation (Stop Loss): Below $4,030
Mr SMC Trading point
---
Market Bias:
Bullish Bias – As long as the price holds above the highlighted demand zone and the ascending trendline, buyers remain in control. A breakout above recent highs will confirm momentum toward the next target.
---
Pelas support boost 🚀 this analysis

Last trading day. Watch for resistance levels.After the CPI data was released as expected, while the results appear bullish for gold, the market reaction was muted, and the price rebound was relatively weak. This is likely because the current gains may have already overdrawn all positive expectations, and the market needs a period of cooling off.
On the 4-hour chart, gold prices rose on the data, returning to a range of fluctuations. The moving averages are showing a relatively flat trend. The 5-, 10-, and 20-minute moving averages intersect with the middle Bollinger Band in the 4100-4110 range, which also represents a significant short-term support level. The 30-minute moving average is nearing its intersection with the upper Bollinger Band in the 4170-4180 range.
Based on technical indicators, watch for resistance at 4160 in the short term, with a breakout at 4180. Focus on support at 4100-4110 below.
Quaid believes that as the last trading day of the week, the price may also fluctuate slightly around 4130. But if it suddenly starts to break upward, then we need to pay attention to the suppression situation above. When the price first hits around 4160 and fails to break upward effectively, short sell with a light position at this position and make a profit of 30-40 points.
A happy weekend is coming, Quaid hopes everyone reaches their profit targets this week.

Gold is in a volatile market. Awaiting data releases.In the current market, the critical dividing line of $4,180 is not only a technical resistance level, but also a tipping point for the reshaping of market logic. The surge and pullback have become a shift in market momentum, fueled by an irrational exuberance fueled by bullish sentiment. The surge in gold prices over the past three months is essentially the product of a triple force: policy expectations, geopolitical risks, and central bank gold purchases.
During this process, market sentiment shifted from cautious testing to frenzied pursuit of gains. The RSI indicator briefly crossed the overbought threshold of 80, suggesting that gold prices had broken free from fundamental support. This correction is also inevitable due to a technical correction. When gold prices reached the all-time high of $4,400, market structure shifted subtly: quantitative trading systems triggered stop-loss orders, institutional investors began taking profits, and retail investors' enthusiasm for the rally reached its peak. This pullback is not a trend reversal, but rather a temporary release of upward momentum. Like a spring that rebounds after being compressed to its limit, the market needs to oscillate through fluctuations to clear floating chips and accumulate energy for subsequent breakthroughs.
The market is currently in a fundamentals "information black hole." The US government shutdown has delayed the release of key data such as the non-farm payroll report and CPI, creating a "policy expectations vacuum." In the absence of economic data guidance, investors are increasingly divided over the pace of the Fed's rate cuts. However, central bank gold purchases and geopolitical risks have limited downside potential, creating a volatile market with a "bottom and a ceiling."
In the short term, gold will maintain a volatile pattern centered around $4,180. Quaid recommends buying low and selling high within the $4,180-$4,000 range, monitoring Fed policy signals and geopolitical developments. We should also be wary of data shocks after the US government shutdown ends and the risk of a sudden easing of geopolitical conflicts. A break below $4,000 could trigger a technical sell-off.
Thus, short-term traders seek certainty amidst volatility. The current volatility in the gold market is essentially a technical correction within the bull market, not the end of the trend. The $4,180 level marks both a battleground for bulls and bears and a starting point for reconstructing market logic.
For investors, remaining patient amid volatility and seeking certainty amid disagreements may be the best strategy to deal with the current market.
The last trading day of the week, coupled with the release of CPI data, marks the first major data release since the US government shutdown, potentially triggering significant market volatility.
Strategy implementation will remain in place until the CPI data is released. I will update the strategy in the channel after the data is released.

Gold remains volatile. Choose an entry point.Gold experienced a dip on Wednesday, falling to 4004 before rebounding. It tested resistance near 4162 before falling again during the European trading session. It retreated twice to around 4010 during the US trading session before recovering above 4100 at the end of the day.
Judging from the gold market's rhythm on Wednesday, despite some twists and turns, the main structure remained within the moving average range. The 10-day moving average provided strong support, while the 20-day moving average, at 4020 and 4000, formed a support band that effectively provided a short-term bottom.
If gold continues to fluctuate and consolidate in the last two trading days of this week but does not fall below 4000, it could indicate a continued upward trend. If supported by positive fundamental news, gold could experience another short-term uptrend.
If 4000 points falls, panic selling by bulls could intensify, potentially leading to further declines in gold prices in the short term. This could also create the risk of a stampede caused by a sell-off by bulls.
Currently, the weekly MA5 remains near 4000, but the 20-day moving average has risen to 4035. In the short term, focus on the area around 4035, with the 4000 mark remaining the key level. On the upside, focus on the current intersection of the 5- and 10-day moving averages, around 4170-4180.
From the 1-hour chart, there will also be some short-term resistance above 4145, so the approximate short-term range is expected to be between 4000 and 4180. A smaller range of 4035-4145 is also expected.
In addition, the US September CPI inflation data, due to be released this Friday, is attracting much attention. If the report shows higher-than-expected inflation, it could boost the US dollar in the short term and put pressure on dollar-denominated gold prices.
In the short term, we recommend going long around 4110, with a stop-loss at 4100 and a profit range of 4140-4160.
Short-term resistance at 4160 has been persistent, so consider a short position with a profit of 30-40 pips.

Is the correction over? Bearish resistance levels are expected.Gold's decline intensified during Wednesday's US trading session, partly due to silver's earlier break below $50, which dampened overall sentiment for precious metals. Overall, this decline was primarily driven by profit-taking and a technical correction.
Gold has been fluctuating above the 4,000 mark for the past two days. After these two days of volatile decline, the 4,000 level is crucial for mid-term strategies.
Thursday's Asian session saw slight fluctuations. If the European session sees a rebound, prices could rise again to test 4,130, followed by yesterday's high of 4,161. Therefore, continued strength in the European session is a prerequisite for the US market. Focus on resistance at 4,130 during the Asian session, and watch for resistance at 4,160 after a breakout.
Trading strategy:
Short around 4130, stop loss at 4140, profit range 4060-4050.
If it breaks through, watch for resistance at 4160 and try to trade again.

Gold - Buy around 4065, target 4110-4165Gold Market Analysis:
Yesterday's gold price essentially saw a range-bound correction after a sharp drop. The 4-hour chart saw back-and-forth fluctuations, forming a large range. Today's gold price is expected to continue to fluctuate within this range. Both the 4-hour and daily charts showed very long lower shadows, reducing the likelihood of a direct unilateral move. Gold has already fallen over 300 points in the two days before yesterday and yesterday, and technically, it needs a period of correction and consolidation. Today's gold trading strategy is both buying and selling. Look for patterns of volatility. Note that gold has been extremely volatile over the past two days, making it easy to lose money if you buy and sell based on technical analysis. Try to follow the 30-minute trend to chase orders. A small intraday move can reach 50 points. Don't be too concerned about the profit margin. Gold prices will continue to rise in the morning session. Let's first look at the minor support level of 4065. If this level stabilizes, it could reach a new one-hour high. Today's buying strategy must focus on 4161. If it breaks again, it could trigger a new buying trend. Let's look for buying opportunities in the Asian session.
Support is at 4065 and 4080, with strong support at 4000 and resistance at 4161. The market's strength-weakness dividing line is at 4065.
Fundamental Analysis:
The alarming crude oil inventory data is supporting crude oil buying prices. Furthermore, whether Federal Reserve officials have signaled further interest rate cuts will support gold buying.
Trading Recommendations:
Gold - Buy around 4065, target 4110-4165

Analysis of the latest gold price trends today!Market News:
Spot gold continued its decline in early Asian trading on Thursday (October 23rd), currently trading around $4,070 per ounce. Yesterday, international gold prices experienced significant intraday volatility, with London gold prices plummeting to a near two-week low, indicating investors were taking profits ahead of Friday's key inflation data. However, trade tensions attracted some safe-haven buying, significantly paring the intraday decline by the close. Europe's clear response to Trump's call for a ceasefire between Russia and Ukraine offered hope of an end to the conflict. The prospect of the US government shutdown ending this week also reduced market uncertainty. Severely oversold technical conditions in precious metals triggered widespread profit-taking, with US gold ETFs shedding 125 tons of holdings, a drop of nearly 3%. Coupled with rising expectations of a dual-loan policy following the election of Japanese Prime Minister Sanae Takaichi, the weakening yen has passively strengthened the US dollar. These factors have put the current capital-driven rally in precious metals at risk.
Technical Analysis:
Gold is experiencing a daily correction with consecutive declines. The New York closing price fell below the 7/10 moving averages at 4203/4176 for the first time since August 20th. The RSI indicator has fallen back below the 50-day moving average, pushing the gold price back towards the middle Bollinger Band near the 4000 mark. The short-term four-hour moving average formed a downward crossover, with the price trading within the lower middle Bollinger Band. The RSI indicator is adjusting below the middle axis. The hourly moving averages are converging, with the Bollinger Band closing price adjusting towards the middle axis. In the short term, gold prices are expected to continue to experience weak, wide-ranging fluctuations. Today's trading strategy is primarily to sell high on rebounds, with buying low as a supplement. A friendly reminder: the recent market volatility, accompanied by rapid and chaotic market fluctuations, requires extreme caution when trading. Looking at the current market, the key focus for gold below is the battle for the 4000 mark. This level is currently near the 20-day moving average on the daily chart and the 5-week moving average on the weekly chart. Technically, a break below this level could trigger a mid-term correction. As a round number, if 4000 points holds, it indicates that buying sentiment remains. If this level is supported by fundamental news such as a Fed rate cut, a rebound is possible. If 4000 points holds, the two-day plunge can be viewed as a period of profit-taking, indicating that buying has not completely subsided. If 4000 points falls this week, sentiment could significantly dampen the previously frenzied bullish sentiment, potentially triggering further panic selling and potentially leading to a larger-scale correction. In summary, the focus on the battle for support around 4020-4000 is on the downside, with continued fluctuations likely above this support band.
Gold Intraday Trading Strategy:
Short-term gold buy at 4000-4005, stop loss at 3990, target at 4100-4130;
Short-term gold sell at 4155-4160, stop loss at 4175, target at 4010-4030;
Key Points:
First Support Level: 4032, Second Support Level: 4000, Third Support Level: 3982
First Resistance Level: 4102, Second Resistance Level: 4133, Third Resistance Level: 4158

Gold - Sell around 4150, target 4120-4080Gold Market Analysis:
Yesterday's gold price plunge marked its largest single-day drop in several years. The previous rally was as exhilarating as the current decline. Markets are like this, and after all, there are always surprises. The 4-hour chart formed a large M-shaped pattern at a high level, signaling a short-term top. At least in the short term, gold will struggle to rally again. The market will essentially undergo a correction and adjustment. If the weekly chart fails to close above this level in the next three days, it will likely signal a significant top. The weekly chart has closed positive for nine consecutive weeks, so a negative close this week is unlikely. We are simply followers, following the trend rather than fighting it. Yesterday's market action provided an unforgettable memory for investors who prefer to speculate on the market without risking losses. Today, we need to wait for a rebound to see if there's an opportunity for correction and adjustment.
Yesterday's hourly rebound reached 4150 at the end of trading. It then plunged in the early Asian session before rebounding again, indicating that the hourly level has bottomed out. Today, the price needs to correct within a range. We are currently unsure of the high point of this correction. Opportunities can be found on the 15-minute and 30-minute charts during the Asian session. For hourly trading, focus on the 4150-4080 range. Gold has been experiencing significant volatility recently, and I've repeatedly reminded everyone to take stop-loss orders.
Resistance levels are 4130 and 4150, while support levels are 4080 and 4050. The dividing line between strength and weakness is 4150.
Fundamental Analysis:
Watch the EIA crude oil inventory data today.
Trading Recommendation:
Gold - Sell around 4150, target 4120-4080.

Analysis of the latest gold price trends today!Market News:
Spot gold prices continued their sharp decline in early Asian trading on Wednesday (October 22nd), currently trading around $4,020 per ounce, a drop of nearly $130. Amidst the volatile global financial markets, the London gold price is once again facing a severe test of gold's status as a traditional safe-haven asset. Yesterday, gold prices suffered a sharp drop, plummeting 5.3% in a single day, nearly $300, marking the largest single-day drop since August 2020. This plunge was not an isolated incident, but rather the result of a confluence of factors, including investor profit-taking, weakening safe-haven demand, and subtle shifts in the macroeconomic environment. International gold prices have risen by approximately 60% this year. This "flash crash" not only rattled global investors but also reflected the complex dynamics of international geopolitics, economic policies, and currency markets. In the short term, gold prices may enter a period of consolidation. While this plunge may present a buying opportunity for investors, investors should remain vigilant to potential impacts from inflation data and the Federal Reserve meeting. While gold's safe-haven myth has been temporarily shattered, its core value as a hedge remains unchanged. Amidst continued global uncertainty, rationally allocating gold assets may be a wise choice to weather future storms.
Technical Analysis:
Gold experienced a historic plunge, with a single-day drop of nearly 400 points. After reaching a high of $4,381 per ounce, the price plummeted to $4,000, a move widely interpreted by the market as a sharp correction from its recent rapid rise. The end of Diwali gold buying demand in India, a rebound in the US dollar, and the absence of US futures market data due to the government shutdown all contributed to the sell-off. The market is showing signs of a bubble, and this plunge is an inevitable correction after the rally has peaked. The subsequent trend will focus on the sustainability of this decline and the price struggle around key levels. Assuming the global macroeconomic backdrop remains unchanged, gold still has upward momentum in the medium to long term, but the risk of sharp fluctuations in the short to medium term has significantly increased.
Gold Intraday Trading Strategy:
Short-term gold long at 3950-3955, stop loss at 3940, target at 4050-4080;
Short-term gold short at 4100-4105, stop loss at 4115, target at 4000-4030;
Key Points:
First Support Level: 4000, Second Support Level: 3980, Third Support Level: 3955
First Resistance Level: 4080, Second Resistance Level: 4100, Third Resistance Level: 4130

A game for the brave. Please participate.Amidst the surging tides of the trend, every ship appears adept. But the true test isn't speed, but staying at sea. Survival is more important than success. Respect the market. Quaid hopes everyone can maintain a steady pace amidst volatility and reap their own wave of wealth.
Gold prices retreated after reaching a high of 4381 on Monday. Early analysis indicated a potential "double top" pattern.
Based on the previous daily fluctuations of around $100, initial expectations suggested a range-bound market fluctuation of 4381-4270. However, the actual trend far exceeded expectations. Prices plummeted from the 4381 high, triggering a sell-off, with the largest single-day drop reaching $300. This market action further demonstrates market uncertainty. Quaid advises everyone to maintain a cautious approach and strictly set stop-loss orders, whether long or short.
A sharp decline is always preceded by a rebound. Prices declined in early Asian trading, not incrementally. Irrational declines will eventually reverse. Don't be intimidated by the market at this time. Don't trade with a normal mindset. Position management is paramount. A 10-point stop-loss is completely unbearable right now, so reduce your position size to about one-third of your normal size.
When the market plummets or soars, you can open positions in batches to keep the total transaction loss within the controllable range of the account.
For short-term trading, you can enter short positions around 4130. I'll update specific trading strategies on the channel, so stay tuned.

The M top has formed and the bull market has endedDuring the Asian session today, we took profits on our long position in gold and then entered a short position in the European session, both yielding substantial gains (this can be verified on my free channel).
Technically, gold prices are likely forming a short-term "double top" pattern. The current downward trend is quite clear, with the hourly low during the European session around 4168. Recently, gold triggered sharp declines after testing 4381 twice, indicating significant selling pressure above. Additionally, the rapid rebound to 4250 after breaking below 4200 last Friday was more of a buying defense driven by bullish sentiment. However, the probability of a rebound today is extremely low— the impact of last Friday’s plunge has not been fully absorbed, and today’s renewed slump has undoubtedly dealt a second blow to bullish confidence.
Attention should be focused on the 4180 support level below. If it is breached, the bullish trend for gold may come to a complete end.
Gold is currently in a state of panic selling. It is advisable to remain on the sidelines for now, and wait to enter the market until the selling sentiment subsides and the market stabilizes, so as to avoid losses from a market washout that triggers a double wipeout of both long and short positions.

What to do after the plunge? Strategy has been updatedGold opened higher today, testing the peak at 4381 before coming under pressure and declining. During the session, it pulled back to a low of 4317, rebounded to around the 4345 level, and then started a cascading drop. Currently, it is consolidating with fluctuations near 4266.
We have only executed one successful trade during the Asian session so far today, and all traders who followed the operation have gained good profits. As this wave of gold's decline is relatively rapid, for prudence, we can first observe the market temporarily and will inform everyone when there is an opportunity for operation.
Trading Strategy
Keep an eye on the trend during the European session.
If gold fluctuates weakly in the European session, we will go short when it rebounds in the US session.
If gold rebounds strongly in the European session, we will go long on gold when it pulls back in the US session.
I will update trading signals in real time in the channel. You can follow it if needed.