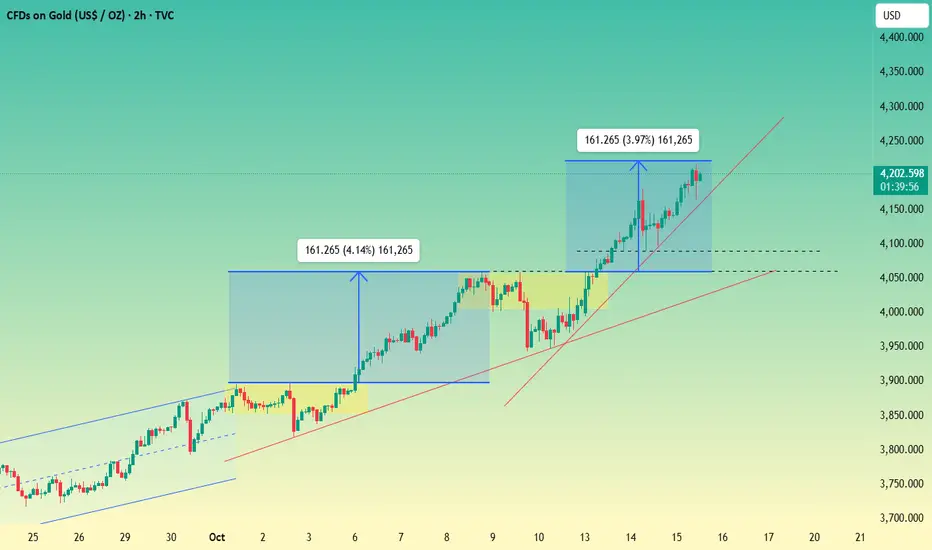
Gold Price Outlook – Trade Setup (XAU/USD)🔹 Technical Structure
TVC:GOLD Gold has extended its rally above the $4,200 handle, testing the $4,240–$4,246 resistance zone highlighted on the chart. Momentum remains bullish in the short term, but price is facing rejection near the upper boundary.
Support Zone: $4,204 – $4,210 (marked in red/purple)
Resistance Zone: $4,240 – $4,246 (marked in yellow)
Current bias shows a potential pullback from resistance before another attempt higher.
The drawn projection suggests a corrective dip back into the support zone, followed by a renewed bullish wave toward resistance.
🔹 Trade Setup
Entry: $4,204 – $4,210 (on pullback into support zone)
Stop Loss: $4,202 (below key support structure)
Take Profit 1: $4,240 (resistance re-test)
Take Profit 2: $4,246+ (extension above resistance)
Risk–Reward (R:R): ≈ 1 : 3.92
🔹 Macro Background
Gold continues to trade at elevated levels, supported by strong safe-haven demand amid U.S.–China trade tensions and expectations of further Fed rate cuts. Market participants anticipate a 25bps cut at the October FOMC, with an additional cut in December and more in 2026. Fed Chair Powell’s comments on slower job growth reinforced dovish bets, lowering yields and boosting gold.
Additionally, the newly imposed U.S.–China port fees have increased geopolitical risk, pushing investors to hedge with gold.
🔹 Key Technical Levels
Resistance: $4,240 / $4,246
Support: $4,210 / $4,204 / $4,200
🔹 Trade Summary
Gold remains in a bullish trend but faces heavy resistance near $4,246. A pullback to the $4,210 support zone offers a potential buy-the-dip opportunity, targeting resistance re-tests. Macro fundamentals continue to favor gold’s upside, but near-term corrections are possible before another breakout attempt.
⚠️ Disclaimer
This analysis is for reference only and does not constitute trading advice. Trading involves significant risk, and proper risk management is essential.
Goldpreis

Is the bull market over? Here's the strategy.Information Summary:
Gold continued its upward trend in early Asian trading Thursday, reaching a new all-time high near $4,226. This was primarily due to growing bets on a Fed rate cut and geopolitical concerns, which led investors to flock to the safe haven of gold.
In addition, Fed Chairman Powell's dovish stance and the Beige Book, which revealed concerns about stagflation, boosted demand for safe assets. So far this year, gold prices have risen by over 60% due to geopolitical uncertainty, expectations of a Fed rate cut, central bank purchases, and strong inflows into ETFs.
Market Analysis:
Gold maintained its bullish trend, reaching a new all-time high on Wednesday, breaking through the 4,200 mark. The daily chart shows continued bullish momentum with strong volume. The 10-day moving average (MA) and 7-day moving average (MA) continue to form a golden cross, with the 5-day moving average moving upwards towards 4,140. The RSI indicator remains in the overbought zone, above 80.
Bollinger Bands on the 4-hour and 1-hour charts are opening upwards, indicating that the price is trading within the upper mid-range range. The current gold bull market isn't over yet. Each sharp drop is merely a correction. Until the bullish trend ends, the top pattern remains undetermined, so avoid blindly guessing the top.
It's important to note that recent trends have all been new highs in the Asian session, declines in the European session, and sideways fluctuations in the US session. The trading strategy remains to buy on dips.
Key Points:
First Support Level: 4190, Second Support Level: 4175, Third Support Level: 4160
First Resistance Level: 4235, Second Resistance Level: 4240, Third Resistance Level: 4250

Prices remain high. The bullish trend remains intact.The overall market remains bullish, and pullbacks present opportunities for buying. Gold, as expected, broke through the 4200 level today before quickly falling and rebounding.
From a technical perspective, gold has risen strongly and quickly corrected its price after setting a new high, but it still received support from buyers at low levels, and the price rebounded quickly after hitting a low of 4164.
The 1-hour chart shows that it is in a flag-shaped consolidation pattern, and the support level is moving steadily upward. Key support has now risen to $4180. As long as gold prices hold above this level, the uptrend remains intact. The moving average system continues to form a golden cross and diverge in an upward bullish arrangement. The bullish momentum of gold still exists and continues to maintain a strong pattern.
The 4-hour chart has effectively broken through the previous range of resistance, with the next key target near $4230. Quaid recommends placing long positions above 4180, with targets potentially moving towards 4230-4250.

Gold surged and then retreated. Latest Analysis.On Wednesday, gold continued its recent record-breaking run, finding buying support for the fourth consecutive trading day. Against a backdrop of favorable fundamentals, gold prices hit a new all-time high of $4,218.19.
Persistent geopolitical tensions, escalating trade frictions, and market concerns about a prolonged US government shutdown have all contributed to the key factors supporting this surge in safe-haven assets. It is important to note that despite technical indicators indicating overbought conditions, gold bullish momentum has not weakened, suggesting that the path of least resistance remains upward and the recently established upward trend is likely to continue.
In early Asian trading, gold bulls stabilized in the 4,140 area and re-energized, breaking through the record high of $4,200. Until there is a clear signal of a peak, do not blindly guess the top location. In the short term, a buy-on-low approach is recommended, with key support focused on the intraday low and the short-term uptrend support from 4,090.
The first resistance level to watch is around 4210-4215, followed by 4240. Support is expected to be around 4180-4160. For gold, a short-term strategy is to buy on pullbacks.
Trading strategy:
Buy gold in batches on pullbacks between 4180-4160, with a stop-loss of $10. Profits are expected to be above 4200.

Gold → Every step up, the risk of a crash increasesAs I said in my previous article, the momentum of gold bulls has been weakened to a certain extent. Now, with every step up in gold prices, the possibility of a collapse increases. The current emotional value is driving gold prices up. We can clearly see today that after breaking through 4200, the momentum of gold has weakened significantly. We clearly saw today that after breaking through 4200, gold's momentum has weakened significantly. We shorted gold at 4199 and 4216, and have both taken profits at 4180. We will monitor the resistance levels of 4218-4223 tonight and take action when the time is right.
For specific trading decisions, please follow my real-time updates. I post my trading ideas and strategies daily. If you lack a plan or clear direction for gold trading and struggle to achieve consistent, stable profits, you can refer to and follow my updates as a reference and guide to help you avoid mistakes.
Gold → Bulls are strong, can they fall sharply today?Yesterday, gold opened with a volatile pullback, found support at the 4,106 level, and then staged a sharp rally. It hit an intraday high near 4,179 before crashing sharply to 4,090, subjecting both bulls and bears to intense market volatility. Especially for the bulls: after a sustained rally, market sentiment was overwhelmingly bullish—many bet on gold surging to 4,200, and some even chased the highs. However, after oscillating near 4,178, gold collapsed suddenly, breaking below the 4,100 level. This undoubtedly dealt a heavy blow to market buyers. Critically, gold rebounded but then fell again to 4,090, shifting market sentiment—only to rebound once more to the 4,140 zone, where it paused and entered a consolidation phase.
For us, who reaped substantial profits from short positions yesterday, I had long been leaning toward a gold collapse. Here’s why: gold soared over 200 points in just three days, from 3,946 last Friday to 4,179. While market news contributed to this rally, its impact was not absolute—all news has limited influence unless it continues to escalate. In reality, no such sustained escalation occurred. Additionally, although the U.S. government shutdown persists, its impact has weakened due to frequent past occurrences. Moreover, despite gold’s strong upward move, its rally lacked stability—a trend evident in the price action. There’s no such thing as an endless rally; the market was merely waiting for an opportunity or excuse to trigger a sell-off. This is why I emphasized the need to guard against a bearish collapse yesterday.
It’s undeniable that the bulls still have momentum for further gains—especially since gold tested the 4,090 level twice yesterday without breaking below it, indicating lingering bullish strength. However, Powell’s speech last night offered little actionable insight, as he did not explicitly mention whether a rate cut would be implemented in October. This has left the market struggling to form a clear forecast.
Regarding rate cuts: the U.S. government shutdown has caused a lack of economic data, leaving the Fed without sufficient references to make decisions—which could even hinder the progress of rate cuts. Additionally, tariff tensions have reignited. Even though U.S. inflationary pressures have eased somewhat, renewed tariffs could reignite inflation—a factor the Fed must consider. While there are strong calls for rate cuts within the Fed, and the U.S. labor market faces significant downside risks (which supports rate cuts to some extent), the future remains uncertain. As a result, the market has grown skeptical about rate cuts, and this skepticism will likely weaken the bullish momentum for gold to some degree.
Yesterday, we entered three short positions and one long position. The only losing trade was a short position entered at 4,147 last night. Overall, profits were quite substantial. Today, we will consider shorting gold around the 4,200 level; if 4,200 is broken, we will adjust our strategy accordingly.
For specific trading decisions, please follow my real-time updates. I post my trading ideas and strategies daily. If you lack a plan or clear direction for gold trading and struggle to achieve consistent, stable profits, you can refer to and follow my updates as a reference and guide to help you avoid mistakes.

Gold is strong. 4200 is not far away.Gold continued its upward trend after the Asian market opened on Tuesday. It reached a high near 4180 in the European session before plummeting, quickly falling back to around 4090 before continuing its upward trend. This marked a distinct bottoming-out and rebound pattern, causing significant market volatility.
Wednesday's Asian market opened with a continuation of Tuesday's trend, reaching a new all-time high near 4191, once again approaching the 4200 mark.
Gold's current pattern makes bears vulnerable to the powerful bulls, leaving short-term bears in despair. Gold continues its upward trend, with a remarkably strong daily chart, giving the market continued hope for a bullish outlook.
The previous gains were excessive, and any pullback would be far greater than we had anticipated. Tuesday's drop is a case in point. Although it was merely a market correction, it led many traders to believe the bull trend was over. However, this was not the case. The price pullback merely provided an opportunity to go long, and the bravest traders are already enjoying the rewards. Overall, the current trend remains strong. Barring any negative news regarding gold, the overall strategy remains to buy on pullbacks, with an eye on new highs.
Trading Strategy:
Go long on pullbacks near 4150, with a stop-loss at 4135. Profit range: 4080-4190-4200.
For aggressive trading, go long in batches between 4160-65.
When the price first hits 4195, you can try shorting with a small position, which can yield a profit of 15-20 pips.

Gold hits new highs again. Latest analysis.Gold prices continued their upward trend in early Asian trading on Wednesday, reaching new highs. After hitting a record high of 4179 on Tuesday, bullish profit-taking triggered a nearly $90 drop, reaching as low as 4090. Although prices retreated below 4100, bargain-hunting quickly helped gold extend its upward trend.
Gold's continued rise is driven by a combination of safe-haven demand, the Federal Reserve's dovish shift, and a weaker dollar. Factors ranging from the trade war to falling bond yields and the dollar's decline in the foreign exchange market are pushing gold prices toward higher peaks. In the short term, the international trade situation may be a key variable; if signals of a reconciliation emerge, gold prices could experience a correction.
Gold's trend structure remains intact, with the daily chart closing in a bullish trend. The 10-day and 7-day moving averages remain upward, retreating close to the 5-day moving average at 4083 on Tuesday. After stabilizing at 4090, prices regained support. The short-term chart maintains an intact ascending channel, with the Bollinger Bands opening upward and the price extending along the upper middle band.
Trading Strategy:
Go long near 4145, with a stop-loss at 4130. Profit range: 4180-4200.
Short with a small position if the price first touches 4195, with profit targets focused around 4150.
Key Levels:
First Support: 4135, Second Support: 4110, Third Support: 4090
First Resistance: 4185, Second Resistance: 4195, Third Resistance: 4200

Gold → How to operate at nightToday, we highlighted the risks in gold’s upward movement. We also guided everyone to enter short positions on gold at high levels based on the intraday trend, and all these positions yielded solid profits. Currently, gold is trading within the 4,090–4,180 range. It has tested the lower end twice but failed to break below the 4,090 support level—this indicates strong buying interest (support) at lower prices, and the sharp drop during the Asian session was likely just profit-taking by funds that entered at high levels.
Keep an eye on Fed Chair Powell’s speech in 10 minutes. As mentioned earlier, if Powell echoes the current rhetoric in favor of rate cuts, the bullish momentum will continue, and gold will keep hitting new highs. Conversely, if Powell expresses further resistance to rate cuts—causing market expectations for a Fed rate cut to plummet—gold will test the 4,090 support again. A break below this level may trigger a wave of profit-taking sell-offs, and gold’s bull market will come to a complete end.
Trading Strategy
Enter a light short position on gold around the 4,180 level, with a 3-point stop-loss. PS: Stop-losses are a must for news-driven markets; without them, you could easily get trapped if the price breaks out sharply. On the downside, focus on the 4,090 support. If this level is broken, continue to enter short positions on any rebound.
For specific trading decisions, please follow my real-time updates. I post my trading ideas and strategies daily. If you lack a plan or clear direction for gold trading and struggle to achieve consistent, stable profits, you can refer to and follow my updates as a reference and guide to help you avoid mistakes.
Bullish on gold. A recurring profit-taking?Federal Reserve Chairman Powell delivered a speech at the National Association for Business Economics in Philadelphia, his first public appearance at a major Fed meeting since last month's policy meeting. The previous meeting revealed significant disagreements among officials on the timing and magnitude of future rate cuts, and Powell's remarks are seen as a crucial moment to fine-tune expectations.
Gold prices are consolidating around the 4090-4145 range in the short term, with the 1-hour Bollinger Bands gradually flattening, suggesting another short-term trend shift. Quaid recommends paying attention to the short-term resistance level of 4150. If the price breaks through 4150 strongly, the Bollinger Bands will open upward again and the price may create a new high again.
As gold continues to rise strongly, Quaid recommends that the bullish strategy is to go long at 4100-4090, which is a more stable option. The recent volatility is large, so it is better to go long at low levels and establish positions in batches at multiple points to avoid unexpected events that may cause trend changes.
If the price breaks through 4150 with great strength, you can still go long when waiting for gold to pull back to around 4140-4130. The profit range is 4180 or above.

Gold remains strong. Should we continue to go long?After hitting an all-time high of 4179.47, gold fell sharply to around 4090. It is currently bottoming out and fluctuating around 4151. US President Trump's shifting stance on tariffs continues to boost market risk appetite. Coupled with the emergence of bargain-hunting in the US dollar, this has led to profit-taking in gold amidst severely overbought conditions.
The economic uncertainty caused by the prolonged US government shutdown, the resurgence of trade tensions, and the risk of escalating conflict between Russia and Ukraine are likely to continue supporting safe-haven gold, suggesting that gold bears should exercise caution.
On Monday, gold began its upward trend from 4025, reaching a high of 4115 in US trading, a 90-point increase. The market did not offer most traders the opportunity to go long on a pullback, and gold continued its upward trend on Tuesday.
Undoubtedly, the current trend necessitates a continued bullish stance. Focus on the strong support range of 4100-4080, which is a key support level. If prices fall back into this range, there is no problem maintaining a long position, but it remains to be seen whether prices can break back into this area.
From the 1-hour chart, MA5, 10, and 20 gradually converge around 4130, and there are signs of crossing upward. At the same time, this area is also the current position of the middle track of the Bollinger band. In the short term, if the price cannot pull back to the support area near 4100, you can also try to perform long operations around 4130. Quaid believes that if gold begins to rise around 4130, the high around 4180 could be re-broken.
Trading Strategy:
Buy in batches between 4100 and 4080, with a stop-loss at 4070 and a profit range of 4050-4180.
Aggressive Trading: Go long around 4130, with a profit range of 4180 or above.

The price has not peaked yet, will the adjustment continue upwarGold plunged sharply in the European session. Is the bull market over? It's too early to say the bull market is over. The price is merely adjusting, a common phenomenon in recent market conditions. Adjustments can occur quickly in a single day, and the last one ended in less than two days. It's time to patiently wait for the correction before continuing to buy gold.
Gold prices are already very high, so each correction can fluctuate significantly. Once a correction occurs, it could cause market confusion and lead many traders to believe the bull market is over.
But it's not over yet. A pullback in gold still presents an opportunity to go long. Barring any significant negative news, the price will continue to rise after the correction. In the short term, gold will focus on the support near 4090. If gold continues to successfully build a double bottom in the 4090 area, then the short-term adjustment of gold will end and a new round of rise may begin.
Trading strategy:
Buy in batches between 4100 and 4090, with a stop loss at 4080. Profit range: 4130-4140-4150.

Gold prices hit a new high, beware of a collapse and fallYesterday, gold opened at 4,002 and surged sharply to a high near 4,116—there’s no doubt the bulls have once again staged an explosive rally of over 100 points. As for the reasons behind this upward move, it’s clear to everyone: first, extremely high market panic triggered a safe-haven-driven rally for gold. Second, gold’s gap-up opening at the start of the session spurred market buyers to chase the bullish momentum. As gold climbed, it attracted a flood of buying interest, which in turn pushed prices even higher.
For today, as gold has a tendency to trend in one direction (either bullish or bearish) on such days, how should we decide between going long or short? Gold opened around 4,110, dipped slightly in early trading to a low near 4,106 before rebounding to 4,116, and then consolidated at elevated levels before moving up to around 4,150. The bullish momentum remains formidable—even amid high-level consolidation, the bulls still have lingering strength. Notably, calls for a rate cut from Federal Reserve officials are growing louder, and the probability of a rate cut in October is now nearly a foregone conclusion. This has further fueled market buyers’ enthusiasm for the bullish trend.
In particular, Fed Chair Powell is scheduled to speak today. If Powell echoes the current dovish rhetoric about rate cuts, the bullish momentum will likely continue—after all, rate cuts are an enormous boon for gold bulls. In such a scenario, Powell’s comments could prompt the market to increase bets on rate cuts, providing the gold bulls with a steady stream of momentum and driving gold to continue making new all-time highs.
However, it’s worth noting that Powell could also surprise by striking a more hawkish tone and pushing back against further rate cuts. The reason is simple: the U.S. government shutdown. Due to the ongoing shutdown, the Fed lacks sufficient economic data to support its decisions, which may leave insufficient justification for a rate cut. Additionally, the current chaos in the U.S. economy and the renewed escalation of tariff tensions have further constrained the Fed’s policy options. Powell previously highlighted the impact of tariffs on Fed policy, so there’s a real possibility his hawkish remarks today could drastically reduce market expectations for a rate cut. If this happens, gold faces significant risk of a sharp collapse.
Another point to consider is the timeliness of market news: the explosive impact of any event is temporary and will not drive long-term market trends unless the event itself persists or escalates. Given that gold has rallied from 3,946 last Friday to a recent high of 4,116, the bullish momentum has already been largely priced in. Even if the bulls still have some strength left today, we must remain vigilant against the risk of a sudden reversal and collapse.
Furthermore, stock markets have recovered somewhat after their earlier sell-off, and the U.S. dollar has performed relatively well recently. As these assets rebound, market panic surrounding gold should ease slightly, thereby weakening the explosive momentum of the gold bulls. While China-U.S. tariff tensions have reignited, the new tariffs have not yet taken effect, and the future trajectory of this issue remains uncertain. Regarding geopolitical risks, tensions in the Middle East have eased somewhat, and while there have been threats of escalation in the Russia-Ukraine conflict, these have so far been more about intimidation than action. A nuclear escalation, after all, would trigger global panic, and the international community is unlikely to allow the situation to spiral out of control—instead, tensions are expected to de-escalate to some extent.
Trading Strategy
We remain bullish on the long-term trend but do not recommend chasing highs. Consider entering short positions on gold within the 4,050–4,058 range.
For specific trading decisions, please follow my real-time updates. I post my trading ideas and strategies daily. If you lack a plan or clear direction for gold trading and struggle to achieve consistent, stable profits, you can refer to and follow my updates as a reference and guide to help you avoid mistakes.
Gold breaks through 4100. What's the target?Gold finally broke through 4100, which is also what we said earlier that breaking through 4100 is a high probability event. Gold finally broke through and stabilized above 4100, so the next target of gold is 4200?
Gold is still in a bull market now, and any decline basically provides an opportunity to go long. Gold continues to break upward in the US market, and the atmosphere of gold bulls is very strong. Gold has broken through and stabilized above 4100, so the next target of gold will be higher.
In terms of daily chart structure, gold is currently in a state of top divergence for a long period of time. It is impossible to determine how long this state will last. We can only pay attention to unpredictable changes in fundamental sentiment. Currently, gold is significantly off its technical trajectory. Under the influence of various market factors, gold's bullish trend remains unwavering. This is undeniable. Therefore, this week's trading will continue to focus on buying on pullbacks.
Trading Strategy:
Establish long positions in batches when the price falls back to 4115-4105, with stop-loss orders below 4100. Profit range: 4130-4140-4150.

Gold Next Move : 4222? NEW ATH CONTINUOUSLY ?Gold Currently Runs On The Bullish Channel
We Are Considering Bullish Setup On RBS Pull Back Buy Zone
Area To Buy 4060 / 4050
Pullback Buy
Target Bullish Setup 4220 - 4250
Lets Gooo NEW ATH GOLD

Gold → Unilateral surge, then go long after a pullbackGold opened higher today, surging to around the 4,060 level and returning to all-time highs once again—last week’s pullback has been completely reversed by bulls. Just as gold broke through the 3,897 level after three tests earlier, it quickly rallied to the next resistance at 4,085 following the breakout above 4,060. After a minor pullback and consolidation, it is now making a push toward 4,100.
Candlesticks continue to maintain a healthy oscillating uptrend along the short-term moving averages, suggesting the short-term movement may be a second rally after a pullback correction. On the 1-hour timeframe, after a series of small upward moves, prices are temporarily in a narrow-range consolidation at high levels. There is a certain degree of divergence emerging on minor timeframes, indicating potential room for a short-term correction.
The main driver behind today’s gold rally remains the volatile trade tensions. Gold is still in an uptrend, but the strength of this uptrend will depend on developments in trade negotiations. If tensions continue to escalate, gold is likely to break through and hit new highs. Conversely, if trade talks make smooth progress, gold will undergo a correction.
Trading Strategy:In this kind of market, even though we know it’s a bullish trend, we do not recommend chasing highs directly. Wait for a second pullback before entering light long positions. For short positions, consider waiting until around the 4,100-4125 level.
For specific trading decisions, please follow my real-time updates. I post my trading ideas and strategies daily. If you lack a plan or clear direction for gold trading and struggle to achieve consistent, stable profits, you can refer to and follow my updates as a reference and guide to help you avoid mistakes.
Gold continues to rise. Bulls and bears clash.Last week, gold prices intensified risk aversion amid Trump's tariff policy. Subsequent rhetoric of peace has tempered risk sentiment, but gold prices haven't fallen. Gold opened the week stronger, hitting new all-time highs. Currently, the market's gains are primarily due to a lack of bearish catalysts, allowing prices to rise by inertia.
From an information analysis perspective, as the Federal Reserve continues its dovish policy response, real interest rates may continue to decline, which will support the long-term upward trend of gold.
At present, gold is still rising slowly, breaking through highs continuously, and the upward trend is still continuing. It is still unknown whether it can break through 4100. The first retracement point that can be seen at present is 4060. If it unexpectedly falls below, it will test the 4030 line, but it seems a bit difficult at the moment.
The 1-hour moving average continues to diverge upward, and gold bulls still have upward momentum, but we need to pay attention to the correction after the price surges. The overall strong upward trend of the hourly line has not changed. There may be small fluctuations in the short term, and you can try to enter the market operation. The short-term resistance level is temporarily focused on the 4100 mark, and the support level is around 4060.
Trading Strategy:
Go long on a pullback near 4060, with a stop loss at 4050. Profit range: 4085-4090-4100.
Short around 4095, with a defense at 4105. Profit range: 4070-4060-4050.

Gold continues to surge. Is it unstoppable?Last week, a single social media post by President Trump wiped out $2 trillion in US stock market value, with the S&P 500 index falling 2.7% that day, its worst performance since early April. The reality of this incident demonstrates that Trump's authoritarian trade policies continue to influence the fate of the global economy.
In early Asian trading on Monday, gold briefly hit $4,060, a new all-time high. With market concerns easing slightly, it is currently fluctuating around the 4,050 high.
Looking at the 4-hour chart, Quaid believes gold prices still have the potential to reach new highs. Current support is around 4,035, followed by 4,020.
If support at 4,035 is broken, gold could potentially reach the 4,080-4,090 high. This is because 4,035 is at the 0.618 Fibonacci support level, while 4,020 is at the 0.50 level.
However, the possibility of a deeper pullback to 4020 cannot be ruled out. As long as gold remains above 4020 in the short term, it remains strong.
For short-term operations, Quaid recommends that you can go long around 4035. If the price breaks through 4060, the target may reach 4080-4090.

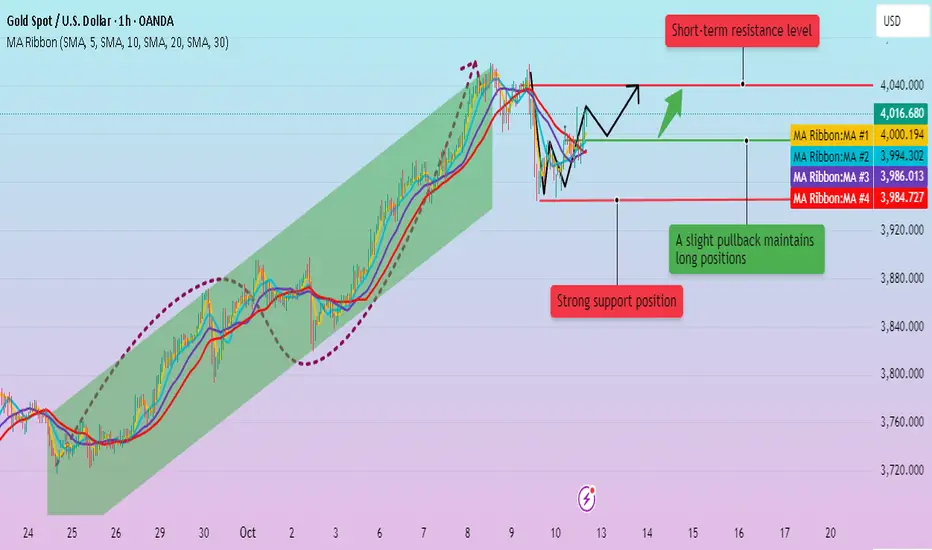
Risk aversion is intensifying. Is the rally accelerating?In early Asian trading on Monday, gold continued to rise, rising 1% at one point to a record high of $4,060 per ounce. Due to the tense international trade situation, escalating geopolitical risks, expectations of a Federal Reserve rate cut, and political turmoil in many countries, the safe-haven demand for gold remained high. As a non-interest-bearing asset, gold has once again proven its status as the "king of safe havens" amidst uncertainty shrouding global markets.
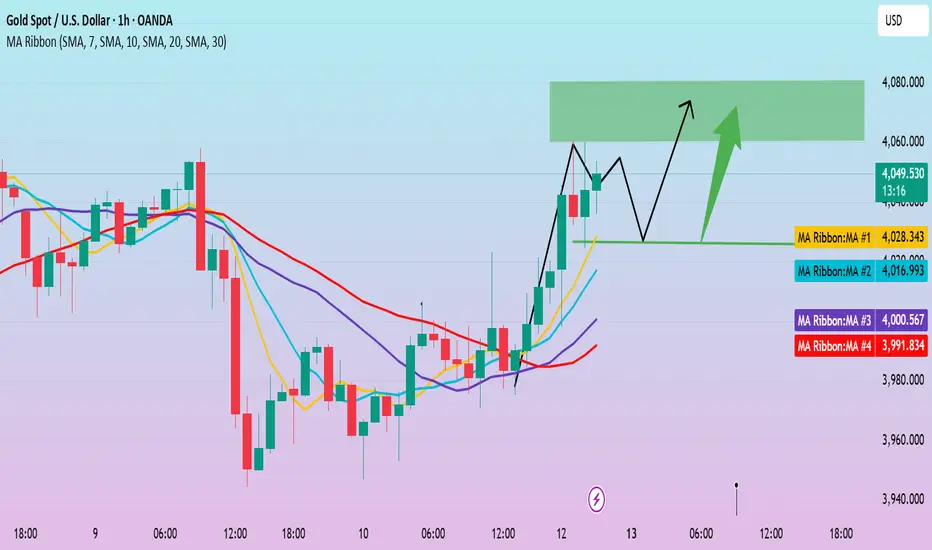
Gold is currently maintaining its trend, with a strong bullish structure intact, and has seen eight consecutive weeks of gains on the weekly chart. From a technical perspective, the RSI indicators on the daily and weekly charts have both reached 80, indicating overbought conditions. However, the daily MA10/7-day moving averages continue to open upward and gradually move up. After several rounds of adjustments last week, the market finally closed above the 5-day moving average of 4,000.
Technically, gold remains primarily bullish on dips, but be wary of sharp pullbacks after overbought levels. Recent market volatility is significant, so strict risk management is essential when participating in the market, and opportunities for entry during pullbacks are crucial.
Trading Strategy:
Long around 4025, stop-loss at 4015, profit range 4060-4080;
Short around 4080-4085, stop-loss at 4095, profit range 4040-4020;
Gold → Peak or correction? Market forecast for next weekLast Friday, we shorted gold at 3977 and 4000 points. Gold prices fell as low as 3946, and both of our short positions yielded profits. During the US trading session, gold prices rallied again, rising above 4000 points on the back of safe-haven sentiment.
Trade conflicts are volatile. Since Trump took office on January 20th of this year, the tariff issue has fluctuated between intense and easing. Now, the Sino-US tariff trade friction has escalated again, with Trump announcing an additional 100% tariff on Chinese goods effective November 1st. This was the main reason for last Friday's rebound.
The key lies in the Federal Reserve's October interest rate cut. While the probability of a 25 basis point cut is as high as 92.4%, the government shutdown has raised concerns that it may be delayed. Furthermore, the Fed minutes revealed that some officials, concerned about a rebound in inflation, oppose further rate cuts.
A brief ceasefire agreement between Israel and Hamas in the Middle East has eased geopolitical risks, raising concerns about boosting safe-haven demand. Gold prices have risen over 15% in the past two months. While a large number of profit-taking investors remain bullish on future gold prices, they are quick to flee at the slightest sign of trouble, especially during a rapid price drop.
Technically, after a relatively high daily and weekly close, there may be further upward momentum in the coming trading days. A new round of extreme gains followed by a sharp decline cannot be ruled out.
Resistance: 4030, 4058
Support: 4000, 3980
Trading Strategy:
Currently, the market is trading within the broad range of 3944-4058. The direction of the breakout will determine whether this is a correction or a peak. Shorting rallies within this range is the primary strategy. (Specific trading signals will be determined based on intraday trends.)
Next week, I will continue to share my personal trading signals. Wishing everyone gets what they hope for when the market opens tomorrow.
For specific trading decisions, please follow my live updates. I will update my trading ideas and strategies daily. If you don't have a plan or strategy for gold trading and are struggling to achieve consistent profits, you can refer to and follow my updates for guidance and help you avoid mistakes.
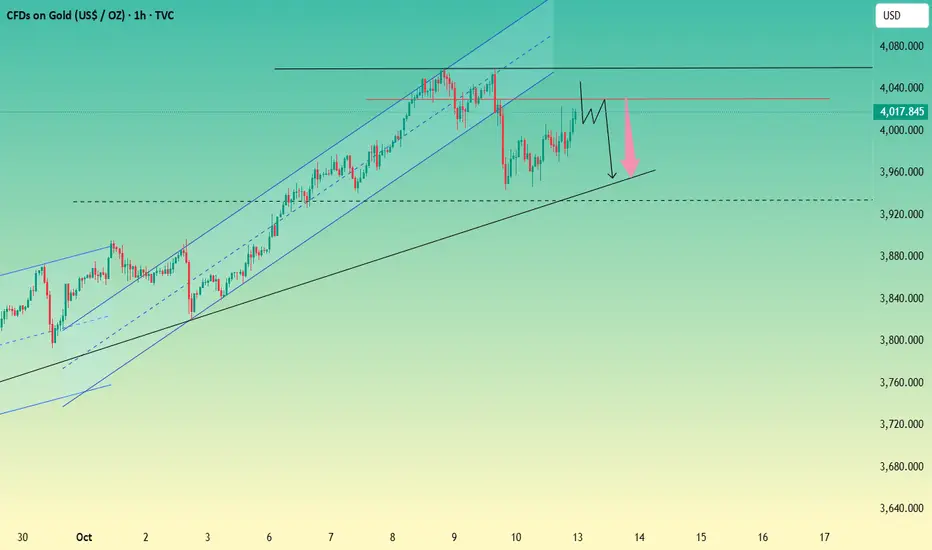
In-depth Market Analysis. Outlook for Next Week.The gold market experienced several pullbacks this week, but it rebounded during the US trading session, driven by risk aversion, ultimately closing at a relatively high level. Current geopolitical uncertainty continues to support gold prices, keeping the metal strong. On a weekly basis, gold has risen for eight consecutive weeks, maintaining an overall bullish trend. Weekly support is currently around 3944, with resistance primarily focused on the 4040 area, followed by this week's high near 4059.
On a daily basis, gold rebounded after a second dip on Friday, ultimately closing at the high, indicating strong buying support at lower levels. This provides a positive signal for the medium- to long-term market trend. At the same time, the daily chart shows that the closing price is above the 5-day moving average, and the short-term trend continues to be bullish based on the 5-day moving average.
The 4-hour Bollinger Bands are flattening, suggesting a period of high volatility in the short term. The candlestick chart has closed above the middle band, and the 5-day moving average is converging with the 10-day moving average and is about to diverge upwards. This indicates that gold is currently experiencing a volatile and strong trend, with the potential for further upward movement in the short term.
Based on a comprehensive analysis of technical patterns and fundamental factors, long-term dips remain the primary strategy unless a clear reversal signal emerges.
At the beginning of next week, the focus will be on whether prices can continue their upward momentum, but at the same time, we must be wary of the risk of a pullback if we fail to break through the upward resistance.
Gold is fluctuating slightly. Watch the market.Gold has been quite active recently, entering a pullback and correction mode. On the daily chart, it's almost forming a high-level engulfing pattern. Therefore, today's close is crucial. Whether it continues to decline, remains volatile, or rebounds strongly upwards will be crucial for future trends.
In the 4-hour level, the price temporarily maintains a narrow range of oscillation and repair, and the price is under pressure at 4010. The moving average trend at the 1-hour level tends to be flat, and there are signs of moving downward. The K-line begins to slowly break through the short-term moving average and maintains a weaker trend. There is potential for further downward correction in the late trading session, with continued strong support at 3950.
Gold Trading Strategy:
Go long on gold at 3970-3960, with a stop-loss at 3950 and a profit range of 4015-420.

Gold is unpredictable. Stay vigilant.Gold plummeted over $100 on Thursday, its largest single-day drop since May 12th of this year. This, in itself, will have a certain dampening effect on gold bulls. The decline is a technical correction. However, caution is advised: since gold has experienced a sharp drop, its short-term strength will not be as strong as at the beginning of the week. Therefore, there are two possible scenarios for gold's trend: a high-level oscillation within the bullish trend, or a volatile pullback before a rebound. For short-term trading, it is best to go long on dips and be bullish.
From a technical perspective, although the price has experienced multiple pullbacks, it is still trading above 3900. A trend change is possible only if it falls below 3900. The short-term Bollinger Bands on the 4-hour level are closing, and it may fluctuate at a high level for a while.
The current trend is consistent with my earlier prediction: a rebound followed a pullback to 3970. The price also briefly broke through 4020 before a brief pullback. If this rebound breaks through $4000 and remains above 4010, upward pressure will likely focus on around 4030.
Trading Strategy:
Buy in batches between 3960-3970, with a stop-loss at 3050. Profit range: 4010-4020.
Short around 4015, with a stop-loss at 4025. Profit range: 4000-3980-3970.
