Bulls are going wild. Is a pullback an opportunity?The gold market has recently demonstrated a strong, one-sided upward trend. Gold prices surged again on Tuesday, reaching a new all-time high, confirming the bulls' absolute dominance. The early Asian session low has become a key intraday turning point. As long as prices hold above this level, the short-term bullish trend will persist. Trading strategies should prioritize buying on dips.
Analysis of multiple technical charts indicates a bullish trend. The monthly chart indicates a solid long-term uptrend; the weekly and daily charts are also trading above key support levels, providing support for a medium-term upward trend. The four-hour chart is particularly crucial. After effectively breaking through resistance last Friday, short-term bullish momentum is strong. On the whole, the strategy should continue to follow the trend. The European session should focus on entering the market at key support and resistance levels. The focus on the lower side is the 3850-3840 support line. The short-term target on the upper side can be seen in the 3890-3900 area.
Operational Strategy:
Short at 3875-3880, stop loss at 3890, profit target at 3855.
Long at 3855-3850, stop loss at 3840, target at 3880-3890.
Goldpreis

Gold continues to rise. Where will the highs be?Gold prices resumed their record-breaking upward momentum at the start of this week, breaking through 3,800 for the first time and briefly exceeding 3,850. The US government shutdown sparked safe-haven demand, while the Russian military advance has fueled geopolitical unrest, fueling safe-haven flows. Declining US Treasury yields are also positive for gold prices, and these signs are driving another surge in gold prices.
Currently, the gold price is trading around 3846, and the bullish defense line is around 3810. As long as the short-term price rise remains above this area, the bulls will continue to break through the highs.
Conversely, if the month-end close shows a reversal, turning bearish, the first factor to consider is a break below 3,810 before a significant correction is expected. Currently, the focus is on 3,820 for a bullish buy.
Strategy:
Go long around 3,820, with a stop-loss at 3,810 and a profit target at or above 3,850.
After falling below 3810, short sell when it rebounds to around 3815, with a stop loss of $10 and a profit range of 3780.

XAU/USD Bullish trend analysis Read The captionSMC Trading point update
Technical analysis of XAU/USD Bullish Channel Setup (4H Timeframe)
---
Chart Summary:
Pair: Gold Spot (XAU/USD)
Timeframe: 4H
Exchange: OANDA
Current Price: $3,759.85
EMA 50: $3,718.68 (short-term support)
EMA 200: $3,576.42 (major support)
---
Key Elements in Chart:
1. Ascending Channel Formation
Price is moving inside a clear rising channel (higher highs & higher lows).
Upper and lower boundaries are acting as dynamic resistance & support.
2. Support Levels (Yellow Zones)
$3,720–3,740 zone: strong support with EMA 50 confluence.
$3,600–3,620 zone: deeper support, aligned with EMA 200.
3. Breakout & Retest
Price broke a short-term descending trendline, signaling bullish continuation.
Retest of support level confirms buyers are active.
4. Bullish Projection
Based on measured move (previous impulse), projection suggests a rally towards $3,877.07 (target point).
Mr SMC Trading point
---
Conclusion:
The chart signals a bullish continuation inside the ascending channel.
Bullish Scenario: Holding above the $3,720–3,740 support zone, price is expected to rally toward the $3,877 target.
Invalidation: A 4H close below $3,718 (EMA 50) could open a deeper correction toward the $3,600 support (EMA 200).
---
Pelas support boost 🚀 this analysis

Gold surges strongly. Bullish trend continues?The current market trend is very clear: any price pullback is a buying opportunity. Quaid advises against speculating on the top and shorting the market. The overall trend shows extremely strong bullish momentum, with continuous price increases and a vertical upward movement in the moving average system, indicating strong upward momentum and no signs of a top reversal.
The key historical support level of 3800 has become a solid foundation. The first resistance level is 3835, and the second is 3850. Quaid believes that investors should patiently wait for a pullback before continuing to buy.
It's important to note that while the uptrend is strong, strict stop-loss orders must be used for every trade to avoid large price corrections. The current trend is volatile, and once the market changes, it is easy to cause a large correction. While being bullish, one needs to be cautious.
Trading Strategy:
Buy on dips around 3810; stop loss at 3800; target profit range 3835-3850.

Gold breaks through 3800, should we go short or long?Looking back at the current upward cycle of international gold, the price started from a low of 3313 and has been steadily rising all the way relying on the bull trend. As of now, the cumulative increase has exceeded 500 US dollars. This increase is basically the same as the 500 US dollar band increase caused by changes in tariff policies. From the historical trend, after a similar increase, the market tends to enter the "momentum rebalancing" stage, especially when the price breaks through the key mark of 3810 US dollars, it will officially enter the short-term risk area. The riskiness of this zone stems primarily from the substantial profits accumulated from long positions initiated at $3,313. Some investors are taking profits at high levels, leading to a temporary increase in selling pressure. Based on historical gold fluctuations, after such surges exceeding $500, a typical technical correction typically begins at $100. The core function of this correction is to "digest profit-taking and repair overbought indicators" to accumulate momentum for the subsequent "second bull run", which is a necessary link in the trend continuation process.
Today, I'm considering shorting gold in the 3813-3818 resistance range, with the initial retracement target at 3800-3780.
Due to the rapid market fluctuations, please stay tuned to my channel for detailed trading tips, including execution details for both long and short-term trades. If you'd like, please share your current positions so we can analyze whether it's safer to hold on or adjust and change positions promptly.
Buying momentum continues. Has the top been reached yet?Witnessing history once again, gold hit a new all-time high during the Asian trading session, surging by nearly $48.
Why did gold surge again at the start of this week?
1. Growing concerns about a US government shutdown prompted investors to seek safety in traditional store-of-value assets, thus weakening demand for the US dollar and driving gold higher.
2. Ongoing geopolitical tensions, including UN sanctions against Iran, and other risk-averse factors, will continue to benefit gold.
After gold broke through a new high, the previous high of 3790 has now become a potential support level. For buyers, they need to see the price close above the psychological level of 3800 to provide additional support for the record-breaking rally. In the short term, expect some price retracement.
Quaid believes that if the price remains above 3800 during the European session, the next target could be 3850. A decisive break above 3850 could push gold further to around 3880.
Trading Strategy:
Buy around 3790, with a stop loss at 3780, and target profit between 3835 and 3850.
If the price remains above 3800 during the European session without any retracement, consider a small long position at 3800.

International dynamics shift. Gold prices rise.Information Summary:
The United Nations imposed a new round of tough sanctions on Iran, directly impacting its economy and nuclear program, triggering a sharp escalation in regional tensions. Iran's assertive stance and refusal to compromise have fueled market concerns about escalating conflict. The rapid decline in gold prices was followed by a strong pullback, which fully confirmed the strong bullish sentiment in the market. It is expected that this geopolitical driver will continue to provide strong upward momentum for gold prices.
Market Analysis:
From a technical perspective, gold closed with a solid bullish candlestick on the daily chart, forming a classic bullish bottoming-out pattern and fully reversing earlier losses. The current gold price has firmly stood above all major moving averages, especially near the 3755 line, which has transformed from resistance to strong support. Influenced by the international situation, bullish momentum is strong in the market.
Quaid recommends going long in line with the market, targeting the 3800 integer mark, and continuing to hold positions after breaking through.

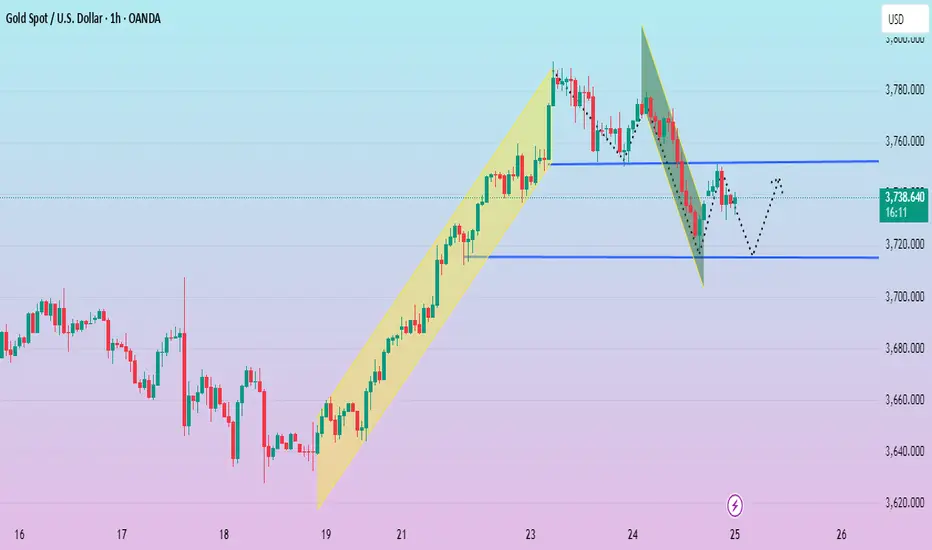
Double top expected, short at the beginning of the weekLast week, after a brief sideways consolidation following the opening, gold surged steadily and hit a new all-time high around 3,791. However, after a pullback correction on Wednesday, its upward momentum weakened relatively. During Friday’s U.S. trading session, gold rallied to around 3,783 before pulling back, closing near the 3,759 level.
Technically, the daily chart shows a single bearish candlestick for the pullback, while Friday formed a small bullish candlestick with an upper wick—once again standing above the moving average system. This suggests gold is relatively in the early stage of preparing for a second rally. The weekly chart also closed as a medium bullish candlestick, indicating the overall broad market sentiment remains bullish. Driven by a series of bullish patterns, gold may see a trend reversal (breakout) move next week. After all, the pullback from Friday’s U.S. session high could very well be a short-term "washout" by bears.
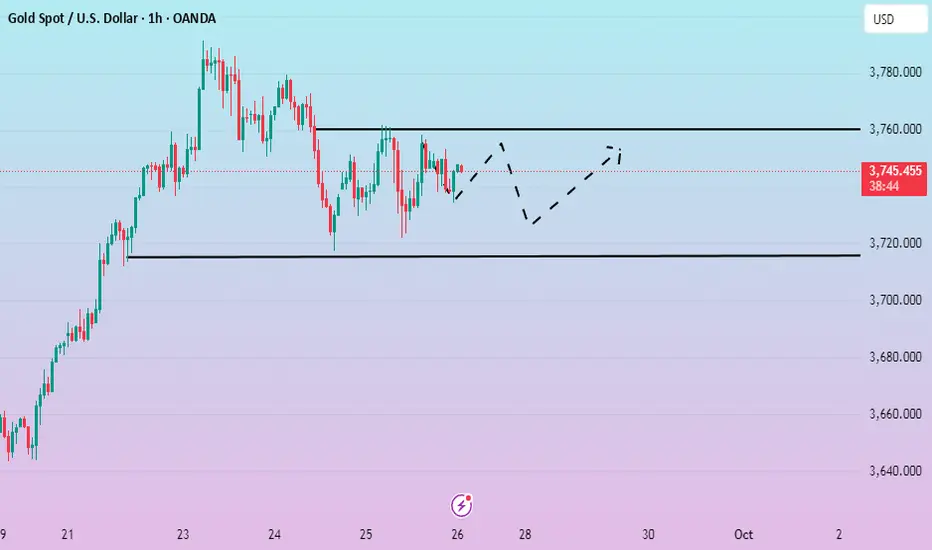
For gold to refresh its highs next week, Friday’s secondary high must be broken in a timely manner. Meanwhile, during pullbacks, the 3,770 level—now a top-bottom conversion zone—will act as a key short-term resistance. If gold opens under pressure below this level on Monday, it may break lower again later. On the 1-hour chart, if gold fails to extend its upward move, a "double top" pattern could form.
A series of major economic data releases are scheduled for next week. Gold will likely trade in a consolidation range early next week, given the lack of significant news triggers initially. Focus on the resistance at 3,790 first—we expect a pullback initially, with support to watch around the 3,720 zone. If Monday’s rebound lacks strength, prioritize short positions on rallies.
As market conditions change rapidly, please follow my channel for specific trading key points, including execution details for both long-term and short-term trades. If you are willing, feel free to share your current position status—we can analyze together whether it is safer to hold patiently or adjust and rebalance your positions in a timely manner.
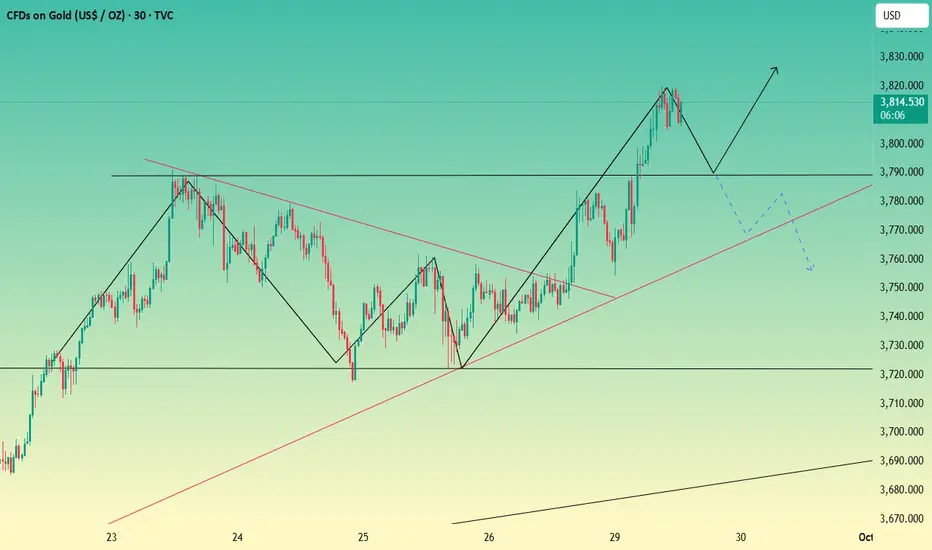
Trend changes? Outlook for next week.Gold rose strongly on Friday, hitting a high of around 3783. It began to fall before the closing of the US market and did not break through the new high. So, will gold hit a historical high or start to correct?
Gold has broken through the recent consolidation range on the 4-hour chart, and the upward trend extends to the historical high of $3,791. If the gold price continues to fall below $3,750, short-term trend will be more bears, and may return to the previous consolidation range. The downward target will focus on 3720-3700. On the upside, if the gold price clearly breaks through the suppression position of 3780-3790, it will release new bullish momentum and pave the way for gold prices to move towards a new price range.
The gold 1-hour trend temporarily remains in a narrow range oscillation, but after continuous oscillation, there are signs of upward movement in the short-term moving average. If the 1-hour moving average cannot continue to run upward, then gold may be in a state of reaching its peak.
Some major data will appear next week, and there is a high probability that the golden week will still remain fluctuating at the beginning of the golden week. If there is no stimulating news, please pay attention to the first support of 3750, followed by the support of 3720 area. In terms of short-term operation ideas in Asia on Monday, Quaid recommended that rebounds should be the main focus, and pullbacks should be the supplement. The short-term focus on the suppression position of 3780-3790, and the lower focus on the first-line support of 3740-3730.
The happy weekend is approaching, I wish you all a happy transaction next week.

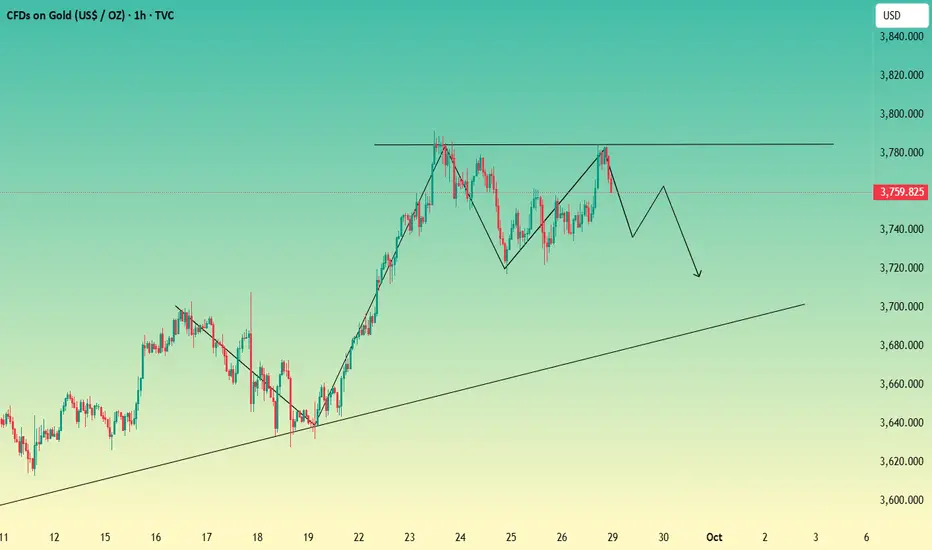
Reaching the High Point. Price Retracement?After a period of consolidation this week, gold surged upwards, reaching a new all-time high near $3791. However, following the retracement on Wednesday, the upward momentum weakened. On Friday, during the US session, gold briefly touched $3783 before retracing, closing near $3759. It remains above the moving average, suggesting a potential second wave of upward movement.
Overall, the market sentiment remains bullish, and a series of bullish patterns suggest that gold may continue its upward trend next week. The Friday pullback could be seen as a consolidation by the bulls. The resistance level around $3770, where the previous high and low were formed, will be an important short-term resistance level.
If the Asian market opens at 3770 under downward pressure on Monday, it is very likely to break down again in the later period, and the low point of 3717 generated last week may also be broken.
The current unilateral trend is not clear. Try to short near 3770 when the Asian market opens next Monday. Focus on the profit range near 3730 and set a stop loss at 3780. If there is no sign of decline in the European session, adjust the strategy in time in the US session.

Bullish momentum strengthens. Trend change?Gold remained volatile before the release of the PCE data, touching around $3761 before retracing to around $3722, consistent with short-term range-bound trading. Recent significant price gains and continuous new highs have boosted bullish sentiment in the market.
However, these continuous new highs have also instilled fear and caution among many traders. Each pullback has served to build momentum for further upward breakouts. With these new highs, short-term bullish sentiment has rebounded.
Looking at the 1-hour chart, the moving average system is running upward. The early price correction touched the lower track of the Bollinger band, and then rebounded to maintain volatility. After the PCE data release, bullish momentum surged, pushing the price sharply higher, currently trading near the upper Bollinger Band. Indicators suggest that bullish strength is gradually recovering.
On the last trading day of this week, the market is likely to maintain a high-level fluctuation trend, but be wary of sudden black swan events. If the price retraces to around $3740, Quaid recommends establishing a long position at that level and waiting for a rebound.

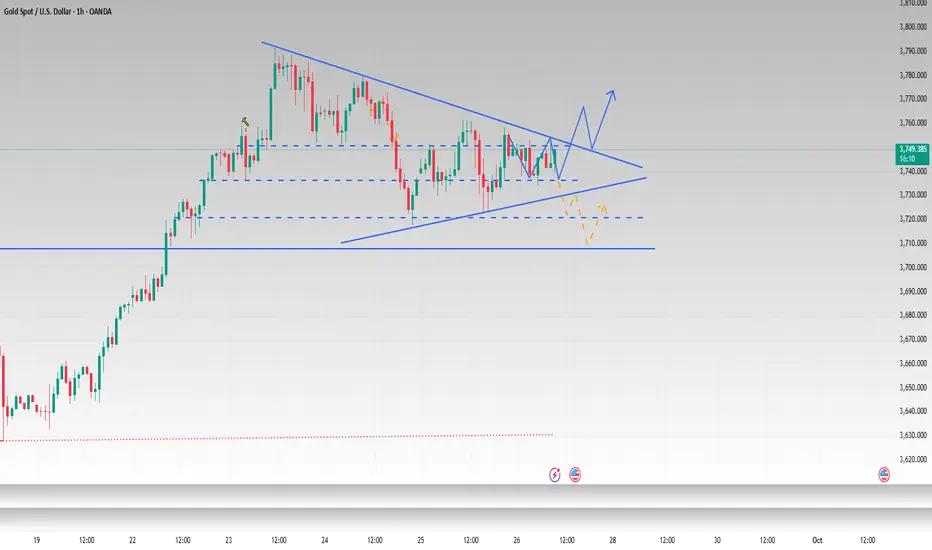
If it doesn't break 3755, we will continue to be bearishYesterday, gold tested the lowest level of 3720 and then began to rebound. In the evening, gold rebounded again to around 3758, but it did not effectively break through the trend suppression, so gold still fluctuated and fell.
Today, gold has traded in a narrow range during the Asian session, with no clear trading direction in the short term. The overall trend is currently consolidating within a triangular pattern. As time goes by, the short-term trend pressure has come to around 3750. The European session will focus on the pressure of 3750-3755. If it fails to break through effectively, gold will continue to fluctuate and consolidate in the short term, and you can consider shorting gold. On the contrary, once 3755 is effectively broken through, it means the end of the short-term downward adjustment. Key support levels are at 3730-3720. For intraday trading, adopt a "buy low, sell high" strategy within the 3750-3720 range, aiming for profit targets of $10-$30, until the triangular pattern is broken. At the same time, it should be noted that 3710-3700 below is still the key support.
Gold – Technical Outlook
Gold – Technical Outlook
🔴 Bearish Scenario (Downtrend)
* Pivot Level: 3759
* If price trades below 3759, continuation to the downside is expected.
* 🎯 First target: 3736 (strong support)
* If 3736 breaks → full bearish extension towards:
* 🎯 Next target: 3720
🟢 **Bullish Scenario (Uptrend)**
* If price breaks and holds above 3759, upside momentum will strengthen.
* 🎯 First target: 3770 (resistance)
* If 3770 breaks and holds on the 1H or 4H timeframe → strong bullish continuation towards:
* 🎯 Next target: 3791
---
📌 Note: At 3:30PM, a key market event may create high volatility in gold, potentially pushing price sharply depending on the reaction.

Waiting for the data to be released. Continue to fluctuate?Gold is experiencing a volatile downward trend. On the 4-hour chart, prices are currently under pressure at $3,765. The short-term rebound has completed its technical pattern repair, suggesting further downward movement. The 1-hour chart shows prices trading near short-term support, while the short-term moving average has flattened downward, indicating weakening short-term momentum. Focus on the resistance area around 3,750-3,755 in the short term, while support remains around 3,715.
Gold is currently experiencing small fluctuations. Quaid recommends maintaining trading within the 3,755-3,715 range pending the release of the PCE data.
New analysis and trading strategies will be provided after the data is released.
Gold - Sell near 3753, target 3740-3722Gold Market Analysis:
Yesterday, gold saw both buying and selling, and the market began a period of volatile correction, fluctuating up and down. This is a sign that markets can never rise continuously. When prices tire of rising, they need a break and a pause to recover. This is a normal technical correction after a significant surge. Today's strategy is for short-term volatility, with the broader trend bullish. The range of this correction is a bit unclear, so we can target the upper and lower highs of the 1-hour chart. The daily and weekly charts are closing today. Barring any major surprises, the weekly chart will close with a positive candlestick pattern. Next week, gold will continue to rise, and buying will continue to push prices higher. 3791 isn't the high point of this wave; a break above 3800 is just around the corner. The hourly chart shows gold forming a triangle consolidation pattern. Today, we'll focus on a breakout of this correction. The hourly correction range is 3722-3762. Until this range is broken, we'll maintain a short-term volatile trend. If it does, we can follow the trend. Once the volatility ends, there will undoubtedly be a significant move, whether it's a decline or a breakout. If the Asian session rebounds first, we'll consider selling near 3753.
Support at 3732 and 3722, strong support at 3717, resistance at 3753 and 3758, strong resistance at 3762, and the dividing line between strength and weakness at 3753.
Fundamental Analysis:
This week's fundamentals have limited impact on the market. The US dollar has also begun to fluctuate. The market awaits new data to drive it. The Federal Reserve's interest rate cuts in October remain a key focus.
Trading Recommendations:
Gold - Sell near 3753, target 3740-3722

Analysis of gold price intraday trend!Market News:
Spot gold fluctuated narrowly in early Asian trading on Friday (September 26), currently trading around $3,750/oz. Following the unexpected decline in US initial jobless claims last week, investors awaited key inflation data that could influence the Federal Reserve's next interest rate move. Following the release of the initial claims data, gold prices plummeted to $3,722/oz. The market logic is clear: the better the economic performance, the more confident the Fed will be in slowing or even pausing its rate cuts, and the higher the opportunity cost of holding non-interest-bearing gold. Currently, all market participants are focused on the upcoming release of the US Core PCE Price Index for August. This is the Fed's preferred inflation indicator, and its performance will directly provide the most critical basis for the Fed's next move. Investors will also need to monitor speeches by other Fed officials and news related to geopolitical developments.
Technical Analysis:
The US dollar index rose sharply, reaching a nearly two-week high, closing up 0.58%. Spot gold prices fluctuated, repeatedly testing the $3,760 mark during the session before facing pressure. Gold is currently fluctuating within a broad range, with intense buying and selling activity. Key support is forming below 3718/22, while resistance is forming above 3758/62. Continue to monitor this range for the day. Technically, the daily chart is trading above and below the 5-day moving average, with the RSI indicator trading above 70. The short-term hourly and four-hour moving averages are converging, and the Bollinger Bands are gradually closing. Prices are converging within the mid-range, with the RSI consolidating towards 50. Gold is expected to continue its broad range-bound trading on Friday. The day's trading strategy remains to sell high and buy low, with short-term participation.
Trading Strategy:
Short-term gold buy at 3722-3725, stop loss at 3714, target at 3760-3780;
Short-term gold sell at 3762-3765, stop loss at 3774, target at 3730-3710;
Key Points:
First support level: 3737, second support level: 3722, third support level: 3704
First resistance level: 3762, second resistance level: 3788, third resistance level: 3805

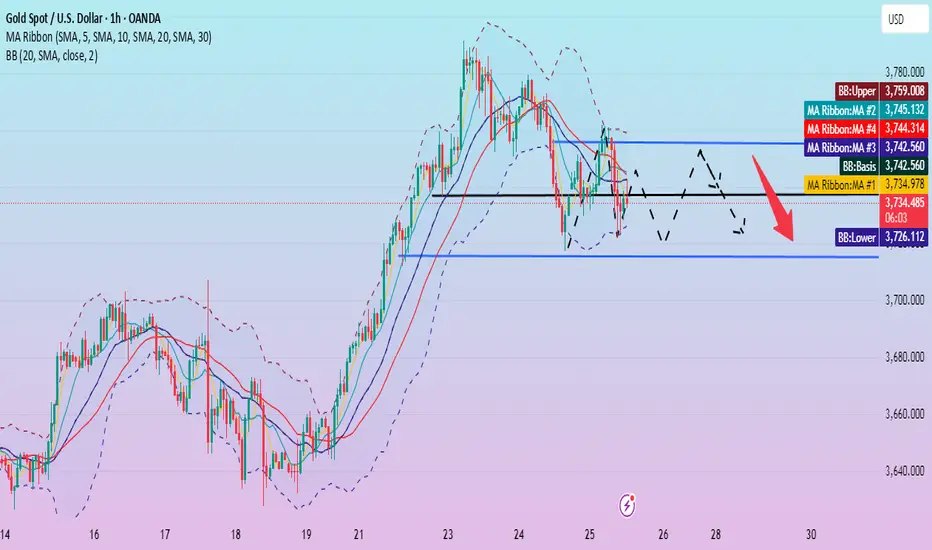
Gold is trading sideways. Focus on PCE data.Gold's 1-hour moving average continues to trend downward, and gold bears may continue to exert their strength. Although it remains volatile, the overall trend has begun to fluctuate downward, and each rebound in the 1-hour gold price has been under pressure.
On Thursday, the price briefly dipped below the 5-day moving average in Asian trading before stabilizing and rebounding. However, it broke below it again during the US trading session. Although it closed above the moving average, it failed to reverse the weak trend.
Currently, 3715 below has become the core support level. If it breaks through this position downward, the adjustment space may open further. The upper resistance will primarily focus on the pressure near 3760. If this position cannot be broken through strongly, the weak and volatile tone will continue.
Trading strategy:
Short around 3760, stop loss at 3770, profit range 3730-3720.
Short around 3760, stop loss at 3770, profit range 3730-3720.
Maintain this strategy before the release of the US PCE data. After the data is released, observe market trends and adjust the strategy.

Is the correction over? Has the low been reached?This price correction began near the upper Bollinger Band at 3760, reaching a low near the lower Bollinger Band at 3722. It's currently rebounding slightly and trading near the middle Bollinger Band. The 1-hour MA20 moving average is converging with the middle Bollinger Band, indicating the possibility of further price adjustments in the short term.
Gold's 1-hour moving average is sloping downward, and the price is currently fluctuating around the low of 3735. Despite the bearish US initial jobless claims data, gold prices did not fall. Instead, they rebounded from around 3722 to 3745 before falling under pressure. As of now, it has not broken through the important support level of 3715. This level is a key focus in the short term.
From the 4-hour perspective, the effective support below is still maintained around 3715, which is consistent with the 1-hour line support. The upper pressure is focused around 3755. The short-term operation strategy of maintaining range fluctuations remains unchanged.
Trading strategy:
Go long around 3715, stop loss at 3705, profit range 3740-3750.
Short around 3755, stop loss at 3765, profit range 3725-3710.
The price fell as expected. Waiting for a rebound?Gold prices fell as expected. Quaid recommends maintaining the strategy and waiting for a rebound before continuing to short.
The 1-hour moving average has begun to turn downward, and gold bullish momentum is gradually weakening. US data is slightly bearish, and short-term fluctuations and declines will continue. Despite a slight rebound to 3745, downward pressure remains. Currently, the price is suppressed by the downward trend line, so shorting is still necessary for rebounds.
Gold bullish momentum is gradually weakening. Following the market trend and executing a short-selling strategy at the rebound high is market insight.
The short selling strategy near position 3755 remains unchanged, waiting for a rebound to continue short selling. If you want to trade aggressively, you can go long with a light position around 3715, and the profit point is above 3735.

A weak rebound? Bearish sentiment persists.Gold saw a correction in the market on Wednesday, starting to decline after rebounding from the high of around 3778 in the European session and continuing into the U.S. session. The lowest point was around 3717, a drop of about 60 US dollars, which was also a heavy blow to the bulls in the recent continuous market.
In a pattern of significant gains, without a significant correction, upward momentum will eventually falter. The previous day's high and Wednesday's early Asian session levels also act as key resistance points for bulls. After hitting 3717 in the US market, prices are currently rebounding.
Considering the previous gains, the current pullback is not significant. Key resistance is currently around 3755, a key short-term watershed. In the short term, try to short at this position and wait for the second pullback correction. Quaid recommends maintaining short positions near 3755. If there is a significant upward movement in the European session, consider adjusting positions before the US market opens.
Trading strategy:
Short around 3755, stop loss at 3765, profit range 3730-3720-3700.

Gold - Sell around 3750, target 3720-3700.Gold Market Analysis:
We sold at 3742 in today's Asian session and have already made a profit. Gold is no longer in a one-sided rally and has begun a major correction. We need to follow the trend and trade at the right pace. We are now entering a major trend. The most common questions we receive are: has a major decline begun? Has gold peaked? The daily chart closed with a negative candle yesterday, and the previous trading day also formed a vague tombstone candlestick pattern. At this point, we can only confirm short-term resistance, but we cannot confirm that the overall trend has peaked or that the weekly chart is bullish. Furthermore, the short-term correction has not yet disrupted the bullish trend in the 4H. Today, we will focus on gains and losses at 3700. A break of this level will trigger a sell signal on both the 4H and daily charts. Strong support in the 4H is around 3717. This level is supported by the 30-day moving average and also serves as a support pattern. Remember, the low point of a major pullback was around 3712? The reason why it rebounded so quickly yesterday was because it hit strong 4H support. Gold is unlikely to decline directly today. I predict a correction first, and then a rebound near 3717. If it breaks, watch out for large buys, as this could signal another surge.
Resistance levels are 3751 and 3763, with strong resistance at 3773. Support levels are 3700 and 3717. The dividing line between strength and weakness is 3751.
Fundamental Analysis:
Gold surged and then retreated. The US dollar rebounded sharply after hitting a bottom. No major market data was released, and the Fed's policy action had no sustained impact on the market in the short term.
Trading Recommendation:
Gold - Sell around 3750, target 3720-3700.

Gold prices plummet! Analysis of the intraday gold price trend!Market News:
In early Asian trading on Thursday (September 25), spot gold prices fluctuated narrowly, currently trading around $3,750 per ounce. As investors digested comments from Federal Reserve Chairman Powell, the US dollar and US Treasury yields strengthened, sending international gold prices sharply lower. Powell signaled a cautious outlook for rate cuts, noting that the Fed must continue to balance the risks of high inflation and a weak job market in future rate decisions. Furthermore, Trump presented a Gaza peace outline to Arab leaders, the Russian and US foreign ministers reiterated their commitment to a peaceful resolution to the Ukraine crisis at a meeting, and the EU and US reached a tariff agreement, significantly cooling market risk aversion. Looking ahead, the market's attention is focused on two key US economic data releases later this week, which will provide further clues to the Fed's policy path and directly influence London gold prices. Thursday will see the release of weekly initial jobless claims data, while Friday's release of the US core personal consumption expenditures (PCE) price index, the Fed's preferred inflation indicator, will draw even greater attention.
Technical Analysis:
The US dollar index continued its upward trend during the day, briefly approaching the $98 mark. Gold prices adjusted under pressure, closing with a negative candlestick pattern on the daily chart. It retreated to the 5-day moving average at 3718, finding support at 3736. Since Tuesday's overbought top divergence from the RSI on the daily chart, gold has adjusted by over $70. Currently, the price of gold on the daily chart remains above the 10-day and 7-day moving averages, trading above 3700 and 3710, respectively. On the short-term four-hour chart, the price has retraced to the middle Bollinger Band, with the RSI indicator simultaneously adjusting to the 50 level to find support. The moving average formed a downward crossover at the high of 3767. Gold trading today is expected to continue with a wide range adjustment. Sell high and buy low, with the initial focus on the 3720/3760 range.
Trading strategy:
Short-term gold: Buy at 3717-3720, stop loss at 3708, target at 3750-3770;
Short-term gold: Sell at 3772-3775, stop loss at 3784, target at 3730-3710;
Key points:
First support level: 3732, second support level: 3720, third support level: 3713
First resistance level: 3763, second resistance level: 3780, third resistance level: 3800

Gold prices are correcting and entering a period of volatility.Gold prices rebounded slightly after a sharp drop on Wednesday and are currently fluctuating slightly.
From a news perspective, speculation about the continued effectiveness of the Federal Reserve's rate cuts and the entry of global central banks into an era of monetary easing have led to a depreciation of the US dollar, while non-US currencies have temporarily appreciated due to the depreciation of the US dollar. Excessive money supply will also lead to global currency depreciation.
Gold prices have continued to fluctuate at high levels, testing support at 3750 and 3715. However, they are still some distance from a top-bottom reversal. However, the upward rebound in early Asian trading coincided with a new top-bottom reversal, with resistance concentrated around $3750.
There are currently two positions that need attention, the pressure position of 3750 and the support position of 3710. If either direction is broken within this range, the trend will continue. Short-term volatility is a normal trend, and we should accept this periodic correction.
On Thursday, Quaid recommends a light short position at 3750, with a move to long positions appropriate if the price touches 3710-3715. Focus on a breakout of the 3750-3710 range.