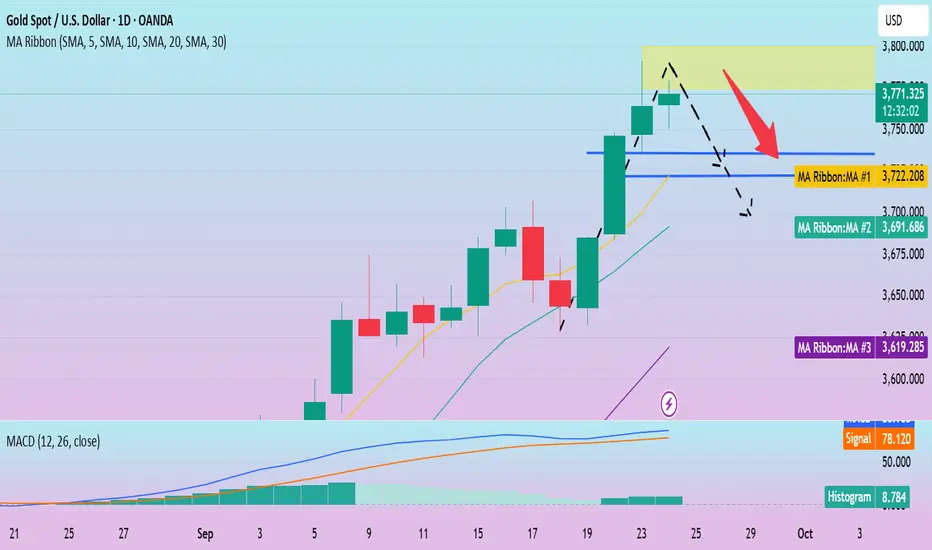
Prices fell. Has a low been reached?The daily gold chart suggests a continued bullish trend. Consecutive breakouts confirm continued upward movement. The MACD indicator remains within overbought territory, indicating a modest rise and not signaling a lack of upward momentum.
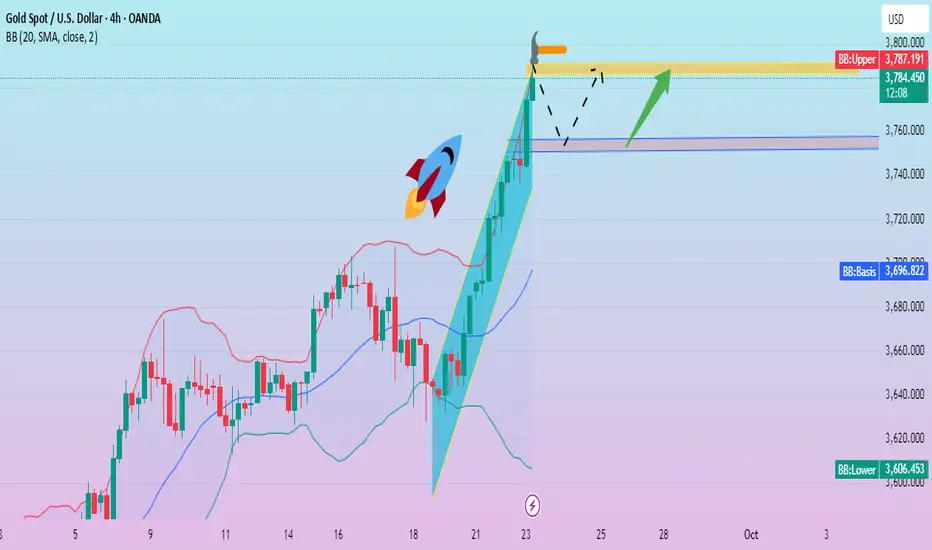
In the short term, the 4-hour chart also suggests an upward bias for gold. Technical indicators are extending gains within positive territory, with prices retreating to the middle Bollinger Band and now overlapping the 20-day moving average. The MACD indicator has formed a golden cross and is trending downward. Gold remains above the 20-day moving average. While the longer-term moving average maintains an upward trend, it remains well below the 20-day moving average. Most indicators suggest a easing of bullish momentum.
Prices are currently retreating. For stable trading, it is recommended to remain cautious and wait for a price low before entering a long position.
Of course, if aggressive trading is desired, long positions around 3725-3730 are still an option.
Goldpreis

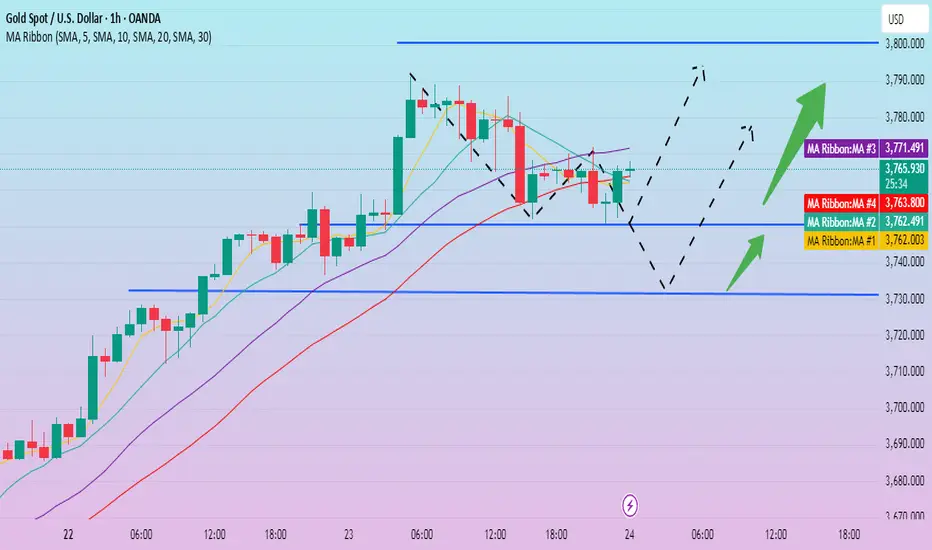
If the price remains below 3780, continue short selling.The daily chart closed with a long upper shadow, indicating a clear technical need for a correction. The Asian session fell as expected in the morning, repeatedly testing 3750. Those who followed the short selling could basically get nearly 150pips profit. Although a bullish structure appears in the hourly chart, the trend pressure above 3780 is still there in the short term. If gold fails to effectively break the trend pressure, it will fall back in the short term. The first support below can be seen at 3750. Once it falls below, gold will test the support of 3735. Currently, gold has rebounded again. As long as it fails to effectively break through and stabilize above 3780, we can still consider shorting gold.

Gold continues to fluctuate. Will it hit a new high?Information Summary:
Federal Reserve Chairman Powell delivered his first public speech since the September policy meeting. He stated that the Fed faces a challenging situation, with the risk of faster-than-expected inflation remaining. Job growth remains weak, raising questions about the health of the labor market.
Compared to the tone of the gold market last week, Powell's speech contained no significant content that could alter gold's upward trajectory. Geopolitical developments also provided support for gold prices. Expectations of rate cuts, concerns about the Fed's independence, and geopolitical developments all contributed to gold's strength.
Market Analysis:
Overall, gold's upward trend remains unchanged. After a slight pullback to 3750 on Wednesday, prices rebounded around 3780 before falling under pressure. In the short term, as long as gold does not fall below this week's 3735 starting point, the 3800 high remains a possibility. The upward trend remains intact, and long positions remain the main driver.
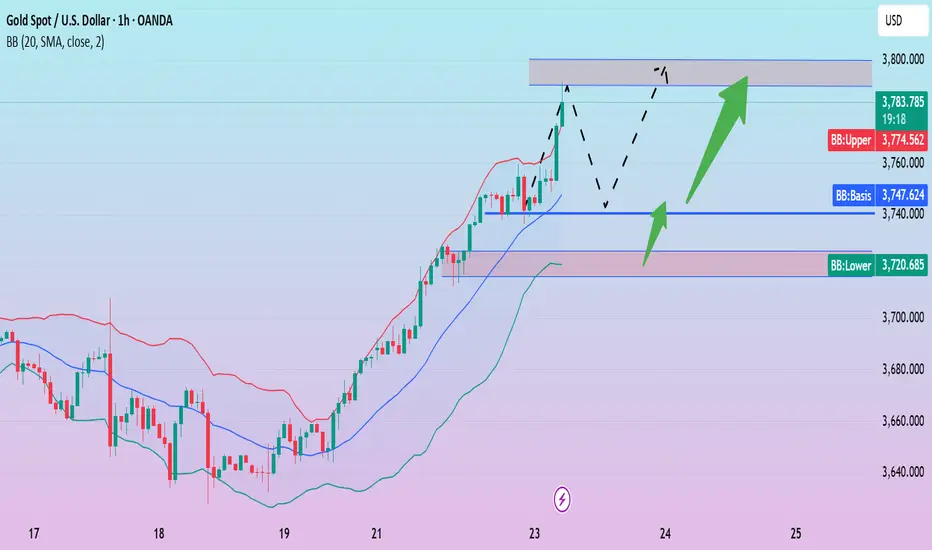
Looking at the 1-hour chart, the price retreated after encountering pressure at 3780, continuing to fluctuate slightly. Long positions are still possible around 3750 in the US market. If the US market continues to fluctuate, the 3800 mark may not be far behind.
Trading strategy:
Long positions at 3755-3750, stop loss at 3745, profit range 3780-3800.

Warning: Risk of a Price Pullback?Gold continued its upward trend on Tuesday, achieving its sixth consecutive weekly gain and breaking through new highs. The core driver of this significant rally is growing dovish market expectations for further Federal Reserve easing before the end of the year. Although the September rate cut has been priced in by the market, most investors predict two more rate cuts in October and December, providing strong support for gold prices.
From a technical perspective, the daily chart shows that gold is extremely strong, and the MACD indicator confirms the short-term bullish trend, but the indicator has deviated seriously and entered the overbought area, suggesting that there is a greater risk of technical correction in the later period. Focus on the support provided by the MA5 moving average below; a break below could trigger a deeper correction.
Traditionally, caution is advised. Short positions can be taken at highs with a small position. Upper resistance is expected to be in the 3790-3800 range, while lower support lies in the 3750-3735 range.
Trading Strategy:
Short at 3775, add to positions upon a rebound to 3785-3790. Stop loss at 3800. Profit targets 3750-3740-3730.
Buy gold near 3750, target 3768-3788Gold Market Analysis:
Yesterday's daily gold chart reached 3791. Our buy orders at 3643 and 3788 yielded huge profits. Gold's strength is so strong that it's making us question our own future. We currently don't see a peak. Yesterday's tail-end saw a pullback. The upper shadow on the daily chart is quite long, making it difficult to reach a new high today. The pullback in the Asian session also confirms that a correction will occur today. Yesterday's surge was excessive, requiring a technical correction. The indicators and chart patterns haven't kept pace, leading many investors to speculate on whether a peak has been reached. I believe it hasn't, and there's no definitive signal. A peak requires time and space to fully develop. Today's strategy is to buy and sell, as there's significant room for recovery. Consider buying low in the Asian session. Selling after the pullback is already underway is no longer feasible. We're unsure of the support level it will reach. Chart-wise, 3712 is the limit of this dive. If it unexpectedly breaks, we need to consider whether we've truly sold. Buy gold at 3750 in the Asian session. A break of this level would be unsatisfactory. It's a support level, a candlestick pattern, a point of yesterday's trading, or an indicator. Currently, it appears to be stabilizing. If it approaches the level again during the European and American sessions, buy more. The gold market will likely experience a period of volatility. Don't hold positions for too long. The likelihood of continued unilateral movement is low today. Resistance levels are 3781 and 3791, which are also selling areas.
Support levels are 3750, 3728, and 3712. Resistance levels are 3781 and 3791. The dividing line between strength and weakness is 3750.
Fundamental Analysis:
There are no major fundamentals or data this week, just standard data. Focus on the impact of the Fed's rate cut.
Trading Recommendations:
Buy gold near 3750, target 3768-3788

Continued volatility? What to do?Gold surged and then retreated on Tuesday, reaching a high near 3790 before retracing during the US trading session. While the gains were significant, even with the pullback, they haven't wiped out yesterday's gains. Therefore, the current trend isn't weakening, but rather remains strong. The slight pullback is merely accumulating upward momentum, not a top signal.
Gold rebounded after testing 3750 in early Asian trading. Short-term strength remains strong, and the pullback hasn't continued, leaving the overall trend strong. If prices stabilize above 3750 in the short term, there's a high probability of another surge. As long as they don't fall below 3730, long positions are still viable. Currently, there are no valid topping or bearish signals, nor are there any negative news.
Trading strategy:
Go long near 3750, add to your position at 3730, set a stop-loss at 3725, and target profit ranges between 3780-3790-3800.
XAU/USD(20250924) Today's AnalysisMarket Analysis:
Federal Reserve Chairman Powell stated that the policy rate remains somewhat restrictive, but allows the Fed to better respond to potential economic developments; tariffs are expected to have a one-time pass-through effect; and decisions will "never be based on political considerations." Fed spokespersons noted that Powell's comments indicate he believes interest rates remain tight, potentially opening the door for further rate cuts.
Technical Analysis:
Today's Buy/Sell Levels:
3763
Support and Resistance Levels:
3817
3797
3784
3743
3730
3709
Trading Strategy:
If the market breaks above 3763, consider entering a buy position, with the first target price being 3784.
If the market breaks below 3743, consider entering a sell position, with the first target price being 3730.

Gold rebound weak? A sharp correction?Information Summary:
NATO issued a strong warning regarding Russia's violation of Estonian airspace, heightening uncertainty in international relations. Gold, as a non-sovereign, default-free safe-haven asset, attracted significant safe-haven inflows.
US President Trump's statement, stating that Ukraine is expected to retake its former territory with NATO support, and his tough rhetoric regarding the Russia-Ukraine situation further rattled market sentiment. Meanwhile, during the UN General Assembly, he met with Muslim leaders from various countries to discuss the Gaza conflict and other issues, and these developments also caused significant fluctuations in gold prices.
Market Analysis:
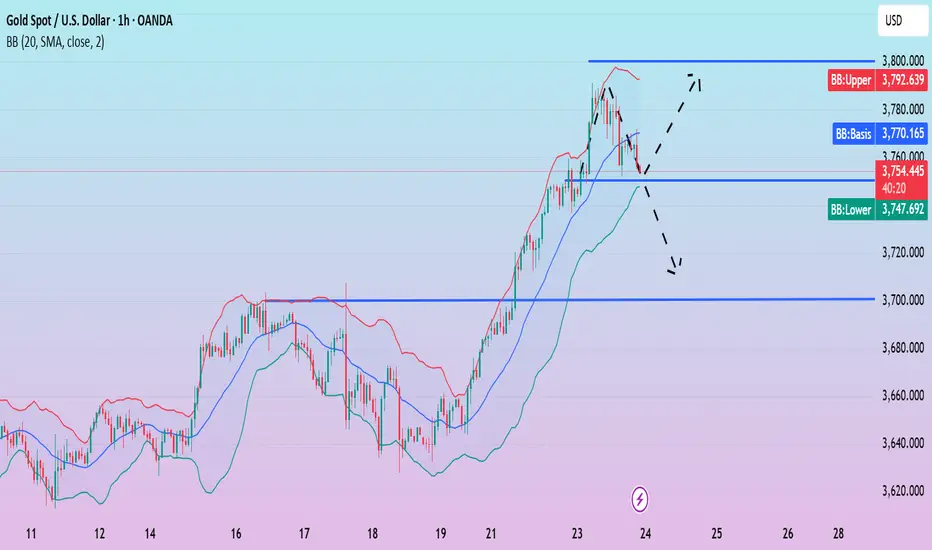
Gold rose and then retreated on Tuesday, closing with a bullish candlestick pattern with an upper shadow. This candlestick pattern reveals two signals. From a bullish perspective, the real body of the bullish candlestick indicates that the overall market still has upward momentum, and the rise and fall have not completely reversed the short-term strong trend. However, the trend indicates resistance near 3790. Selling pressure has significantly increased near this key resistance level, and a brief tussle between bulls and bears has begun in this area.
Quaid believes that the short-term focus should be on market corrections. The current price correction is about to touch the lower track of the Bollinger band. If it stabilizes above 3750 in the short term, the price is expected to hit 3800 again. If the rebound in this correction is weak, the price will most likely retreat and touch 3700.
Gold remains strong. Latest analysis.Gold continued its upward trend, breaking all-time highs several times, reaching as high as 3790.97. It traded around 3780 in early US trading. Following the Federal Reserve's 25 basis point rate cut last week, market expectations of further easing this year, coupled with geopolitical uncertainty, have fueled demand for safe-haven and inflation hedging, pushing gold prices to explore a new equilibrium range.
The 1-hour chart shows that gold prices have recently been rallying around the middle Bollinger Band. Early in the Asian session on Tuesday, the price continued its upward trend, retreating slightly to touch the middle Bollinger Band before stabilizing and continuing its upward trend. It retreated in the European session, but remained stable near the middle Bollinger Band before rebounding to an Asian high of 3759.
Currently, the European session has broken through the highs strongly, and the US session is likely to continue its upward trend. A pullback near the 10-day moving average is expected, and above the middle band, the bullish trend remains. Considering the crossover points, the 3770-3760 area is a key focus. If it stabilizes, the bullish trend will continue, with the profit range focused on 3790-3800. A strong upward breakthrough could potentially reach the 3800 mark. Otherwise, a strong upward breakthrough will likely continue, and a volatile upward trend will likely persist.
Short-term trading strategy:
Go long around 3760-3770, stop loss at 3750, profit range 3790-3800.

How to accurately arrange long and short positions?Gold is currently standing firmly above the 3750 line, with a maximum impact of 3791, just one step away from the 3800 mark. The overall bullish momentum has not weakened. If gold can continue to stabilize above 3750, it means that the 3800 mark will most likely be tested. The short-term market is still in a strong bullish pattern. We are currently focusing on the 3760-3750 support zone. If this area can effectively stabilize, it will be an ideal entry point for short-term bulls and has a strong reference value. From the 4-hour cycle, the effective support below is maintained in the area around 3760-3750, while the upper pressure is at the 3800 mark, which is the key balance point between a strong breakthrough and a technical pullback. In terms of operating strategy, it is still recommended to maintain the idea of "low-long as the main and high-short as the auxiliary". Specifically, if the price falls back to 3750-3760 without breaking through, you can go long with a light position, and target around 3800 first; if the price touches the 3800 area, you can try to go short with a light position, but you must enter and exit quickly and strictly control the stop loss; in the middle position, you should wait and see, watch more and do less, to avoid repeated consumption of funds by range fluctuations. Overall, the current bullish trend of gold still dominates the market, but as the price gradually approaches the integer mark, market volatility may intensify. Short-term operations must be steady and cautious, control the rhythm, wait for key points to enter the market, and respond flexibly. This is the core idea at the current stage.
Market fluctuates repeatedly, focusing on Powell's speechLast night, gold still did not provide an opportunity to pull back and go long. Instead, it continued to rise near the end of the trading day. Gold rose again after opening this morning and once approached 3760 before falling back, maintaining a narrow range of high fluctuations during the day. The daily line closed with a positive sign, but the MA5 and MA10 moving averages did not move up accordingly, indicating that yesterday's rise in gold was purely caused by news. At this time, we should be more vigilant about gold rising and falling. Pay attention to the upper pressure of 3760-3770. If gold touches the upper side again in the short term and encounters resistance and pressure, aggressive investors may consider shorting with a light position and waiting for a pullback. The focus below is 3730, which was the trend suppression yesterday and also the dividing point between short-term gains and losses for bulls and bears. A more conservative approach is to wait for a pullback to 3740-3730 before buying gold.

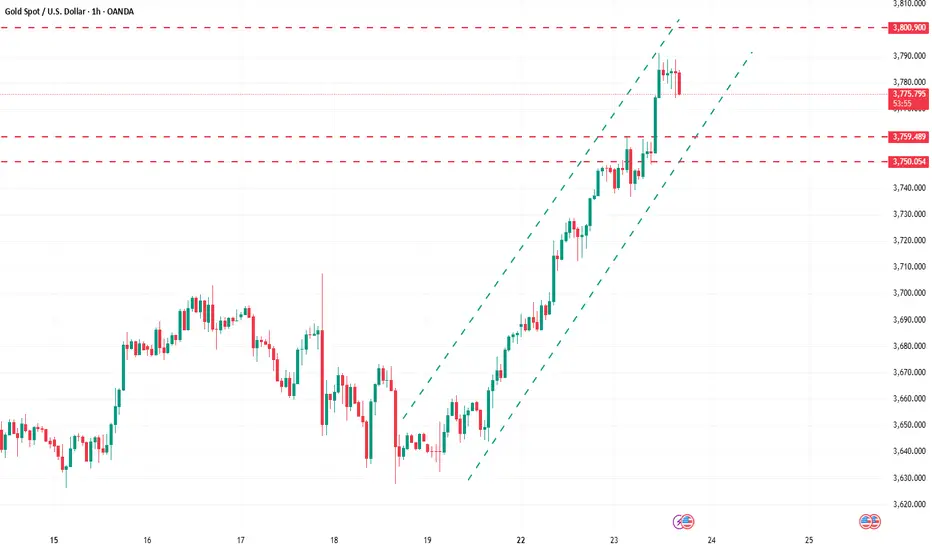
Gold breaks through. Watch for key support levels.Gold continues to strengthen this week, hitting new all-time highs. So far, it has reached around 3791 and is currently fluctuating at a high level.
Looking at the 4-hour chart, the Bollinger Bands continue to open upward, and gold will continue to run on the upper track of the Bollinger Bands in the short term. After a slight pullback, gold continues to strengthen. There may be periods of short-term volatility and pullbacks. A pullback will focus on the strong support at 3755. A small long position is recommended when the price retreats to this area. The profit range is 3775-3790.
Gold is going crazy. Will it continue to break through?Gold hit a new all-time high near 3758 on Monday; on Tuesday, prices continued their relentless rise, currently reaching a high near 3791.
From a technical perspective, the Bollinger Bands have opened upward again, and the price is continuing to move within the upper Bollinger Bands, suggesting continued short-term gold gains. Gold is trading upwards, supported by the MA5 moving average. The trend is clear, with minimal room for correction. There's no strong resistance above. The 3780 resistance level I mentioned in the Asian session was strongly broken through in just five hours.
Short-term trading remains bullish, with support below the 1-hour line around 3735, and further retracement focusing on the 3725-3715 area. On the whole, the short-term operation strategy for gold is to mainly go long on pullbacks and short on rebounds. The short-term focus on the upper side is the 3790-3800 resistance, and the short-term focus on the lower side is the 3750-3740 support.
Gold prices surge! Analysis of intraday gold price trends!Market News:
On Tuesday, as market expectations for further Federal Reserve rate cuts grew, spot gold prices surged dramatically, reaching a record high. The rise in London gold prices stemmed from a combination of policy, macroeconomic, and geopolitical risk factors, reflecting the market's conflicting mood between exuberance and panic. Amidst rising global risks and uncertainties, international gold is becoming a "must-have" investment for investors. Global central banks continue to increase their gold reserves, coupled with continued inflows into gold ETFs, demonstrating continued strengthening demand for gold as a strategic investment by institutional investors. This trend has been a key driver of international gold prices over the past few months. At the same time, the risk of a potential US government shutdown has risen again. These uncertainties have heightened gold's safe-haven appeal. The war between Russia and Ukraine appears far from over, further driving up gold prices. Several Federal Reserve officials will speak this week, with the market focused on Friday's release of the core PCE price index. A continued decline in inflation data would reinforce expectations of further rate cuts in October and December. A low interest rate environment helps reduce the cost of holding gold, significantly increasing its appeal.
Technical Analysis:
Gold prices maintain a strong bullish trend, with the daily chart maintaining a strong bullish trend and reaching a new all-time high. The continued weakness of the US dollar further boosted buying momentum for gold and silver. On the daily chart, gold broke through 3750, reaching a new all-time high. Yesterday, the price of gold rose by over $75 per ounce. The latest 10-day and 7-day moving averages continue to trend upward, and the price is trading within the upper Bollinger Band. The short-term four-hour moving averages are trending upward, as are the Bollinger Bands. At this rate of increase, gold prices could soon reach 3800. This simplified market trend suggests buying low on pullbacks, with selling at key resistance levels supporting historical highs. Trends are king, and yesterday's continued declines and repeated buying demonstrates our trend-following strategy. Today's target is 3733/26, watch for low-price buying opportunities!
Trading Strategy:
Short-term gold: Buy at 3730-3733, stop loss at 3722, target at 3760-3780;
Short-term gold: Sell at 3780-3783, stop loss at 3792, target at 3650-3630;
Key Points:
First Support Level: 3735, Second Support Level: 3720, Third Support Level: 3703
First Resistance Level: 3766, Second Resistance Level: 3780, Third Resistance Level: 3800

Gold fluctuated slightly. Waiting for an opportunity?Gold fluctuated upward on Monday, stabilized in the Asian session, and saw a sharp rise in the European and American sessions. The market on Monday continued the strong performance of last Friday, and gold performed strongly in the short term.
After recently breaking through the key resistance level of $3,703, gold broke through the previous high and set a historical high of $3,758. The $3,700 integer mark has changed from a resistance level to an important support level. The gold hourly moving average has formed a golden cross upward. The gold bulls are very strong upward. The gold highs are constantly being refreshed. The price pullback is an opportunity to go long.
From the 4-hour chart, the effective support below is maintained at around 3720-3725, and the key pressure above is maintained at 3770-3780. The resistance after breaking through will move up to the 3800 integer mark.
Trading strategy:
Go long around 3725, cover at 3715, stop loss at 3700, profit range 3750-3760-3780.

Gold remains strong. 3800?In Tuesday's Asian session, gold hit around 3758 before retreating and currently fluctuating around 3743. While gold continues to hit new highs, the bullish trend remains. Monday's analysis suggests that after breaking through the resistance level of 3745, the upward trend will reach 3760, a level it has successfully reached.
The current market environment is characterized by geopolitical instability, rising risk aversion for gold, and the impact of the Federal Reserve's interest rate cuts. Therefore, gold is unlikely to experience a significant decline in the short term. Therefore, based on the strength of the trend, it is expected to rise to a high of 3780 in the short term. Further upward movement will only reach the 3800 level.
From a technical perspective, the Bollinger Bands on both the daily and 4-hour charts show strong unilateral strength, with continued upward breakthroughs and minimal corrections. In short-term trading, observe the changes in small cycles. The support point below the hourly line is around 3735. If the adjustment is too strong, it can be seen around 3710 below. In the short term, it is recommended to go long when it falls back to the 3735-3710 range.

It's not time to short yetWhat is risk? It's not fear or worry, but rather a lack of understanding and direction.
Adjustments during an uptrend are normal. Short-term trading isn't about the overall direction, but rather the day itself. The focus within a day is on predicting key resistance and support levels.
Since the Federal Reserve's interest rate decision, gold prices have failed to reach $3,700 for the second time, ultimately falling rapidly. The market has begun to question the rise and fear a deeper correction.
This concern is not misplaced. Gold prices have risen by $400, so mid-term adjustments are normal.
However, for gold to go from strength to weakness, it will inevitably experience fluctuations first; don't expect a sudden turn to extreme weakness.
The top always appears when the market is buzzing! From this theoretical point of view, 3,700 isn't too high.
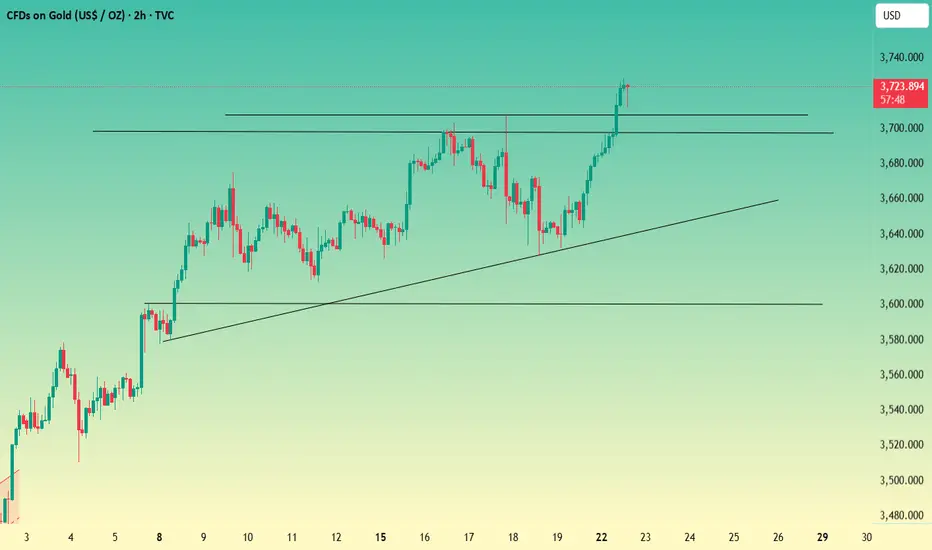
From the 2-hour chart, gold prices saw a breakout, reaching a new high of 3,728 before retracing. Currently, support at 3,708 is the target. If it falls below, the target is 3,697, the starting point of this rally.
Gold strategy: fall back to the 3700 line, light long position, target 3725, continue to hold if it breaks through.
Bullish Trend? Pullbacks as Opportunities?From the daily chart, gold has successfully reversed its previous weakness and firmly established itself above all major moving averages, demonstrating a clear bullish trend. Although gold prices may experience short-term high volatility, any pullbacks are expected to be limited.
Strong support has shifted to around 3700. The market is likely to maintain its upward momentum from this level until it breaks below. The primary upside target is 3745, and a break above this level will target the strong resistance area of 3760.
Gold prices continued to rise in the US market, with no signs of a pullback from the 3734 high. The 1-hour moving average remains bullish. Quaid believes that the current trading strategy remains to follow the market. The primary strategy is to wait for a pullback to around the 3715 support area to look for long opportunities. However, caution is advised regarding the current significant resistance level, as this level could potentially form a top and trigger a technical pullback.
Trading Recommendations:
Short at 3740-3745, stop loss at 3755. Profit range: 3720-3710-3700.
Go long on a pullback to 3710-3715, stop loss at 3700. Profit range: 3730-3750.

XAU/USD(20250919) Today's AnalysisMarket News:
On Thursday, the U.S. reported its largest drop in initial jobless claims in nearly four years, reversing the previous week's sharp increase. (Note: Hours after the data was released, news broke that North Carolina's continuing claims data had been incorrectly and significantly understated by over 19,000. A Labor Department spokesperson stated that the matter is still under investigation.)
Technical Analysis:
Today's Buy/Sell Levels:
3648
Support and Resistance Levels:
3692
3676
3665
3631
3620
3603
Trading Strategy:
If the price breaks above 3648, consider entering a buy position, with the first target price being 3665.
If the price breaks below 3631, consider entering a sell position, with the first target price being 3620.

Overestimate and undervalue, opportunities abound!The range operation ideas we shared have been verified to be correct again. We have perfectly grasped the market rhythm by going short first and then long. Congratulations to friends who are paying attention. After the US market, gold fell to the key support area of 3630-3620 and then rebounded quickly. At present, we continue to focus on the short pressure position of 3670-3690. This position is not only the pressure near the 5-day line, but also the upper pressure area of the hourly chart moving average band. In the short term, it may become the core area of the bull-bear game.
Although the interest rate cut has been implemented, the market focus has shifted to whether the pace and magnitude of future rate cuts will increase. The marginal benefits to bulls are weakening. Therefore, the short-term recommendation is still to sell high and buy low in the range, and not to chase highs and sell lows. If your recent operations are not ideal, or you want to make your investment more stable, you are welcome to communicate with me at any time, and I will help optimize the strategy.
From the 4-hour level, 3630-3620 is still the key defensive support level. If it falls below this area, the bullish and bearish pattern in the future market may change; and 3670-3690 is still a strong pressure. Strategically, we will continue to use this range as the core for long and short layout. In the middle position, we should watch more and do less, and wait patiently for the key points before entering the market to avoid unnecessary risks brought by frequent chasing orders.
Gold operation strategy: When it falls back to the 3630-3620 area, lightly arrange long orders, and first target 3660-3670. When it touches the upper pressure, you can gradually reduce the position and take profit to provide protection.

Has gold reached its peak?The Federal Reserve's meeting met expectations with a 25 basis point interest rate cut, which did not significantly stimulate the market.
Meanwhile, the market expects two more rate cuts in November and December this year. Gold briefly surged lower before retreating sharply. Is this a top or a normal correction in the bull market? The key to judging whether a market trend has ended is to look at the strength of the pullback.
From a technical perspective, the price of gold has fallen below the 5-day moving average and is currently between the 5-day moving average and the 10-day moving average. The focus below is on the support formed by the 10-day moving average. The support level is currently in the 3645-3640 range, and this range is also yesterday's low point. Gold's ability to hold above the 10-day moving average remains to be seen. If it holds, it is expected to continue its upward trend. Focus on the 3680 first-line pressure level. If it breaks through this pressure, gold is expected to hit above 3700 again. A break below 3645 could lead to further declines to the 3620-3600 range.

With the meeting coming, will gold prices soar or plummet?Technical analysis of gold: Judging from the current trend, gold is approaching the 3700 mark. Bulls are surrounding it but not attacking, waiting for guidance from the Federal Reserve's interest rate decision. Overall, gold has risen by nearly $400 since it rose from 3311. For now, it is still in a bullish trend. Don't easily say it has reached the top before the trend reverses. From a technical point of view, the intraday support point is reflected in the daily cycle. On the unilateral moving average of the H4 cycle, the lower support is in the 3660-3650 area. You can just focus on these two points and go long. In principle, we don’t guess the top of the upper space, but the visible target is expected to be around 3710-3720. If it continues to rise, it may even reach 3730. After a phased rise during the U.S. trading session, we will see whether we can keep long positions and wait for the Federal Reserve's interest rate decision based on actual conditions. The Federal Reserve will definitely cut interest rates this time, but the first rate cut will not be a large-scale release of money. It is expected to cut interest rates by 25 basis points. The market performance is to sell expectations and buy facts. The current rise in gold from the end of August to September has achieved expectations. Therefore, after the actual confirmation of the rate cut, the market is expected to move in the opposite direction because the expectations have been fulfilled, and the historical performance is the same. To sum up the above: for the lower support, first pay attention to the area around 3660, and continue to look up to the 3680-3690 area. If the support is broken strongly, you can participate in long positions in the 3630-3620 area. At present, pay attention to the area around 3685-3695 in the short term and try to short. On the whole, the short-term strategy for gold today is still to arrange long positions on dips, supplemented by light positions in short positions when it rebounds to key resistance levels. The short-term focus on the upper side is the 3700-3720 line of resistance, and the short-term focus on the lower side is the 3660-3650 line of support.

My short followers cheer for the victoryThis is the trading idea I provided in my previous article. Clearly, the gold price movement has been in line with my expectations and has started to decline, earning us a considerable amount of profit from this short-term trade. www.tradingview.com Seven hours ago, I once again suggested opening a short position at 3695. The market has now dropped to around 3680, and we have once again reaped a good amount of profit.
During this round of strong and rapid rise in gold prices, there are traders who have made considerable profits by following the trend, while there are also many who have held short positions against the trend. I believe the latter situation is quite common. Some have already given up halfway, while others are still struggling. So, no matter which situation you are in now, you can follow me and share your entry point in the comment section. I will analyze and reply to each one, helping you turn losses into profits. Welcome to join my free camp.
TVC:GOLD FX:XAUUSD OANDA:XAUUSD BITSTAMP:BTCUSD COINBASE:ETHUSD
