“Distribution? Maybe. Reversal? Nah. Just liquidity doing yoga.”Dear Goldies, ✨
Ten straight weeks — gold has climbed without looking back.
But every rally meets gravity, and this one now stands at the top of its own empire.
Above 4,000, price breathes thin air — a zone where profit-taking becomes a language, not a choice.
The macro trend remains bullish, yet momentum is stretched.
Price sits high above its 21–50 EMA band, RSI prints divergence — the signature of an overextended leg.
This isn’t weakness — it’s distribution inside strength. The first calm breath after a ten-week sprint.
🟡 Gold (XAUUSD) Structural Outlook
Macro Bias: Bullish, corrective phase
Gold trades deep within the premium range (4,050–4,180) — a historical supply.
Above 4,180 → 4,280–4,380 expansion
Below 3,720 → 3,420–3,300 re-accumulation
⚖️ The battle zone sits between 4,050–3,720, where liquidity decides control.
Weekly View:
Control Zone: 3,980–3,900
Supply: 4,050–4,130
Demand: 3,740–3,640
Soft USD = possible fake-out toward 4,185–4,260 before cooling.
H4 View: Compression → Expansion
Above 3,900: bullish rotations → 4,025 → 4,125 → 4,180
Below 3,900: correction → 3,840–3,700
H1 Intraday:
Main Supply: 4,045–4,065
Flip Zone: 4,015–4,030
Demand OB: 3,965–3,975
Sweep Zone: 3,945–3,925
Final Defense: 3,875–3,895
🎯 Tactical Paths:
🔼 Reclaim 4,030 → 4,065 → 4,105
🔽 Lose 3,975 → 3,945 → 3,875
🧭 Summary
Gold’s macro remains structurally bullish, but price is testing the top of its own range.
Expect engineered sweeps before FOMC as liquidity builds both sides.
4,050–4,180 → premium supply
3,900–3,740 → tactical demand
🦅 Patience > Prediction.
Reaction reveals intention — expansion follows timing.
Disclaimer : For Educational Purposes Only
Goldpriceanalysis

Gold battles within 3,860–3,900 Hello Goldies, ✨
Gold locks another bullish weekly close, extending its climb into high-altitude territory with barely a pause since mid-summer. The market now stands in a tactical battlefield — with buyers defending momentum while sellers quietly prepare to fade the top.
Gold’s broader structure remains clean and bullish, printing higher highs and higher lows since early 2024. However, price now trades deep inside the weekly supply belt (3,860–3,900) — a zone where liquidity historically transitions from accumulation to distribution.
Momentum stays firm, but upper-wick reactions and short-bodied closes hint at early exhaustion. The EMA stack (5–21–50) keeps control with the bulls, though the structure is primed for either a healthy pause or a short-term retracement before the next impulsive leg.
Macro & News Context 🌍
This week brings a USD-heavy calendar:
multiple FOMC speeches (Powell, Bowman, Barr, Kashkari), Unemployment Claims, and the all-important Non-Farm Payrolls (NFP) on Friday.
Soft U.S. data continues to weigh on the dollar, while gold benefits from falling yields and elevated geopolitical risk. However, a hot NFP print or hawkish tone from Powell could briefly lift the dollar and trigger a technical correction in gold.
Expect event-driven volatility — fast rotations as markets recalibrate expectations around future Fed rate cuts.
🟡 Weekly Gold Outlook – Bulls at Altitude, Momentum Fading
Bias: Bullish, but stretched
Key Weekly Zones:
🟥 Supply: 3,860 – 3,900 → Major resistance pocket; potential distribution area
⚪ Mid-Control: 3,700 – 3,740 → Tactical pivot; must hold for continuation
🟦 Demand: 3,440 – 3,480 → Structural re-test zone from prior breakout
🔼 Above 3,900 → Expansion toward 3,940–4,020
🔽 Below 3,700 → Correction toward 3,480
🔵 Daily Structure — Bullish but Hyper-Extended
Gold trades inside premium territory (3,875–3,905), where rejection tails and volume absorption reveal fading strength.
The 3,820–3,850 base remains the near-term lifeline — a break below it could trigger a 300–500 pip washout into lower demand layers.
Daily Zones:
🟥 Supply: 3,875–3,905 → Premium ceiling
🟦 Demand: 3,820–3,850 → Micro base | 3,720–3,750 → Immediate re-test
🔼 Above 3,905 → Extension toward 3,940–3,970
🔽 Below 3,750 → Correction phase confirmed
🟢 H4 Flow — Compression Before Expansion
Structure remains bullish but congested under 3,900.
Equal highs and tight-bodied candles signal compression — a volatility coil that will define this week’s direction.
H4 Zones:
🟥 3,880–3,900 → Immediate supply
🟦 3,820–3,840 → Short-term demand
🟦 3,760–3,780 → Re-test zone
🔼 Break above 3,900 → Targets 3,920–3,940, then 3,960–3,980
🔽 Break below 3,820 → Opens rotation to 3,760–3,780
🔸 H1 Tactical View — Decision Box Active
The 3,860–3,895 range forms this week’s tactical decision zone — a battleground between fading momentum and bullish control.
Bulls still hold structure, but exhaustion is visible; another failed breakout could trigger a deeper correction.
H1 Key Pivots:
🔼 3,885–3,895: Short-term cap → breakout unlocks 3,910–3,930
🔽 3,860–3,875: Near-term floor → break below opens pullback to 3,820–3,840
⚙️ Above 3,905 → Expansion
⚙️ Below 3,820 → Correction
⚙️ Between 3,860–3,895 → Compression zone — patience required
Summary
Gold remains structurally bullish but stretched at altitude.
The 3,860–3,895 pocket is the tactical decision belt — the level that will define whether the market expands into new highs or breathes out for a well-deserved correction.
🎯 Above 3,905 → Continuation
🩸 Below 3,820 → Correction
⚖️ Between → Compression until catalyst resolution (FOMC / NFP).
Disclaimer: For educational context only.

XAU/USD 30 September 2025 Intraday AnalysisH4 Analysis:
-> Swing: Bullish.
-> Internal: Bullish.
Price printed as per yesterday's intraday analysis whereby I mentioned in alternative scenario that price could print higher.
Price is currently trading within an internal low and fractal high. CHoCH positioning is denoted with a blue horizontal dotted line.
Intraday Expectation:
Price to print bearish CHoCH to indicate bearish pullback phase initiation, price to then trade down to either discount of internal 50% EQ, or H4 supply zone before targeting weak internal high priced at 3,871.890.
Alternative scenario: Price could potentially print higher-highs.
Note:
The Federal Reserve’s sustained dovish stance, coupled with ongoing geopolitical uncertainties, is likely to prolong heightened volatility in the gold market. Given this elevated risk environment, traders should exercise caution and recalibrate risk management strategies to navigate potential price fluctuations effectively.
Additionally, gold pricing remains sensitive to broader macroeconomic developments, including policy decisions under President Trump. Shifts in geopolitical strategy and economic directives could further amplify uncertainty, contributing to market repricing dynamics.
H4 Chart:
M15 Analysis:
-> Swing: Bullish.
-> Internal: Bullish.
As per alternative scenario of yesterday's intraday analysis, price continued to push higher.
Price subsequently printed a bearish CHoCH before continuing with it's bullish momentum, however, I shall not classify this due to the very insignificant pullback. This has been marked in red.
Price is currently trading within an established internal range.
Intraday Expectation:
Price to trade down to either M15 supply zone, or discount of 50% EQ before targeting weak internal high priced at 3,871.890.
Alternative Scenario: Price could potentially target strong internal low as H4 TF enters it's bearish pullback phase.
Note:
Gold remains highly volatile amid the Federal Reserve's continued dovish stance, persistent and escalating geopolitical uncertainties. Traders should implement robust risk management strategies and remain vigilant, as price swings may become more pronounced in this elevated volatility environment.
Additionally, President Trump’s recent tariff announcements are expected to further amplify market turbulence, potentially triggering sharp price fluctuations and whipsaws.
M15 Chart:

XAU/USD 29 September 2025 Intraday AnalysisH4 Analysis:
-> Swing: Bullish.
-> Internal: Bullish.
As per my analysis dated 22 September 2025, whereby I mentioned price could potentially continue to print higher-highs. This is how price printed, showing little to no signs of pullback phase initiation.
Price is currently trading within an internal low and fractal high. CHoCH positioning is denoted with a blue horizontal dotted line. Take note that CHoCH positioning as been brought significantly closer than previous, this allows for a more realistic chance of bearish pullback phase initiation.
Intraday Expectation:
Price to print bearish CHoCH to indicate bearish pullback phase initiation, price to then trade down to either discount of internal 50% EQ, or H4 supply zone before targeting weak internal high priced at 3,819.915.
Alternative scenario: Price could potentially print higher-highs.
Note:
The Federal Reserve’s sustained dovish stance, coupled with ongoing geopolitical uncertainties, is likely to prolong heightened volatility in the gold market. Given this elevated risk environment, traders should exercise caution and recalibrate risk management strategies to navigate potential price fluctuations effectively.
Additionally, gold pricing remains sensitive to broader macroeconomic developments, including policy decisions under President Trump. Shifts in geopolitical strategy and economic directives could further amplify uncertainty, contributing to market repricing dynamics.
H4 Chart:
M15 Analysis:
-> Swing: Bullish.
-> Internal: Bullish.
Price has printed according to previous intraday expectation whereby I mentioned price to trade down to either M15 supply zone, or discount of 50% EQ before targeting weak internal high priced at 3,791.255.
Price has printed a bullish iBOS. CHoCH positioning is denoted with a blue dotted horizontal line.
Price is currently trading within an internal low and fractal high.
Intraday Expectation:
Price to print bearish CHoCH to indicate bearish pullback phase initiation. Price to then trade down to either M15 supply zone, or discount of 50% EQ before targeting weak internal high priced at 3,819.915
Alternative Scenario: Price could potentially continue to print higher.
Note:
Gold remains highly volatile amid the Federal Reserve's continued dovish stance, persistent and escalating geopolitical uncertainties. Traders should implement robust risk management strategies and remain vigilant, as price swings may become more pronounced in this elevated volatility environment.
Additionally, President Trump’s recent tariff announcements are expected to further amplify market turbulence, potentially triggering sharp price fluctuations and whipsaws.
M15 Chart:

Gold Weekly Outlook (Sept 29 – Oct 3)Hello Traders,
As we head into the final stretch of September, gold is approaching a critical technical juncture. With prices testing a key supply zone and momentum indicators running hot, traders are watching closely for signs of either continuation or reversal. This week could offer important clues about the broader trend heading into Q4. Let’s dive into the levels, catalysts, and scenarios that matter most.
🟡 Gold Summary (XAUUSD)
Current Price: ~3760
Bias: Bearish–Neutral
Catalyst: NFP (Non-Farm Payrolls) this Friday
🔑 Key Levels
Resistance (Supply Zones):
* 3770–3835 → Current ceiling (weekly supply)
* 3895–3945 → Breakout confirmation zone
Support (Demand Zones):
* 3640–3600 → First major demand
* 3560–3510 → Secondary support
* 3480–3430 → Deeper shelf
* 3250–3200 → Long-term institutional demand
🔻 Bearish Scenario (Favored unless breakout occurs)
* Rejection at 3770–3835 → Targets: 3640 → 3560 → 3480
* RSI divergence + stretched EMAs support pullback
🔺 Bullish Scenario
* Break and hold above 3820–3835 → Targets: 3850 → 3895 → 3945
* Weekly close above 3820 = strong continuation signal , opens up possibility of price targeting $4K.
📉 Intraday (H1–H4)
* Structure: Bullish but weakening
* EMAs stretched, RSI diverging
* Tactical rejection at 3775–3795 opens downside
* Breakout above 3795–3820 needed for further upside
⚔️ Decision Point
3760–3785 = Key battle zone
* Rejection → Bearish retrace
* Breakout → Bullish continuation
✅ Strategy: Wait for confirmation. NFP will likely trigger the move.

Gold Bulls Dominate MarketGold Bulls Dominate Market
Gold price started a fresh surge above $3,750 and traded to a new all-time high.
Important Takeaways for Gold Price Analysis Today
- Gold price rallied to a new all-time high and traded close to $3,800 against the US Dollar.
- A short-term bullish flag pattern is forming with resistance at $3,770 on the hourly chart of gold.
Gold Price Technical Analysis
On the hourly chart of Gold, the price formed support near $3,625. The price remained in a bullish zone and started a fresh increase above $3,660, as mentioned in the previous analysis.
The bulls pushed the price above $3,750 level and the 50-hour simple moving average. Finally, it traded to a new all-time high at $3,791. The price is now consolidating gains below $3,770 and the RSI is above 50.
Initial support on the downside is near the 23.6% Fib retracement level of the upward move from the $3,627 swing low to the $3,791 high at $3,750 and the 50-hour simple moving average.
A downside break below $3,750 could start a larger downside correction. In the stated case, Gold could drop toward the 50% Fib retracement at $3,710. The next area of interest for the bulls might be $3,690. A daily close below $3,690 could spark bearish moves and send the price to $3,625.
If there is a fresh increase, the price could face resistance at $3,770 and a short-term bullish flag pattern. The next sell zone might be $3,790. An upside break above the $3,790 resistance could send Gold price toward $3,820. Any more gains may perhaps set the pace for an increase to $3,850.
This article represents the opinion of the Companies operating under the FXOpen brand only. It is not to be construed as an offer, solicitation, or recommendation with respect to products and services provided by the Companies operating under the FXOpen brand, nor is it to be considered financial advice.

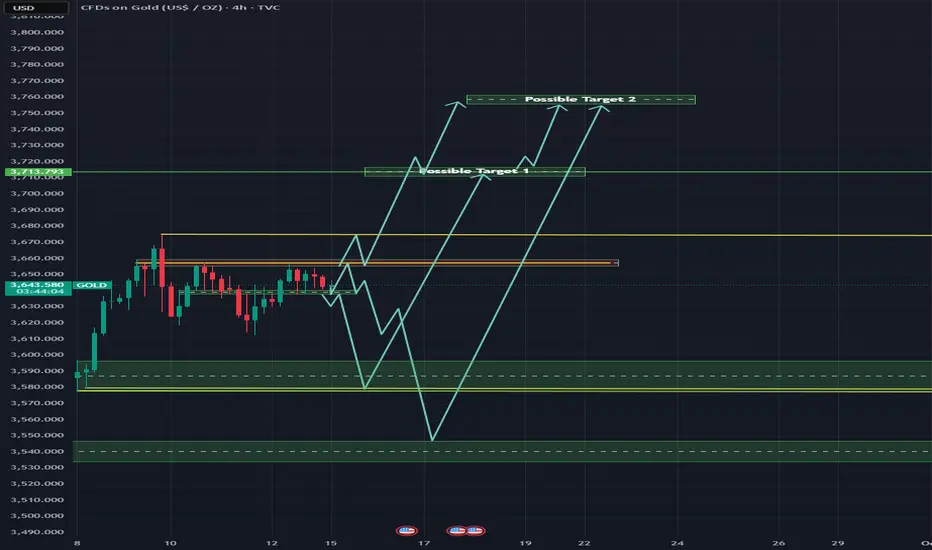
Gold at Make-or -Break ZoneHello Traders,
What a ride the FOMC gave us! 🎢
Gold came within just $3 (60 pips) of our first target — so close!
The FOMC drop sent price from $3707 → $3628, where buyers stepped in around the $3625–$3635 demand pocket, defending the structure above the Higher Low at $3612.
Since then, gold has been trying to stabilize… but remains capped under the First Cap supply zone at $3685–$3695.
Price is now coiled between strong resistance above and layered demand below — setting up for the next big breakout (or breakdown).
So the question is:
What’s your next target for gold?
Eyeing $3713... or looking beyond at $3756?
This week, we zoom out to the weekly chart to get a clearer view:
Price broke structure at $3480, entered premium territory, and is now testing a key supply zone.
👉 Will gold smash through $3730 and print new highs?
👉 Or is this where supply takes control and drives us lower?
Drop your thoughts below 👇
Let’s dive in and see what the charts are telling us this week 📊
🟡 GOLD PRICE ACTION SUMMARY
✅ Overall Bias: Bullish, but at a major resistance zone
🔸 WEEKLY
Trend: Strong bullish (BOS at 3480)
Current Zone: Inside key resistance at 3680–3730
🔼 Bullish above 3730 → Targets: 3800 → 3920 → 4000
🔽 Rejection → Pullback toward 3370 or deeper to 3050
🔸 DAILY
Structure: Bullish
Resistance: 3675–3705 (active supply)
🔼 Break above 3705 → Targets: 3755 → 3810 → 3865
🔽 Rejection → Drop toward 3580 → 3500
🔸 H4
Key Resistance: 3675–3695 (Ceiling Block), 3707 (weak high)
🔼 Break above 3707 → 3750 → 3840 → 391
🔽 Failure at resistance → 3625 → 3575 → 3545
🔸 H1
Resistance Levels: 3685–3707
Support Zones: 3665 → 3645 → 3625 → 3612
🔼 Break & hold above 3707 → 3725 → 3745
🔽 Breakdown below 3665 → 3635 → 3575 → 3530
📌 Key Decision Zones
🔁 3685–3707 = Make-or-break resistance zone
🛡 3625–3635 = Critical FOMC support block
💣 Lose 3612 HL → shifts momentum bearish short-term

Gold Weekly Outlook ( FOMC Week )Hello traders,
Another week and most importantly its FOMC week
🔸 Weekly Outlook (HTF Bias)
Trend: Bullish, but stretched into ATH zone.
Supply Zones:
3670–3720 (ATH pocket – decision zone)
3770–3800 (extension confluence)
3850–3920 (untouched liquidity cluster)
Demand Zones / Imbalance:
3590–3450 → main corrective magnet (contains EMA50)
3340–3290 → first strong HTF demand
3180–3120 & 3050–2980 → deeper extreme discount demand
Confluence:
EMA stack bullishly locked, but extended
RSI weekly overbought → exhaustion risk
Liquidity pools: above 3674 ATH and below imbalance 3450
Fibonacci: 1.272/1.618 extensions (3750/3880) align with supply above
Scenarios:
Bullish Expansion: Clean breakout above 3670–3720 → targets 3770 → 3850+
Bearish Correction: Rejection from ATH → pullback into 3590–3450 imbalance. A deeper rebalance could test 3340 or lower demand if macro turns hawkish.
🔸 H4 Structure & Trend
Trend: Still bullish (HH–HL), but slowing momentum inside supply.
Active Supply Zones:
3640–3666 → current battlefield (price inside)
3692–3720 → inducement + 1.272 Fib trap zone
3745–3785 → 1.618–2.0 Fib, expansion exhaustion supply
Demand Zones:
3600–3580 → first pullback demand
3544–3520 → EMA50 confluence, BOS origin
3500–3470 → last valid H4 demand before sentiment shift
Confluence:
EMAs locked bullish, but flattening
RSI cooling off → momentum compression
Equal highs below 3666 → inducement
Imbalances on both sides = liquidity-driven moves ahead
Scenarios:
Bullish: Hold above 3600–3580 → breakout above 3666 confirms push toward 3720/3785.
Bearish: Rejection at 3640–3666 or EQH sweep → pullback into 3580/3544, possibly 3500.
🔸 H1 Refined Levels
Premium Sell Zones:
3640–3654 → short-term liquidity wall (first seller defense)
3670–3678 → ATH trap zone (inducement risk)
3704–3720 → exhaustion zone (final upside trap)
Discount Buy Zones:
3595–3580 → first reaction base
3550–3535 → mid-range accumulation shelf
3505–3490 → deep liquidity reload zone (best RR swing entry)
Decision Zone: 3630–3608 → momentum pivot
Above 3630 → bulls in control
Below 3608 → opens reentry demand zones
🎯 Battle Plan
Bullish Play:
Look for rejections from 3595 / 3550 / 3505 with confirmation (M15 BOS or engulfing).
Above 3630 → push toward 3654 → 3674 → 3720.
Break and hold above 3674 → continuation toward 3770+.
Bearish Play:
Tactical shorts at 3654, 3678, 3720 with M15/M30 confirmation.
Targets: 3608 → 3580 → 3550.
Loss of 3490 = HTF correction mode unlocked.
✅ Overall Bias: Still bullish on HTF, but extended. Market is at a make-or-break zone (3640–3674).
⚠️ Risk: RSI overbought + inducement structure = high probability of a liquidity sweep before the real move.
📌 Key Catalyst: FOMC will likely decide whether ATH breaks cleanly or if a corrective flush into imbalance (3450–3590) happens first
Market Analysis: Gold Pulls BackMarket Analysis: Gold Pulls Back
Gold price started a fresh decline below $3,380.
Important Takeaways for Gold Price Analysis Today
- Gold price climbed higher toward the $3,410 zone before there was a sharp decline against the US Dollar.
- A key bearish trend line is forming with resistance near $3,355 on the hourly chart of gold.
Gold Price Technical Analysis
On the hourly chart of Gold at FXOpen, the price climbed above the $3,380 resistance. The price even spiked above $3,400 before the bears appeared.
A high was formed near $3,409 before there was a fresh decline. There was a move below the $3,380 pivot level. The bears even pushed the price below the $3,350 support and the 50-hour simple moving average.
It tested the $3,330 zone. A low has formed near $3,331 and the price is now consolidating losses near the 23.6% Fib retracement level of the downward move from the $3,409 swing high to the $3,331 low.
Immediate resistance on the upside is near a bearish trend line at $3,355 and the 50-hour simple moving average. The next major hurdle is near the 50% Fib retracement level.
The main barrier for the bulls could be near the $3,380 level, above which the price could test the $3,400 zone. Any more gains might call for a move toward $3,410. An upside break above $3,410 could send Gold price toward $3,425.
Initial support on the downside is near $3,330. The next key level is $3,320. If there is a downside break below $3,320, the price might decline further. In the stated case, the price might drop toward the $3,300 zone.
This article represents the opinion of the Companies operating under the FXOpen brand only. It is not to be construed as an offer, solicitation, or recommendation with respect to products and services provided by the Companies operating under the FXOpen brand, nor is it to be considered financial advice.

XAU/USD 27 June 2025 Intraday AnalysisH4 Analysis:
-> Swing: Bullish.
-> Internal: Bullish.
Analysis and bias remains the same as analysis dated 23 April 2025
Price has now printed a bearish CHoCH according to my analysis yesterday.
Price is now trading within an established internal range.
Intraday Expectation:
Price to trade down to either discount of internal 50% EQ, or H4 demand zone before targeting weak internal high priced at 3,500.200.
Note:
The Federal Reserve’s sustained dovish stance, coupled with ongoing geopolitical uncertainties, is likely to prolong heightened volatility in the gold market. Given this elevated risk environment, traders should exercise caution and recalibrate risk management strategies to navigate potential price fluctuations effectively.
Additionally, gold pricing remains sensitive to broader macroeconomic developments, including policy decisions under President Trump. Shifts in geopolitical strategy and economic directives could further amplify uncertainty, contributing to market repricing dynamics.
H4 Chart:
M15 Analysis:
-> Swing: Bullish.
-> Internal: Bullish.
Following previous high, and printing of bearish CHoCH, price has pulled back to an M15 supply zone, where we are currently seeing a reaction. Therefore, I shall now confirm internal high.
Price is now trading within an established internal range.
The remainder of my analysis shall remain the same as analysis dated 13 June 2025, apart from target price.
As per my analysis dated 22 May 2025 whereby I mentioned price can be seen to be reacting at discount of 50% EQ on H4 timeframe, therefore, it is a viable alternative that price could potentially print a bullish iBOS on M15 timeframe despite internal structure being bearish.
Price has printed a bullish iBOS followed by a bearish CHoCH, which indicates, but does not confirm, bearish pullback phase initiation. I will however continue to monitor, with respect to depth of pullback.
Intraday Expectation:
Price to continue bearish, react at either M15 supply zone, or discount of 50% internal EQ before targeting weak internal high priced at 3,451.375.
Note:
Gold remains highly volatile amid the Federal Reserve's continued dovish stance, persistent and escalating geopolitical uncertainties. Traders should implement robust risk management strategies and remain vigilant, as price swings may become more pronounced in this elevated volatility environment.
Additionally, President Trump’s recent tariff announcements are expected to further amplify market turbulence, potentially triggering sharp price fluctuations and whipsaws.
M15 Chart:

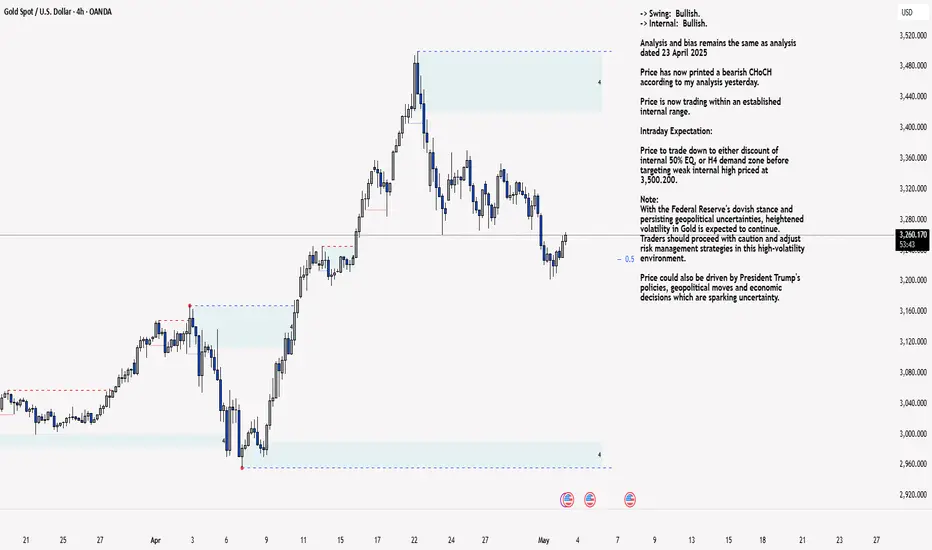
XAU/USD 02 May 2025 Intraday AnalysisH4 Analysis:
-> Swing: Bullish.
-> Internal: Bullish.
Analysis and bias remains the same as analysis dated 23 April 2025
Price has now printed a bearish CHoCH according to my analysis yesterday.
Price is now trading within an established internal range.
Intraday Expectation:
Price to trade down to either discount of internal 50% EQ, or H4 demand zone before targeting weak internal high priced at 3,500.200.
Note:
With the Federal Reserve's dovish stance and persisting geopolitical uncertainties, heightened volatility in Gold is expected to continue. Traders should proceed with caution and adjust risk management strategies in this high-volatility environment.
Price could also be driven by President Trump's policies, geopolitical moves and economic decisions which are sparking uncertainty.
H4 Chart:
M15 Analysis:
-> Swing: Bullish.
-> Internal: Bearish.
As mentioned in yesterday's analysis dated 01 May 2025 whereby I mentioned that I would continue to monitor price and depth of bullish pullback following the printing of a bearish iBOS followed by a bullish CHoCH.
Price did not pullback significantly enough to warrant a further bearish iBOS, therefore, I will apply discretion and not classify this as such, I have however marked in red.
Price has since continued bearish, subsequently printing a bullish CHoCH.
Internal structure is now established, however, I will continue to monitor price regarding depth of pullback as previous.
Intraday Expectation:
Price to trade up to either premium of internal 50% EQ, or M15 supply zone before targeting weak internal low priced at 3,201.955
Note:
With the Federal Reserve maintaining a dovish stance and ongoing geopolitical tensions, volatility in Gold prices is expected to remain elevated. Traders should exercise caution, adjust risk management strategies, and stay prepared for potential price whipsaws in this high-volatility environment.
Trump's tariff announcement will most likely cause considerably increased volatility and whipsaws.
M15 Chart:
Gold Market Trend Analysis for December 12, 2024: Opportunities Current Gold OANDA:XAUUSD Price Situation
Gold is currently trading around $2,713, maintaining its upward trend in both the medium and short term. After breaking through the key resistance level at $2,700, the market is now approaching the next significant resistance at $2,732. This zone is critical and will determine whether the price continues to rise or faces rejection and adjusts downward.
Trading volume on the 4-hour chart has increased during price surges, indicating active participation from buyers. However, sellers are also waiting to act at higher price levels.
Technical Analysis
Here are the key highlights of the current gold trend analysis:
Market Trend:
Primary trend: Upward.
Key support levels: $2,700 (MA50) and $2,696 (Fibonacci 50%).
Resistance: $2,732 (previous peak).
Fibonacci Retracement:
The price is trading near the 38.2% - 50% retracement levels of the move from the $2,660 low to the $2,732 high.
Strategy : Wait for the price to retrace to $2,710 (Fibonacci 38.2%) to buy.
RSI Indicator:
RSI is currently at 65, not yet in the overbought zone. However, if RSI hits 70 at $2,732, the chances of a correction will increase.
Bollinger Bands:
The price is approaching the upper band of the Bollinger Bands at $2,732, indicating strong upward momentum. If the price fails to break through, it may pull back to the middle band ($2,710).
MACD and EMA:
MACD is positive, with the signal line above 0.
EMA 50 at $2,700 continues to act as dynamic support for the upward trend.
Market Scenarios
Scenario 1: Price Continues to Rise (Breakout)
If the price breaks the $2,732 resistance with strong volume, it is likely to rise further to $2,750.
Trading Strategy:
Buy when the price closes above $2,732.
Stop Loss: $2,720.
Take Profit 1: $2,750.
Take Profit 2: $2,760.
Scenario 2: Price Rejected at Resistance
If the price is rejected at $2,732, a pullback to the $2,710 or $2,700 support level may occur.
Trading Strategy:
Sell near $2,732 if reversal signals like Pin Bar or Doji candles appear.
Stop Loss: $2,740.
Take Profit 1: $2,710.
Take Profit 2: $2,700.
Scenario 3: Price Pulls Back to Support and Bounces
If the price retraces to the $2,700 support level and holds firm, this could be an opportunity to buy along with the trend.
Trading Strategy:
Buy at $2,700.
Stop Loss: $2,688.
Take Profit 1: $2,732.
Take Profit 2: $2,750.
Advice for Traders
Practice Careful Risk Management:
Limit risk per trade to no more than 2% of your account.
Monitor Economic News:
Key economic data, such as Fed interest rate decisions or CPI, will significantly impact gold prices.
Wait for Confirmation:
Avoid emotional trading and only enter trades with clear signals at critical price zones.

GOLD SHORTNEW WEEK, NEW TRADE GOLD PRICE ACTION ANALYSE SAYS IT IS GOING TO DROP ALSO EFFECT TRENDLINE

Gold Elliott wave analysisaccording to my elliott wave analysis an impulse wave have started from beginning of 2016 in gold price.
wave 1 and 2 completed and XAUUSD is in wave 3. i considered 15 aug 2018 low as wave 2 of wave 3. if this count is correct, Gold is in the wave 4 of wave 3.
if gold goes below 1370 level both intermediate and primary degrees wave count will invalidated. so if gold drops to these levels it would be a great opportunity to buy and put a stop loss order below the region that wave 4 intersects with wave 1.
it is interesting situation in which below 1370 level, 2 wave count of 2 different degree will be invalidated and also this level was a strong resistance in past 2000 days! so may be gold will pullback to these level and we will long this market so crazy.
try to trade different markets.
stay tuned
