XAU/USD 20 November 2025 Intraday AnalysisH4 Analysis:
-> Swing: Bullish.
-> Internal: Bullish.
Analysis and bias remains the same as analysis dated 20 October 2025.
Price has printed as per previous intraday expectation by printing a bearish CHoCH which indicates, but not confirms, bullish pullback phase initiation.
Price is currently trading within an established internal range, however, I will continue to monitor price with regards to depth of pullback.
Intraday expectation:
Price to continue bearish, react at either discount of 50% internal EQ, or H4 supply zone before targeting weak internal high priced at 4,380.990.
Note:
The Federal Reserve’s sustained dovish stance, coupled with ongoing geopolitical uncertainties, is likely to prolong heightened volatility in the gold market. Given this elevated risk environment, traders should exercise caution and recalibrate risk management strategies to navigate potential price fluctuations effectively.
Additionally, gold pricing remains sensitive to broader macroeconomic developments, including policy decisions under President Trump. Shifts in geopolitical strategy and economic directives could further amplify uncertainty, contributing to market repricing dynamics.
H4 Chart:
M15 Analysis:
-> Swing: Bullish.
-> Internal: Bullish.
As per analysis dated 14 November 2025, price has printed a bearish CHoCH to indicate, but not confirm bearish pullback phase initiation.
Price is currently trading within an established internal range.
Intraday expectation:
Price to trade down to either discount of 50% internal EQ, or M15 demand zone before targeting weak internal high, priced at 4,245.195
Note:
Gold remains highly volatile amid the Federal Reserve's continued dovish stance, persistent and escalating geopolitical uncertainties. Traders should implement robust risk management strategies and remain vigilant, as price swings may become more pronounced in this elevated volatility environment.
Additionally, President Trump’s tariff announcements, particularly against China, are expected to further amplify market turbulence, potentially triggering sharp price fluctuations and whipsaws.
M15 Chart:
Goldpriceprediction

XAUUSD – Consolidation Before Drop**Gold (XAUUSD) – Consolidation Before Potential Downside Move**
Gold continues to hover in a consolidation range after the recent breakout and structural shift on the 3H chart. The bullish momentum that previously dominated has now slowed, indicating a possible distribution phase forming near the $4,050–$4,100 zone.
The market structure shows repeated rejections at the upper boundary, suggesting that buyers are losing strength. With BOS (Break of Structure) confirmations in the recent candles and a clear lack of higher highs, a potential downside continuation could unfold once the current range is broken.
If sellers take control below $3,978, the next liquidity targets lie around **$3,886** and possibly **$3,614**. This scenario aligns with the broader retracement expectation after a strong prior uptrend.
However, a confirmed breakout above the consolidation area would shift the short-term bias back to bullish, with upside potential toward **$4,248** and beyond.
**Market Outlook:** Neutral → Bearish
**Bias:** Short-term corrective move expected
**Key Levels:**
* Resistance: $4,050 – $4,100
* Support: $3,886 – $3,614
**Tags:** #Gold #XAUUSD #GoldAnalysis #XAUUSDforecast #GoldPricePrediction #GoldTrading #GoldMarket #Commodities #TradingViewIdeas

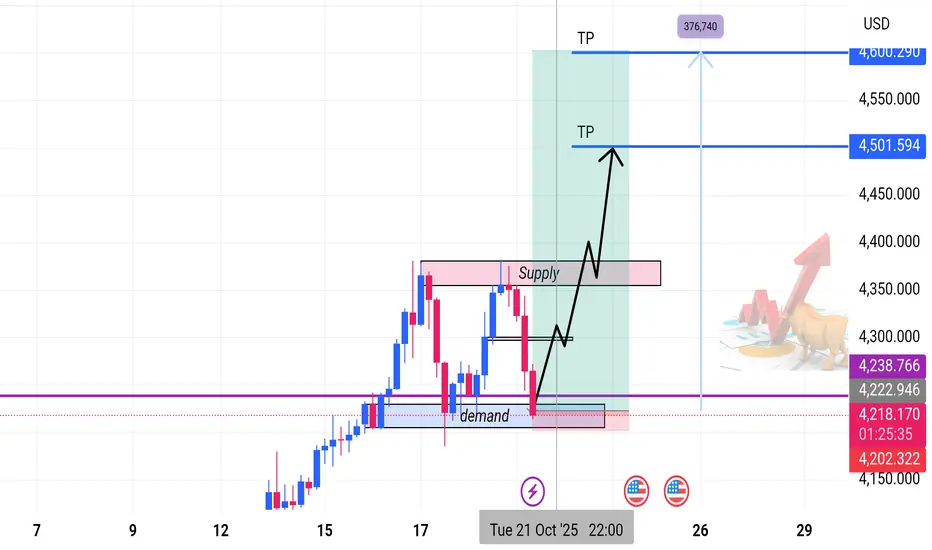
Bullish Continuation from Demand Zone | 4H SetupOverview:
Gold is maintaining a strong bullish structure on the 4-hour timeframe, forming consistent higher highs and higher lows.
Recently, price tapped into a key Demand Zone, showing a clear rejection and early signs of buyer re-entry — signaling a potential continuation of the uptrend.
Technical Outlook
• Trend: Bullish market structure intact.
• Current Price: ~4,230.34
• Demand Zone (Buy Zone): Price has bounced from a major demand area — indicating renewed buying pressure.
• Reversal Confirmation: Rejection wicks and bullish candles confirm demand reaction.
• Supply Zone (Resistance): Overhead supply remains the key obstacle. A break and close above it could trigger a strong rally toward the next resistance.
Trade Setup
Parameter Level (Approx.) Description
Entry (Buy Zone) 4,230.34 Reaction from demand zone
Take Profit 1 (TP1) 4,501.59 Conservative target
Take Profit 2 (TP2) 4,576.74 Extended target
Stop Loss (SL) ~4,200.00 Below demand zone
Market Outlook
As long as the demand zone holds, the bullish structure remains valid.
A confirmed break above the supply zone could invite strong momentum toward higher targets.
Failure to hold the demand base may trigger a corrective move lower — hence, risk management remains crucial.
Bias: 🟢 Bullish
Timeframe: 4H
Strategy: Supply & Demand | Market Structure | Price Action
Gold Market Outlook – Bullish Trend Building MomentumGold continues to follow a structured bullish cycle, where each consolidation phase has been followed by a breakout and expansion. Market behavior shows liquidity being collected in sideway ranges, then released to fuel upward momentum.
At the current stage, price is trading around $3,870, showing signs of a potential short-term pullback to gather liquidity from the mid-zone. Once this corrective move stabilizes, the chart suggests a renewed bullish impulse with a projected upside target toward the $3,965 level.
This pattern highlights that the market remains in a controlled bullish phase, where temporary retracements are acting as setups for continuation rather than reversal. The underlying flow still favors higher levels as long as buyers maintain activity after corrections.

XAU/USD 30 September 2025 Intraday AnalysisH4 Analysis:
-> Swing: Bullish.
-> Internal: Bullish.
Price printed as per yesterday's intraday analysis whereby I mentioned in alternative scenario that price could print higher.
Price is currently trading within an internal low and fractal high. CHoCH positioning is denoted with a blue horizontal dotted line.
Intraday Expectation:
Price to print bearish CHoCH to indicate bearish pullback phase initiation, price to then trade down to either discount of internal 50% EQ, or H4 supply zone before targeting weak internal high priced at 3,871.890.
Alternative scenario: Price could potentially print higher-highs.
Note:
The Federal Reserve’s sustained dovish stance, coupled with ongoing geopolitical uncertainties, is likely to prolong heightened volatility in the gold market. Given this elevated risk environment, traders should exercise caution and recalibrate risk management strategies to navigate potential price fluctuations effectively.
Additionally, gold pricing remains sensitive to broader macroeconomic developments, including policy decisions under President Trump. Shifts in geopolitical strategy and economic directives could further amplify uncertainty, contributing to market repricing dynamics.
H4 Chart:
M15 Analysis:
-> Swing: Bullish.
-> Internal: Bullish.
As per alternative scenario of yesterday's intraday analysis, price continued to push higher.
Price subsequently printed a bearish CHoCH before continuing with it's bullish momentum, however, I shall not classify this due to the very insignificant pullback. This has been marked in red.
Price is currently trading within an established internal range.
Intraday Expectation:
Price to trade down to either M15 supply zone, or discount of 50% EQ before targeting weak internal high priced at 3,871.890.
Alternative Scenario: Price could potentially target strong internal low as H4 TF enters it's bearish pullback phase.
Note:
Gold remains highly volatile amid the Federal Reserve's continued dovish stance, persistent and escalating geopolitical uncertainties. Traders should implement robust risk management strategies and remain vigilant, as price swings may become more pronounced in this elevated volatility environment.
Additionally, President Trump’s recent tariff announcements are expected to further amplify market turbulence, potentially triggering sharp price fluctuations and whipsaws.
M15 Chart:

Gold Forecast: Liquidity Rotation Shaping Price ActionGold Forecast: Liquidity Rotation Shaping Price Action
Gold’s recent movement reflects shifting dynamics between liquidity capture and market rebalancing. The push above 3,800 was less about sustained trend extension and more about triggering stops and gathering liquidity before rotating lower. This type of move often indicates that large participants are managing positioning rather than chasing new highs.
The current correction phase is part of that process. Price is being driven back into zones where imbalances remain, allowing institutional flow to realign. Instead of showing weakness, this return highlights how markets redistribute liquidity to prepare for the next decisive move.
From a flow perspective, gold remains in an accumulation phase. Consolidation pockets reveal ongoing positioning, while the corrective dip reflects controlled market engineering rather than disorder. If this cycle continues, the next stage could see energy released in the form of a renewed expansion leg once sufficient liquidity has been absorbed.
In essence, gold is navigating a liquidity-driven cycle: sweep → redistribute → prepare → expand. The underlying order flow still favors upward continuation once the current rebalancing phase completes.

XAUUSD Forecast – Gold Price Action and Market InsightsGold is showing signs of stabilization after recent fluctuations, with price consolidating around the mid-range levels. The chart highlights repeated sequences of structural breaks and shifts, indicating that liquidity has been actively swept on both the buy and sell side.
The latest market move shows a controlled decline, followed by an attempt to absorb selling pressure. Current positioning suggests the possibility of a short-term liquidity grab to the downside, which could fuel a stronger recovery leg in the sessions ahead.
The projected outlook favors a scenario where buyers regain momentum, aiming to retest the upper price zones. If this momentum develops, the market may establish a renewed upward leg in alignment with the broader bullish cycle observed across higher timeframes.
From a macro perspective, gold continues to be supported by demand for safe-haven assets amid ongoing global financial uncertainty and shifting monetary policies. This backdrop enhances the probability of gold sustaining its mid-term bullish trajectory despite temporary corrective phases.

XAUUSD Ready for the Next Big Move?XAUUSD Ready for the Next Big Move?
📊 Gold (XAUUSD) Market Report
Gold continues to trade within a strong bullish cycle, supported by both macro fundamentals and technical structure.
From a fundamental perspective, the precious metal remains underpinned by softer U.S. dollar dynamics, moderating bond yields, and persistent safe-haven demand amid global economic and geopolitical uncertainties. Inflationary pressures and the cautious stance of central banks further enhance gold’s role as a defensive asset, keeping institutional interest alive.
On the technical side, the market has shown a clear sequence of bullish impulses following multiple market structure shifts (MSS) and breaks of structure (BOS). Each expansion phase has been driven by strong order flow, with shallow retracements reflecting consistent buyer control. The current leg higher has pushed into an area of potential liquidity grab, suggesting that while the broader trend remains constructive, near-term exhaustion and corrective movement cannot be ruled out.
Taken together, the outlook for gold remains broadly bullish in the medium term, with fundamentals providing a supportive backdrop and technicals confirming momentum. However, traders should be mindful of short-term volatility as the market balances out after recent sharp gains.

GOLD ~ TECHNICAL. 2H.First, what I want to say is Gold is not giving up, after the Triple top resistance.
My prediction about GOLD is that it's not only trying to reach the triangle's upside, but it's also trying to reach the resistance point by entering that marked area.
Have a profitable day!

GOLD Price Forecast: Is the Pullback Over? | Weekly OutlookWill XAUUSD resume its bullish trend, or is more downside ahead?
In this video, I break down last week’s gold price movement and the current market reaction to rising geopolitical tensions between Iran and Israel, now with the U.S. joining the conflict. We also assess the impact of the Fed’s recent rate hold, weak retail sales, and upcoming high-impact U.S. economic events like PMI, GDP, and Core PCE.
💡 Here’s what you’ll learn:
✅What caused gold’s pullback last week
✅Why institutional traders shake out retail buyers
✅Key fundamentals driving gold right now
✅How to position yourself smartly for the upcoming trading week
🔔 Don’t forget to like the video in support of this work.
Disclaimer:
Based on experience and what I see on the charts, this is my take. It’s not financial advice—always do your research and consult a licensed advisor before trading.
#goldanalysis, #xauusd, #goldforecast, #goldpriceprediction, #forexanalysis, #fundamentalanalysis, #forextrading, #tradinggold, #goldnews, #federalreserve, #marketpsychology, #tradingstrategy, #geopoliticalrisk, #usdata, #iranisraeltensions, #goldbullish, #goldbearish, #forexmentor, #xauusdforecast, #tradingview

GOLD Price Analysis: Key Insights for Next Week Trading DecisionGold prices surged last week, ending with a strong 3.9% weekly gain, closing around the $3,365 zone after bouncing back with conviction on Friday. In this video, I break down why gold rallied, what key events influenced price action, and how I’m reading the current chart structure to strategically position for the next move.
Here’s what’s driving the gold market right now:
🔸 Moody’s U.S. sovereign downgrade reignited safe-haven demand
🔸 Easing U.S.–China tensions led to mid-week profit-taking
🔸 Friday’s sharp rebound (+1.7% intraday) shows bulls are still in the game
🔸 Upcoming high-impact events could shake things up again
🎯 In this analysis, I walk you through:
🔸My technical blueprint (key zones for buyers & sellers)
🔸My bullish and bearish scenarios based on the structure on the chart
🔔 Don’t forget to like the video in support of my work.
Disclaimer:
Based on experience and what I see on the charts, this is my take. It’s not financial advice—always do your research and consult a licensed advisor before trading.
#GoldAnalysis #XAUUSD #GoldForecast #ForexTrading #TechnicalAnalysis #FedPowell #PCEInflation #FOMCMinutes #GoldPricePrediction #GoldBulls #TradingStrategy #GoldOutlook #USGDP #ForexMentor #PriceActionTrading

GOLD EXTENDED RETRACEMENT - NEW LAUNCHPADLooking for Gold (XAUUSD) to have a larger retracement prior to continuing bullish in the longterm.
I am waiting for a retest of the resistance around the $2400 price.
I will then be looking at the lower timeframes 4H, 1H, 30Mins for sell entries.
First profit taking level will be at the $2185 level, where I will move my stop loss to breakeven.
Full take profit at $2072.50.
Once the final take profit level has been hit, I will be looking for buy positions to continue moving higher. This will be the my new launchpad for Gold.
Let me know your thoughts, are you looking for buys or sells?

GOLD spends historical moments before HISTORICAL CRASH !phenomenal volume in ATH ( march 24 2022 ) confirms a historical crash in few months !
gold price now 1717 $
help by cheer or boosting the post ♥

Gold Price Prediction analysis TF WeekGold chooses its direction to wave 2 or C as predicted on 11 August. At the current level of 1747, about 50% pulled back and arrived at significant support but still have more downside.
Whilst, DXY recovered its value as the positive data of U.S. Retail Sales and initial Jobless Claims. The dollar could keep rising this coming week with limited downside. If DXY breaks the old high (109 as of 14 July), it might rapidly surge to 111.
So, this may cause negative sentiment for gold. Nonetheless, gold can rebound for a short period before going down again. Suggest picking a top to sell.
Sell 1754 - 1766
TP 1758/1754/1747/1735/1728
SL set according to your margin ( above 1772 is a crucial point for gold rally to wave 3 )
Have a good week!!

XAUUSDIn this analysis we can see gold price is strullging between is symmetrical triangle and flag patterns after a strong upside move. here we have two sanerio if on monday price respect this sysmmertical triangle and bounch from 1780 than we see gold price at 1786 and if break 1787 than it goes to 1795 strong resitance of 200 Ema in 4h time frame. otherwise if price break down side of triangle than 1778 200 eme on 1H timeframe if it break than gold price fall to flag pattern down trendline 1770. wait for breakout and 1h candle close either upside or downside than you can entr your position. if break bounch from here than you can buy and if break than wait for retest of triangle and than you can short xauusd.
