The continuous short positions in gold have ended perfectly!Whether gold can break through resistance levels in the near term depends on the convergence of three factors: First, whether the US dollar and US Treasury yields experience a more sustained decline, creating room for discounting; second, whether risk appetite strengthens the "insurance demand" for gold due to equity volatility and increased macroeconomic uncertainty; and third, whether net inflows of funds continue, especially whether passive funds and longer-term allocation funds enter the market simultaneously. If these three factors fail to move in tandem, the price will likely continue to consolidate within the $3930-$4000-$4050 range. If they move in unison, the resistance above these round numbers will weaken more smoothly. It's worth noting that the People's Bank of China suspended its 18-month gold purchase program in May 2024 but resumed it in November of the same year. The market currently expects a 67% probability of a Fed rate cut in December, up from around 60% the previous trading day. The Fed just cut rates last week, and Powell stated that this may be the last rate cut this year. The market's current focus is on macroeconomic data and when the US government shutdown will end—which is also driving safe-haven demand for gold. The congressional gridlock led to the longest government shutdown in U.S. history, forcing investors and the data-dependent Federal Reserve to rely on private economic indicators. Since gold does not generate interest income, it typically performs well in low-interest-rate environments and periods of economic uncertainty.
Gold Technical Analysis: With the non-farm payroll data still pending, gold prices are likely to fluctuate little tonight, mainly consolidating. The battle between bulls and bears continues throughout the day. During the US session, gold rebounded to around 4027. We had already positioned short positions at 4015 and 4025, which subsequently fell back as expected, resulting in a profitable trade. This week's trading session has concluded perfectly, and we will not participate in the late-session trading. Our strategy remains to short below 4030.
From a technical analysis perspective, key resistance and support levels need to be monitored. The upper resistance level to watch is the 4020-4030 area. If gold prices can break through this range and hold, the upward trend may continue in the short term, potentially challenging higher levels. Before this breakout, we have consistently emphasized against chasing highs and have provided a strategy and analysis for shorting in batches around the 4015-4030 area. Those who follow me should have seen this. Gold faces significant upward pressure, and unless there is a major positive news event to stimulate a breakout, we will continue to maintain a strategy of selling on rallies. Due to the lack of non-farm payroll data, gold prices will continue to be treated as oscillating. The lower support level is seen in the 3975-3960 area. If this support level is effectively broken, it may trigger a new round of declines, potentially opening up further downside potential.
Goldrush

Palladium - The Calm Before the Next Surge!🏹Palladium has been on a strong bullish run , riding within a clean rising channel. After a sharp impulse, price is now cooling off — and this pullback might just be the calm before the next surge.
⚔️The metal is approaching a major intersection zone where the rising trendline meets a strong demand and structure area, a confluence that has previously sparked powerful rallies. As long as this intersection holds, I’ll be watching for bullish confirmations to join the trend.
A healthy correction into this zone could set the stage for the next impulsive wave, with potential upside targets around $1,550 and even $1,700 if momentum kicks in.
In short, Palladium remains overall bullish, and this upcoming retest could be the perfect reload zone before the next big move north.
📊All Strategies Are Good; If Managed Properly!
~Richard Nasr

Dow Jones v/s Gold Ratio — History Repeating?Currently both DJI & Gold are at there peak levels, but the ratio has already breached a historical support, signaling further downfall.
Whenever the Dow-to-Gold ratio tests or breaks the 12.0 level, stories are created in history.
* 1929: Great Depression hit — stocks crashed, gold outperformed.
* 1973: Oil shock & stagflation — gold surged as inflation soared.
* 2008: Global Financial Crisis — stocks collapsed, gold became the safe haven.
- 2020: COVID tested the level but failed to break it.
Now, in 2025, the ratio has again breached the historic level of 12.0 — the same zone that preceded past market meltdowns.
Each time stocks looked strong relative to gold, the cycle turned
* Gold rallied.
- Stocks corrected.
----------------------------------------------------------------------------------------------------------------
What is the Dow-to-Gold Ratio?
Dow/Gold Ratio = Value of Dow Jones Index ÷ Price of Gold (per ounce)
This ratio tells us how many ounces of gold it takes to buy one unit of the Dow Jones Industrial Average.
For example:
If Dow = 46,000 and Gold = 4000 → Ratio = 11.5.
That means it takes 11.5 ounces of gold to buy one unit of Dow.
If the ratio falls to 6, which the chart is signaling, then it will mean:
1. Stocks might weaken or
2. Gold might become stronger or
3. If both weaken, then stocks will fall more than gold
----------------------------------------------------------------------------------------------------------------
Interpretation
1. Whenever the ratio is high, it means stocks are expensive compared to gold (risk-on period) .
2. Whenever the ratio falls, it means gold is outperforming stocks (risk-off, crisis or correction phase) .
Overall, the Dow to Gold ratio suggests that this is not a normal period - a period of crisis & correction - a risk-off period
Each time this ratio reached around current levels, a major stock market downturn followed

The golden rhythm is in your hands!Today's gold trend once again perfectly verifies our strategic predictions. The market has entered the stage of falling under high pressure as expected. We have been shorting from above 4050 to the bottom. The rhythm is clear and the execution is in place. It can be said to be another god-level operation, with stability and precision coexisting. The value of planned trading is once again reflected. It is not a blind prediction, but a steady progress based on structure, rhythm and logic. Congratulations to my friends who are paying attention.
From the current gold trend analysis, although it rebounded to above 4050 during the US trading phase, it can be clearly seen from the 4-hour chart structure that the gold price entity still closed below 4045. This is also the main reason why I asked my brothers to arrange short positions in advance. 4045 is still an important suppression position at the stage, and the 4000 mark below is still a key support position. Once this mark is held, gold will most likely remain in the 4050-4000 range of shock and consolidation. On the contrary, if it falls below 4000 again, the downward space is expected to extend to around 3985-3980. On the contrary, if the market stabilizes without breaking 4000 and successfully breaks through and stands firmly above 4050, the emergence of a new high is only a matter of time. Therefore, the current core observation range is within the 4000-4050 area. Before the breakthrough, it is recommended to maintain the strategy of selling high and buying low. Once the price effectively breaks through the boundary of either side, following the trend is the best strategic direction.

Golden opportunity has arrivedGold has continued its strong upward momentum since breaking through the 4000 mark, reaching a high of around 4049. The market has hardly made any decent corrections, market sentiment has continued to be high, and bullish confidence has been infinitely magnified. However, the more emotional the stage is, the more we need to remain calm and rational. Structurally, gold has entered the end of an accelerated upward trend, and short-term indicators are obviously overbought. Although prices have hit new highs, momentum has not increased simultaneously, and there are signs of slight divergence, indicating that the upper space is gradually narrowing. Combined with the 4-hour structure, the 4050-4060 area is a period of strong pressure, and it may face a technical correction in the short term. In terms of operational thinking, you can consider shorting with a light position in the 4050-4060 area, and first target the 4020-4000 area. Conservative people can wait for the confirmation of the pullback before participating, and do not blindly chase the long position. Although gold is strong at present, it is not a mindless rise stage. The larger the bullish space, the deeper the adjustment will often be. At this time, risk control should be the core and planning should be the basis. Short-term short positions should only participate in structural corrections, and should not make impulsive trades that blindly fight against the trend. Steady execution, position control, and maintaining rhythm are the key to remaining invincible in extreme markets.If your recent operations are not ideal, or you are confused about how to grasp the rhythm, you are welcome to communicate with me at any time. I hope I can help you avoid detours and steadily improve your trading thinking and execution.

XAUUSD: Bullish momentum is sustainedOANDA:XAUUSD continues to push to new highs with no signs of weakening momentum . I do not expect a sharp decline in the near term, and at this time we should stand aside and continue to observe price action before making any trading decisions.
Price is approaching a large liquidity area (Margin Zone) , where CME participants accept trading at high value . Therefore, this is the objective price may reach in today’s session.
Contingency at this level hosts a sizable cluster of CME long calls , so price may overshoot the Margin Zone and tag 3976 before a minor pullback.
Margin Zone:
Strong resistance:
Key support:
The levels above are areas where price may react and potentially reverse. However, at present, trading in a high value area without structure confirmation is extremely risky.
⇒ We should stand outside in today’s session and wait for the next price action.
Please like and comment below to support our traders. Your reactions motivate us to produce more analysis in the future 🙏✨
Victor Dan @ ZuperView

Algo Games Begin Below 3748…🔱 GoldRush_Traders Forecast
🕰️ Based on 22:00 UK close (Thursday 25th Sep)
⚠️ Forecast the reaction — not just the level.
🔵 SCENARIO OUTLOOK:
✅ BULLISH:
• 3720–3736 holds firm
• Reclaim 3748 → Target 3757 / 3768
• EMAs re-stack bullish on 5m/15m
• NY continuation possible if DXY weakens
❌ BEARISH:
• Clean break below 3720 → 3708 / 3695 next
• EMA structure breaks down with volume
• DXY strength could force deeper flush
🔁 SIDEWAYS / TRAP:
• Range between 3732–3745
• Sweeps both sides before true move
• Algo bait during low liquidity zones
🧠 Tip: "Don’t trade the level – trade the reaction."

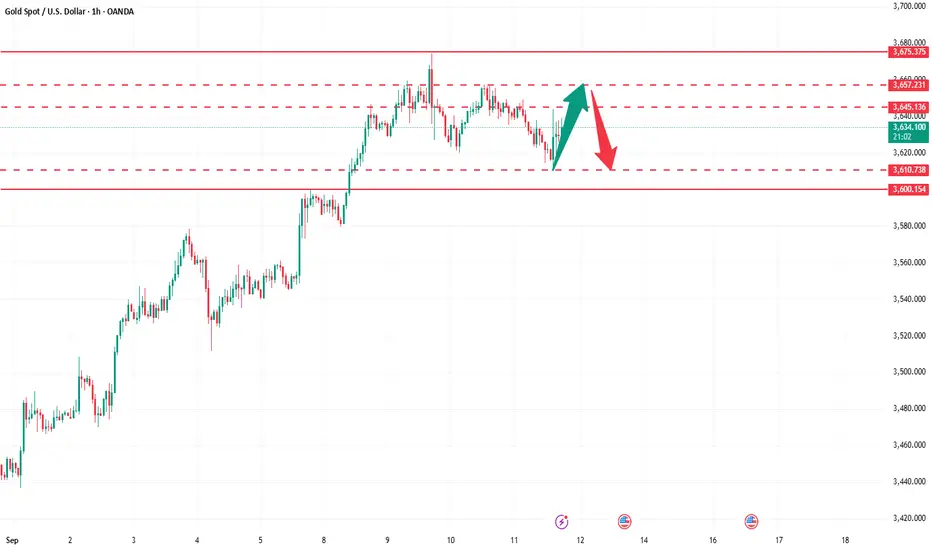
CPI data is confusing,gold is fluctuating in a bearish directionGold Technical Analysis: Looking back at the recent trend, gold surged and then retreated on Tuesday, forming a shooting star pattern. However, the decline did not continue on Wednesday, indicating that the pullback was merely a one-off adjustment and lacks sustainability. It is a normal correction after a significant rally. Even if the market peaks, it will not be so simple. It will at least undergo a process of "high-level fluctuations turning bearish" or "second upward attack to lure more investors and then decline." In the short term, the rebound will continue to fluctuate, and it is unlikely to see significant rises or falls in a short period of time. Looking at the daily gold chart, the daily gold line has slowed down slightly. After continuous large volume, the daily line has turned into a small Yinxing candlestick pattern for consolidation. There is a need for a short-term pullback. Considering the short-term chart, the second high-point test failed to break through the previous high, the previous continuous large volume without a pullback, and the pressure from the second upward test. If there is no new high in the short term, there will be a partial correction around 3675-3657. The pattern will determine whether it is a deep pullback or a sideways consolidation.
Judging from the 4-hour gold chart, yesterday's gold price failed to achieve results in its attempt to rise again. There are signs of a downward correction. The 4-hour chart lost the middle track, breaking the unilateral upward momentum. At the same time, there is a need to further retrace to the lower track. Combined with the second high in the hourly chart near 3657, the second pressure turned into a decline. The strong market is to retrace and then break the high. Once the breaking power is stopped, it will go into a shock correction. Overall, today's short-term gold operation strategy recommends shorting on rebounds as the main strategy, and buying on pullbacks as the auxiliary strategy. The short-term focus on the upper side is the 3640-3650 resistance line, and the short-term focus on the lower side is the 3610-3600 support line.
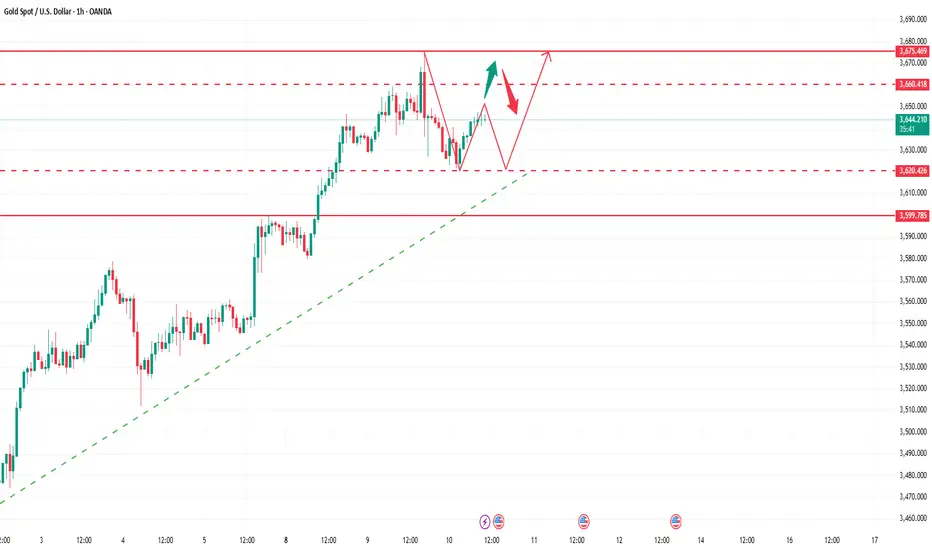
How to correctly grasp the gold trading opportunities?Yesterday, the technical side of gold rose first and then fell. The overall gold price continued to rise strongly in the Asian and European sessions, and finally fell back in the U.S. session and fell into repeated fluctuations, and finally closed near 3628. The daily K-line closed at a high and then fell back and fluctuated in the middle. Yesterday, I kept notifying everyone that the technical side needed to retrace and not to be overly bullish on gold. Now everything is perfectly in line with expectations. Friends who follow me can see it. Today we continue to treat it with the idea of going long on retracements. After all, I believe that the trend has not reversed, and going long on retracements is still the general trend. Today, we will first focus on the short-term support at 3620-3610 below, and continue to go long if it retraces and does not break. If you encounter troubles in your current gold operations and want to make your investment journey more stable and avoid detours, please feel free to communicate with us at any time!
From the 4-hour level, today's short-term support for gold will focus on the 3620-3610 area, and the 3600 mark is the core dividing line between the strength of the bulls. If it retraces and stabilizes above this position during the day, the overall bullish thinking will remain unchanged. The main tone is still to go long on the retracement. At the daily level, as long as gold stabilizes above 3600, the low-long thinking will be sustainable. As for the counter-trend short positions, specific reminders will be given according to the pressure on the market at high levels. Brothers just need to pay attention to the bottom in time.
Gold operation strategy: Go long on gold when it retraces to around 3620-3610, target 3650-3660, and continue to hold if it breaks through.
Gold crash (SHORT) - head and shouldersGold is at an interesting crossroad.
It broke through its diagonal support on Friday the 25th of July.
Price is retesting previous support. Does it turn into resistance?
Further confluence is a head and shoulders of the H8 and H12, with the right shoulder coinciding with the retest of the diagonal.
Since I am long gold with my investments, I am hesitant to short gold through my trading business. However, if my pattern is available, I take the trade. This will be a very short term trade - a few days at most if the trade goes in my favour.
Risk/reward = 12.6
Entry price = 3382.5
Stop loss price = 3396.2
Take profit level 1 (50%) = 3230
Take profit level 2 (50%) = 3181
The risk reward is exceptionally high. However, I have taken a more conservative approach with my entry because of my apprehension to short gold. For this trade I will enter at the extreme end of the range in which I will look for entries. This is the reason for such a high RR. It might result in me missing an entry.
GOLD (XAU) SHORT - Double top 30minRisk/reward = 2.8
Entry price = 3382.5
Stop loss price = 3390.5
Take profit level 1 (50%) = 3361.7
Take profit level 2 (50%) = 3356
I am considering a short on gold.
Still need some variables to fall into place before I enter the trade.
There is nice RSI negative divergence showing declining momentum.
Further confluence:
- Potential head and shoulders on higher time frame
- At area of previous diagonal support which could be turned into resistance if the 30min double top plays out
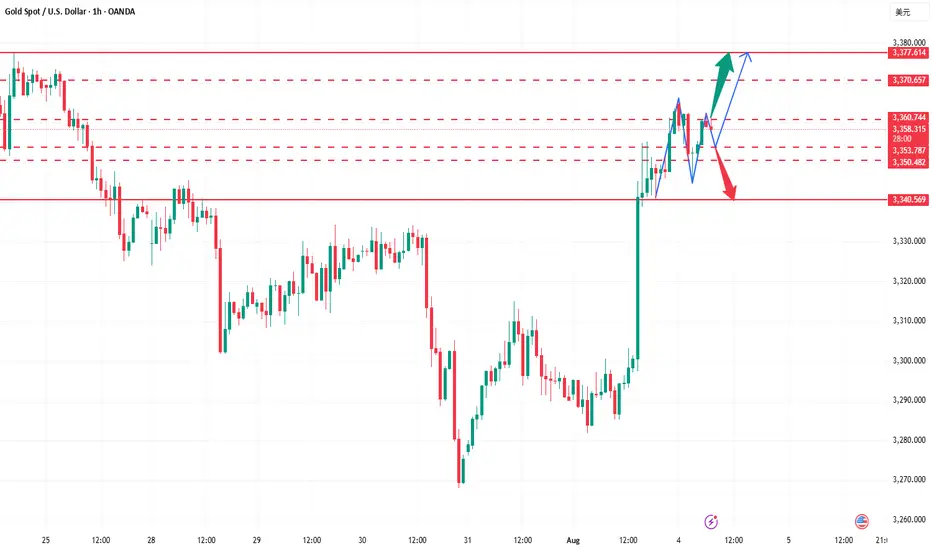
Go long on the pullback and head straight to new highs!Gold fell back and stabilized at 3345 yesterday, and continued to rise during the US trading session, reaching a high of 3385. The overnight daily line closed positive again, which is in line with our expectations, so there is still room for growth. We will continue to take a bullish approach today. In the 4H cycle, the Bollinger opening is in the stage of large volume, and the consecutive positive lines are rising steadily based on the moving average. The support below is 3370-3360, and the intraday watershed is at 3360. The operation is mainly to go long on pullbacks. First look at the pressure of the 3385 high point. If it breaks, continue to look at 3395 and 3410.
Gold operation suggestion: go long on gold around 3370-3360, and look at 3385 and 3400.

As the bull market continues, is gold poised to hit new highs?Judging from the current gold trend, the technical side opened high and closed low, releasing the demand for short-term adjustments. The intraday low hit 3344 and then rebounded, which is enough to reflect the resilience of the bulls. The hourly doji continued to rise, and the 3353 line was pulled up again. It is expected that it will be difficult to give an entry opportunity near 3340-3345 again. Since the new high has been refreshed again, the technical short-term adjustment may have ended. With the current strong bull structure, further testing the 3370-3380 area is a high probability event. If it unexpectedly falls below 3340 in the future, the bulls will no longer defend strongly, and the market may turn to volatility. Breaking below 3340 is also expected to open up short-term short space, but this is a later story. The current market structure is clear, and we continue to see a strong upward trend for the bulls. At least at the beginning of the week, I do not think the bull market is nearing its end.
Gold operation suggestion: go long around 3360-3355, target 3370-3380.Strictly set stop loss and control your position.
GOLD Weekly Idea💡Why Gold Pulled Back
- Gold pulled back today after hitting $3439.04, just below resistance at $3451.53. Traders took profits ahead of key Fed and trade headlines. Right now, it’s trading around $3414.48, down 0.50%.
- The dip came after the U.S.-Japan trade deal eased geopolitical tension, cutting safe-haven demand. Plus, U.S. bond yields are climbing (10-year at 4.384%), which adds pressure on gold.
Support is building at $3374.42, with stronger buying interest expected around $3347.97 and the 50-day moving average at $3336.40 — a key level bulls want to defend.
Short-term looks a bit weak, but as long as gold holds above the 50-day MA, the bullish trend remains intact. Longer-term, weakness in the dollar, central bank gold buying, and concerns about Fed independence could push prices higher.
🔍Watching the Fed’s July 29–30 meeting next
Gold failed to break through three times, short-term bearish?
💡Message Strategy
Gold's decline today means the second consecutive day of decline as investors turn their attention to more positive trade developments since yesterday.
However, gold still received buying support earlier this week and briefly broke through $3,400. This round of gains tested key resistance levels on the gold daily chart, but ultimately the bears held their ground.
This is the third time in nearly three months that gold has tried to break through the $3,430 to $3,435 resistance area, but all failed.
📊Technical aspects
Gold’s latest decline this week has brought the price back into a range-bound trading state between key hourly moving averages. This means that the short-term trend has become more neutral.
This shows that the upward momentum has clearly weakened and buyers need to regain short-term dominance before they can hope to challenge the key resistance area mentioned earlier again.
Currently, the 200 hourly moving average near $3,365 provides support to the downside. If the price can hold this level, it will indicate that buyers are still holding on and waiting for the next upside opportunity.
Combined with the current 1H chart trend analysis, there is still a great chance of a bullish pullback in gold in the short term.
💰Strategy Package
Long Position:3360-3365,SL:3340,Target: 3380-3400
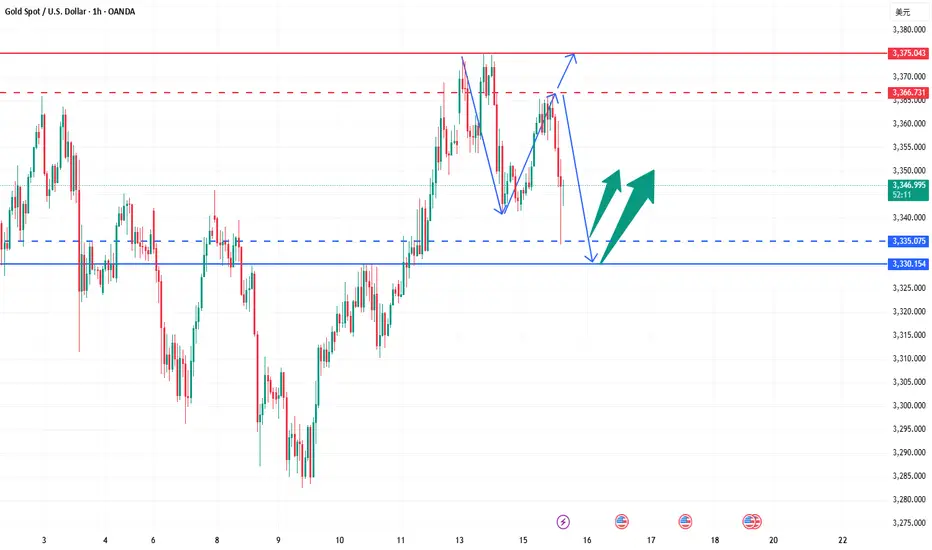
How to find stable trading opportunities in gold fluctuations?Today, the rhythm of gold going short first and then long is perfectly grasped. Congratulations to those who followed the trading plan for reaping good returns. We are still holding long orders at present, and the overall position is arranged around the idea of stepping back to low and long. From the current market structure, the 3325-3320 area below is an important dividing line for the bulls to be strong, and it is also a key support level that determines the subsequent direction. If this area stabilizes, the short-term structure will still be bullish and unchanged, and the rhythm of stepping back to low and long is expected to continue. It is expected that gold will rebound to 3340-3350 and the upper target again. If 3320 is lost, it is recommended to stop loss as soon as possible, and the defense position is recommended to be set below 3315 to prevent the short-term structure from turning short and bringing further callback risks. The core of this round of trend is that only by holding the support can we be qualified to talk about rebound; if the support is lost, we need to turn decisively to prevent being passive. The current market volatility has intensified, but the direction has not yet completely broken. The focus of operation is still on entering the market around key points, switching positions between long and short positions to find the rhythm, blindly chasing orders and emotional operations will be taboos in the current market. Opportunities are not absent, but they belong to those who are always ready. The structure is not broken and the low and long will not change.
Gold bearishness once again in line with expectationsThe data released so far show that the US inflation data is stable and tends to decline, which increases the possibility of the Fed's monetary policy. The US dollar index fell first and then rose. Gold opened at around 3344 and rebounded all the way. The current highest rebound is around 3366. It fell back to 3352 before the data was released, and then quickly rebounded to 3360. After the data was released, it fell again quickly, and the current lowest touched around 3346. The short orders around 3360-3365 that we shared with brothers before were basically the highest short orders of the day, and we successfully completed our first goal. The brothers who participated in it all made good profits. Judging from the current trend of gold, we continue to participate in short orders during the rebound, and the long position is still around 3335-3330. After the release of the CPI data, it is bearish overall. The core is that it is lower than market expectations but higher than the previous value. Inflation has heated up again, which has once again suppressed the expectation of interest rate cuts. After this data, it also laid a good foundation for the decline in the market. If the price goes up again, it will still rely on the 3365 level to go short again. The data is obviously bearish, and it scared a lot of long positions before it was released.
Gold reference ideas:
Continue to short when it rebounds to around 3358-3365, with a target around 3350-3340;
Go long when it falls back to around 3335-3330, with a target around 3350.
Gold fell under pressure, and the watershed is 3321.
⭐️Gold Information:
During the Asian session on Wednesday, gold prices (XAU/USD) continued to be under pressure, falling below the $3,300 mark, hitting the lowest point in more than a week. The decline in gold prices comes as the market generally believes that the Federal Reserve (Fed) will maintain high interest rates for a longer period of time, especially as the market expects that tough U.S. tariffs may exacerbate inflation in the coming months.
Such expectations have pushed up U.S. Treasury yields and stabilized the U.S. dollar (USD) near a two-week high hit on Tuesday - a key resistance for the non-yielding precious metal, which continues to face downward pressure.
⭐️Personal comments:
Gold price fell below support, Dow Jones H1 pattern, gold price fell below 3300
⭐️Set gold price:
🔥Sell gold area: 3344-3446 SL 3351
TP1: $3335
TP2: $3320
TP3: $3302
🔥Buy gold area: $3256-$3254 SL $3249
TP1: $3268
TP2: $3280
TP3: $3298
⭐️Technical analysis:
Set reasonable sell orders based on technical indicators EMA 34, EMA89 and support and resistance areas.

The idea is clear, gold falls as expected!The gold market is just as I predicted. I have repeatedly warned everyone not to chase the 3350-3355 line. The technical side needs to step back. Now, it just proves the idea I gave. After gold hit the highest line of 3358, it stepped back to the 3337 line and started to fluctuate. Our 3355 short order plan successfully touched 3340 to stop profit and exit. From the current gold trend, it should fluctuate like this before closing. After the opening, we will step back and go long as planned. Focus on the 3330-3335 line below. If it does not break, we can consider going long.
From the current gold trend analysis, pay attention to the 3360-3370 line of pressure on the top, and the short-term support on the bottom is around 3330-3335. Focus on the key support at 3315-3325. Relying on this range as a whole, maintain the main tone of low-long participation unchanged, wait for the pullback to confirm the support and then intervene when the opportunity arises. In the middle position, keep watching and do less, chase orders cautiously, and wait for the entry opportunity after the key points are in place.
Gold operation suggestion: go long around 3315-3325, target 3340-3350.

Where will gold go?In 4 hours, it has fallen below the previous low of 3295, and will continue to fall. There are two supports below, namely 3280 and 3265. Don't expect a big rebound before going short in a negative market. If the rebound is large, it will not fall. This kind of negative decline is generally judged by the 15- and 30-minute patterns. When resistance appears in the big cycle, the market has actually fallen a lot.
Today, I think the pressure is mainly in the 3300 and 3310 areas. 3310 can be considered as the pressure of the top and bottom conversion. Pay attention to 3280 and 3265 below. If you consider going long, these two positions are the main positions. For the time being, the general direction is mainly short.

Gold shorting opportunity not to be missedGold hit the key resistance of 3350 and then fell under pressure, reaching a low of 3309, and was temporarily supported by the low point on Wednesday. The intraday showed a pattern of rapid decline after a volatile rise, highlighting the long-short tug-of-war pattern. The hourly line fell again after a pullback to 3328, indicating that there is still room for short-term retracement. The current operation needs to focus on key points: short orders can be entered again near the pullback of 3328-3335. If the market continues to decline, focus on the support range of 3300-3290, and long orders can be arranged if it stabilizes. The overall idea of oscillation is maintained. Before effectively breaking through 3350 or losing 3290, high-altitude and low-long are still the main strategy.
Gold recommendation: short near 3328-3335, target 3315-3305

Gold is obviously suppressed, so we must go short!Yesterday, gold continued to fluctuate and fall under pressure at the 3360 mark. The US market further accelerated downward to break through the 3300 integer mark and reached a weak closing near 3295. The daily K-line closed with a suppressed fall and broke the bottom of the middle shadow. The overall gold price continued to fluctuate and fall in a weak rhythm. After reaching the lowest level of 3295, it rebounded and closed at 3323. Today, it opened at 3324. As of now, it has reached the highest level of 3337. At present, we are focusing on the suppression of 3340-3348. If the rebound is under pressure, we can still intervene in short orders. The recent market trends are basically the same - bottoming out and rebounding. In terms of operation, continue to keep shorting under pressure and long positions after bottoming out and rebounding.
From the current market trend, today's upper short-term resistance focuses on the 3338-3342 area. If it rebounds to this range and is under pressure, you can consider choosing an opportunity to arrange short orders. The lower support focuses on the 3315-3305 line. If it falls back and stabilizes, there is a possibility of a short-term rebound. The overall situation is still in a range-bound structure. It is recommended to focus on key points, buy high and sell low, follow the trend, and strictly control risks. For more specific operation points, please pay attention to the 🌐 notification at the bottom.

The current price of gold is 3330-3335, go short directly!Gold rebounded after hitting the bottom of 3295. At present, gold is just a rebound, not enough to reverse directly. Gold rebounds and continues to be short. After all, the daily line has fallen continuously, so the short momentum of gold is still there. In the short term, the rebound of gold is just a repair after oversold. Gold is currently priced at 3330-3335 and is directly short.
The 1-hour moving average of gold continues to be arranged in a short position downward. After gold fell below the previous low of 3340 yesterday, gold has not been able to rebound again. In the short term, 3340 has become the key to long and short positions. In the short term, gold rebounds below 3340 and continues to be shorted. If gold breaks through and stabilizes at 3340 again, then gold may start to fluctuate again. Before breaking through 3340, gold is still weak and continues to maintain a short trend.
