Gold 2H – Bearish Channel Breakdown SetupChart Overview
This chart shows a bearish setup for Gold, suggesting a short (sell) trade with the following key components:
🔵 Channel Analysis
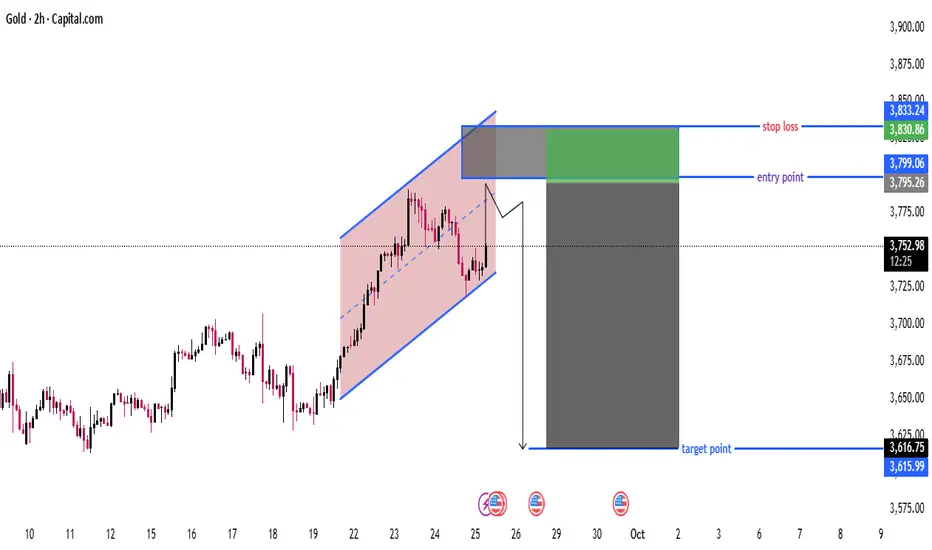
Rising Parallel Channel: Price has been moving within an ascending channel (pink shaded area), indicating a short-term uptrend.
The recent candle breaks or touches the lower boundary of this channel, hinting at a potential breakdown.
📉 Trade Setup
This looks like a short (sell) trade idea based on a potential breakout to the downside.
Component Level Details
Entry Point 3,799.06 Entry zone marked in green; at/near the lower trendline of the ascending channel
Stop Loss 3,833.24 Just above the recent highs and the channel top
Target Point 3,616.75–3,615.99 Target area marked in blue; aligns with a prior support zone
✅ Trade Logic
Bearish Bias: Price action shows weakening momentum near the top of the channel.
Breakdown Expected: Entry assumes a breakdown of the ascending channel.
Risk-Reward Ratio (RRR): Very favorable — large potential move down compared to the stop loss range.
📊 Risk Management
Stop Loss: Properly placed above resistance zone — protects against false breakouts.
Target Zone: Based on historical support/resistance structure.
RRR Estimate: Approx. 1:5+, which is excellent if the move materializes.
⚠️ Potential Risks
False Breakout: Price could rebound back into the channel, invalidating the bearish thesis.
Fundamental Triggers: Gold is sensitive to macroeconomic news (e.g., interest rate changes, geopolitical tension, inflation data).
📌 Summary
This is a well-structured short trade setup based on a rising channel breakdown.
With a clear entry, stop loss, and profit target, it presents a high-reward, controlled-risk opportunity.
Best confirmed with:
Bearish candlestick confirmation at the entry point
Volume spike on breakdown
Fundamental catalysts supporting gold weakness
Goldsellsetup
PPI good for USD - Gold falls ! today⭐️ Smart investment, Strong finance
⭐️ GOLDEN INFORMATION:
Gold prices bounce back even as the US Dollar consolidates on Tuesday. However, the rise could be restrained as investors anticipate key US inflation data. Continued high US rates have pressured gold prices recently, but increasing Middle East tensions may temporarily support them.
⭐️ Personal comments NOVA:
Gold price is still recovering - however today's PPI data is likely to support the dollar - Gold is under selling pressure
⭐️ SET UP GOLD PRICE:
🔥BUY GOLD zone: $2308 - $2306 SL $2300
TP1: $2315
TP2: $2322
TP3: $2330
🔥SELL GOLD zone: $2376 - $2378 SL $2383
TP1: $2370
TP2: $2360
TP3: $2350
⭐️ Technical analysis:
Based on technical indicators EMA 34, EMA89 and support resistance areas to set up a reasonable SELL order.
⭐️ NOTE:
Note: Nova wishes traders to manage their capital well
- take the number of lots that match your capital
- Takeprofit equal to 4-6% of capital account
- Stoplose equal to 2-3% of capital account
- The winner is the one who sticks with the market the longest
