#XAUUSD(GOLD): +1200 Pips Selling Opportunity! Dear Traders,
Gold has repeatedly retested the 5101 region but has been rejected. We believe the price has exhausted and bearish volume has increased in the market. To enter, we need a clear reversal signal and a retest of a key support level.
Currently, our only target is a swing trade. This analysis can also be used for intraday trading. Your stop loss will depend on your risk management.
Good luck and feel free to like and comment for more.
Team Setupsfx_
Goldsetup
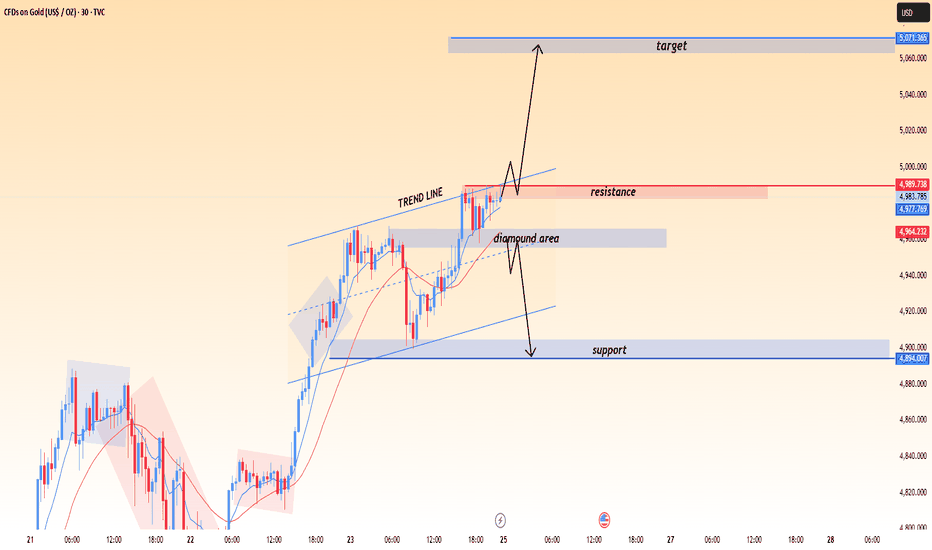
XAUUSD (Gold) – 30M Ascending Structure & Breakout WatchPrice is trading in an ascending channel, holding above the EMA and rising trendline. Market is currently testing a key resistance zone, where a breakout could open upside targets, while rejection may lead to a pullback toward support.
Key Levels:
Resistance: 4985 – 5000
Support: 4890 – 4905
Upside Target: 5050 – 5070
Bullish bias remains valid above the trendline. Wait for a confirmed breakout or pullback reaction before entries. Risk management is essential.
GOLD(XAUUSD): Latest Update 23/01/2026 Hello Traders
Yesterday we analysed gold’s price at $4815 and set a target of $4950. Our target has been successfully hit and the price has surpassed $4950. Based on this analysis, we believe the price will likely continue its upward momentum until it reaches around $5000, a critical level for many investors worldwide.
We recommend setting a swing take profit at $5000 and a stop loss based on your risk management strategy. This analysis can also be applied to intraday trading.
If you enjoyed our work, please like and comment. Follow us for more trading setups.
Team Setupsfx_
Gold Extends Strong Rally, Minor Pullback Possible📊 Market Overview:
Gold prices continued to surge during the Asian session and early European trading as safe-haven demand increased. The US dollar weakened amid expectations that the Fed will maintain a cautious stance on monetary policy, while geopolitical risks and global economic uncertainty remain elevated. Gold has broken above the psychological 5,000 USD/oz level and set a new all-time high this morning.
________________________________________
📉 Technical Analysis:
• Key Resistance:
o 5085 – 5093 (highest level reached during the Asian session)
o 5120 – 5150 (Fibonacci extension & psychological zone)
• Nearest Support:
o 5040 – 5025 (short-term support, breakout zone)
o 4985 – 4965 (strong support, recent correction low)
• EMA:
Price remains well above EMA 09 on the M15 & H1 timeframes → very strong bullish trend, though EMA expansion suggests potential exhaustion.
• Candlestick / Volume / Momentum:
Strong consecutive bullish candles with sustained high volume. However, signs of buying pressure weakening appear near the 5085–5093 zone, indicating a risk of short-term technical correction.
________________________________________
📌 Outlook:
Gold may continue to rise if price holds above the 5040 zone and decisively breaks above 5093.
Conversely, a short-term pullback is possible if price fails to break 5093 and profit-taking pressure emerges near the highs.
________________________________________
💡 Suggested Trading Strategy:
🔻 SELL XAU/USD at: 5150 – 5153
🎯 TP: 40 / 80 / 200 pips
❌ SL: 5156.5
🔺 BUY XAU/USD at: 5040 – 5043
🎯 TP: 40 / 80 / 200 pips
❌ SL: 5036.5
XAU/USD BUY SIGNAL – Bullish Continuation SetupOn the 15-minute Gold Spot / U.S. Dollar (XAU/USD) chart (OANDA), price is currently trading around 4,982 - 4,987 levels after a strong bullish push from lower supports. The chart shows a clear uptrend with higher highs and higher lows, supported by multiple green candles and high bullish volume on the recent breakout. Key Bullish Factors: Strong Support Zone: Price is holding firmly above the key support area around 4,936 - 4,966 (marked with black lines and green shaded zones), where previous pullbacks found buyers. This level has acted as a solid floor multiple times, preventing deeper corrections.
High Bullish Volume: Recent candles display increased buying pressure (green volume bars dominating), indicating strong accumulation by buyers as price consolidates near highs.
Uptrend Structure: The overall trend remains intact with an ascending channel/pattern visible. Price has broken and retested higher resistances turned supports, confirming bullish momentum. Dotted trendline support adds confluence.
Momentum Indicators: The rally has pushed through prior consolidation zones (teal boxes), with price rejecting lower levels aggressively. Targets upside toward 5,000 - 5,030 (psychological round number and upper resistance boxes).
Broader Context: Gold continues its parabolic 2026 rally, driven by safe-haven demand, central bank buying, and macro uncertainties. Recent highs near 4,990+ reinforce the bullish bias.
Entry Suggestion: Buying from current levels (~4,982 - 4,987) or on dips to support around 4,966 - 4,970, with tight stops below 4,936 for risk management.Targets:TP1: 5,000 - 5,020
TP2: 5,030+
Longer-term: Extension toward 5,100+ if momentum sustains.
This setup looks primed for continuation higher as long as price holds above the key support zone. Watch for volume confirmation on any breakout.This is not financial advice. Trading involves significant risk of loss. Always conduct your own analysis, use proper risk management, and never risk more than you can afford to lose. Past performance is not indicative of future results.#Gold #XAUUSD #GoldTrading #BuyGold #BullishGold #XAUUSDBuy #TradingSignal #Forex #TechnicalAnalysis #Investing #GoldBull #PreciousMetals #Trader #MarketUpdate #Investor #SmartTrading #Premiumtrader57
Gold Approaches $5,000 Resistance Amid PRZ & Divergence🎂 Today marks the beginning of a new chapter in my life.
When I blow out the candles, my greatest wish is not just for myself —
I wish health, peace, freedom, and happiness for all people around the world.
May every heart feel calm, every soul feel safe, and every dream find its way.
This year, I hope we grow stronger together, share deeper insights, and move toward success with wisdom, profit, and humanity.
Thank you for being part of my journey. 🤍✨
-----------------------------------
With the start of this week, gold( OANDA:XAUUSD ) has opened with a significant gap upward, driven by tensions surrounding Greenland and Trump’s threats of tariffs on European countries, as well as the potential escalation of tensions in the Middle East. This has contributed to gold’s upward trend over the past few days.
Over the last few days, gold has been creating new all-time highs with each passing day.
The question is whether gold can break through the psychological resistance level of $5,000 without any correction, or if it will continue its bullish trend smoothly.
Gold is currently near the Potential Reversal Zone(PRZ) around the Round Number: $5,000.
Looking at it from an Elliott Wave perspective on the 1-hour timeframe, it seems that gold is completing its wave 5, which could occur within the Potential Reversal Zone(PRZ) .
We also notice a significant negative Regular Divergence(RD-) between two consecutive peaks.
Today’s upcoming US Flash PMI and Consumer Sentiment data could act as a short-term catalyst for Gold. If Manufacturing and Services PMI print clearly stronger than expectations, it would signal ongoing economic resilience in the US, support the USD, and reduce near-term rate-cut expectations. In that scenario, Gold may face short-term downside pressure or a corrective pullback, as the market reprices a more patient Federal Reserve stance.
I expect gold to decline from the Potential Reversal Zone(PRZ) , possibly dropping to around $4,884. If the support lines are broken, we could see further declines toward $4,851.
First Target: $4,884
Second Target: $4,851
Stop Loss(SL): $5,016
Points may shift as the market evolves
Note: It’s important to note that when an asset sets a new all-time high, technical analysis becomes less reliable since it lacks historical data.
Note: In general, it is not possible to provide a medium-term or long-term analysis for gold because there are currently many parameters that can affect the gold trend.
I’d love to hear your thoughts on gold. How long do you think it can maintain this bullish trend?
💡 Please respect each other's opinions and express agreement or disagreement politely.
📌 Gold Analyze (XAUUSD), 1-hour time frame.
🛑 Always set a Stop Loss(SL) for every position you open.
✅ This is just my idea; I’d love to see your thoughts too!
🔥 If you find it helpful, please BOOST this post and share it with your friends.
kvmev - XAUUSD FORECAST - 25/01/2026 - 30/01/2026Gold is currently sitting at all-time highs.
Knowing that DXY usually moves opposite of Gold, we can see it ended the week rejecting $98.000 and closing below a strong support zone at $97.700 with a heavy bearish engulfing candlestick.
If DXY continues down towards the next support zone at $96.600 it could result in Gold continuing towards the upside and possibly reaching $5030-$5050
We may also see accumulation happen early on in the week where DXY ascends to retest the resistance level at $97.700 and Gold retesting $4965 before it breaks structure at $4985 and continues bullish.
Will be watching Gold for a break of structure & break and retest on the 30m/1h time frame for an entry.
XAUUSD Outlook : Bullish Momentum Remains Strong Toward 5,000Gold continues to show solid strength, with price flow and momentum clearly favouring further upside but we are waiting for the reaction now at this level. The move highlighted on the chart reflects sustained buying interest and healthy continuation. At this stage, the focus remains on staying aligned with the dominant direction and letting the market do the heavy lifting, instead of trying to call tops too early. As long as this momentum remains intact, the bullish bias stays firmly in place.
Disclosure: We are part of Trade Nation's Influencer program and receive a monthly fee for using their TradingView charts in our analysis.
Gold: Why Longs From 4300 Are Still Safe (Before the Big Reset)
Gold’s move over the past sessions has been extreme and abnormal by historical standards, with price accelerating hundreds of dollars without meaningful pullbacks. When this happens, it’s usually not driven by retail momentum, but by algorithmic liquidity expansion.
In this type of environment, markets often do one last upside extension before any real correction begins.
Why Price May Still Push to 5200–5500
When gold trends this aggressively:
Shorts pile in early, expecting “overbought” reversals.
Stops stack above psychological levels
Liquidity builds higher, not lower
To fully reset positioning, price often needs to push higher than expected.
A move into the 5200–5500 zone would:
Flush remaining short positions
Maximize late long participation
Complete the expansion phase
Only after that does mean reversion typically begin.
Longs From 4300: Position Still Protected
If you’re long from the 4300 region, you are positioned from the base of expansion:
No structural breakdown has occurred
Trend remains intact
Pullbacks so far are corrective, not distributive
From a risk perspective, holding longs toward 5200 remains reasonable while price stays above prior structure.
What Comes After Expansion
Once expansion is complete:
Sell-off risk increases significantly
Price may retrace aggressively
Untested levels below 4500 become likely targets
Parabolic moves rarely end softly.
Final Thought
This is not financial advice, but markets driven by liquidity and algorithms don’t reverse until everyone who’s early is wrong.
Shorting too early gets punished.
Waiting for extremes is where risk flips.
Trade safe and protect capital.
Gold Reaches New ATH as Geopolitical Risks Shift – What’s Next!?This week, Gold( OANDA:XAUUSD ) opened with a significant gap due to rising tensions between Europe and the U.S. over Greenland, as well as threats from Trump regarding new tariffs on European countries. Additionally, the potential escalation of tensions in the Middle East has fueled gold’s bullish trend over the past few days.
Recently, at the Davos meeting, Trump stated that there would be no military action regarding Greenland, indicating a potential easing of tensions. This could weaken the fundamental bullish momentum of gold.
Over the past few days, gold has been trading within an ascending channel and has been setting new all-time highs almost every day, raising the question of how long this bullish trend can continue. From a technical standpoint, and considering the fundamental developments, any new geopolitical events could impact gold’s bullish momentum.
It’s important to note that when an asset sets a new all-time high, technical analysis becomes less reliable since it lacks historical data.
From an Elliott Wave perspective, it appears that gold is completing wave 5, which may end within the Potential Reversal Zone(PRZ) .
I expect that once gold breaks below the ascending channel’s lower line, it will begin a corrective phase, potentially dropping to around $4,749.
First Target: $4,749
Second Target: Support line
Stop Loss(SL): $4,984(Worst)
Points may shift as the market evolves
I’d love to hear your thoughts on gold. How long do you think it can maintain this bullish trend?
💡 Please respect each other's opinions and express agreement or disagreement politely.
📌 Gold Analyze (XAUUSD), 1-hour time frame.
🛑 Always set a Stop Loss(SL) for every position you open.
✅ This is just my idea; I’d love to see your thoughts too!
🔥 If you find it helpful, please BOOST this post and share it with your friends.
Gold Extends Strong Rally – Targeting 4,900 USD📊 Market Overview:
Global gold prices continue to surge strongly in this morning’s session — mainly driven by escalating geopolitical concerns, safe-haven inflows, and a relatively weaker USD. Tensions between the U.S. and the European Union over control of Greenland have added further upside momentum as investors rotate away from riskier assets.
________________________________________
📉 Technical Analysis:
• Key Resistance:
– ~4,880–4,890 USD/oz
– ~4,900–5,000 USD/oz
• Nearest Support:
– 4,800–4,810 USD/oz
– 4,760–4,775 USD/oz
• EMA (9):
Price is trading above the EMA 09, confirming a strong short-term bullish trend.
• Candlestick / Volume / Momentum:
A series of strong bullish candles with large bodies and sustained high volume indicate firm buyer control. Upward momentum remains intact, with multiple new intraday highs.
________________________________________
📌 Outlook:
Gold may continue its short-term uptrend as long as geopolitical risks and safe-haven demand persist. However, technical reactions around the 4,840–4,900 zone will be crucial in determining the next directional move.
________________________________________
💡 Proposed Trading Strategy:
🔻 SELL XAU/USD at: 4,897–4,900
🎯 TP: 40 / 80 / 200 pips
❌ SL: 4,904
🔺 BUY XAU/USD at: 4,815–4,812
🎯 TP: 40 / 80 / 200 pips
❌ SL: 4,808.5
XAUUSD Ready for Pullback – Key Levels to WatchPrice is rejecting from the upper channel and showing weakness near resistance. As long as price remains below the supply zone, bearish continuation is expected toward lower demand.
Sell Zone / Resistance: 4,620 – 4,633
First Target: 4,562
Main Target Zone: 4,520 – 4,530
Strong Support: 4,483
Looking for pullback and rejection from resistance before continuation lower.
Bias remains bearish unless price breaks and holds above 4,633.
Trade with confirmation and proper risk management.
Gold Consolidates After Strong Rally: Bullish Structure Still InGold is currently digesting a strong impulsive move higher, with price transitioning into a consolidation phase rather than showing signs of trend failure. The structure suggests healthy pause and rebalancing, where momentum cools while buyers maintain overall control. This type of behaviour often reflects strength beneath the surface, as the market absorbs recent gains before revealing its next directional intent.
Disclosure: We are part of Trade Nation's Influencer program and receive a monthly fee for using their TradingView charts in our analysis.
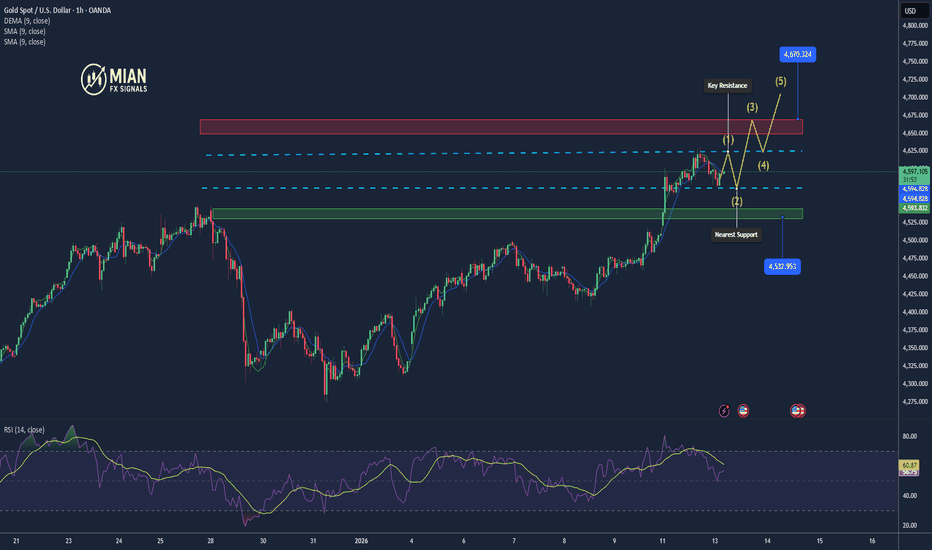
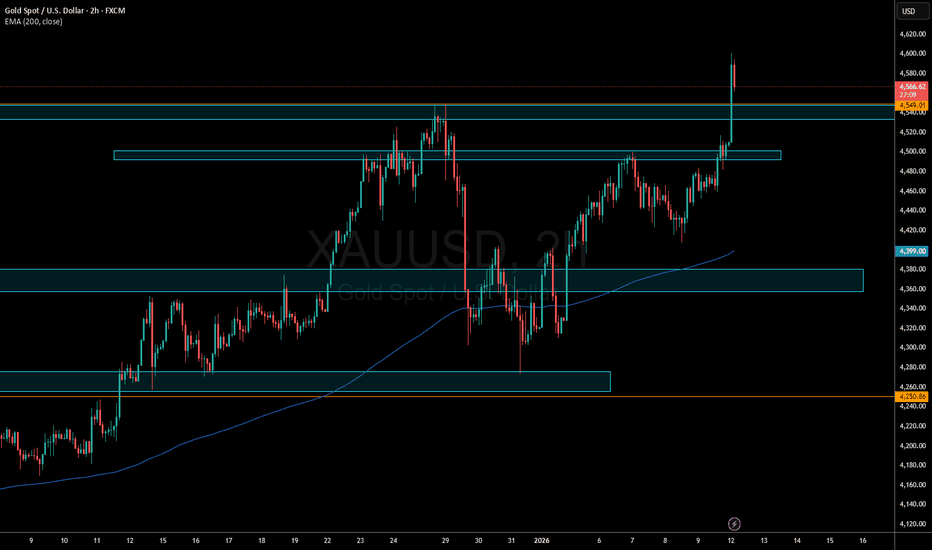
Gold Breaks Resistance on Middle East Tensions —New ATHs LoadingWith the start of the new week, and considering the ongoing developments in Iran and the Middle East, Gold( OANDA:XAUUSD ) has postponed its bearish scenario and even opened with a Gap, indicating that it successfully formed a new all-time high. This suggests that the likelihood of increased tensions in the Middle East remains high.
Gold has currently broken through the resistance zone($4,551-$4,492) with strong momentum.
From an Elliott Wave perspective, it appears that gold is completing wave 5, and this wave 5 is an extended type.
I expect that after a pullback and a retest of the Fibonacci levels, gold will resume its upward movement and could rise to around $4,619 before targeting the next resistance line.
Note: It’s crucial to pay close attention to the developments in the Middle East and other financial markets, and be prepared for any scenario.
Note: When an asset reaches a new All-Time High (ATH), technical analysis becomes more challenging. The main reason is the lack of historical price data above this level.
First Target: $4,619
Second Target: Resistance line
Stop Loss(SL): $4,503(Worst)
Points may shift as the market evolves
💡 Please respect each other's opinions and express agreement or disagreement politely.
📌 Gold Analyze (XAUUSD), 1-hour time frame.
🛑 Always set a Stop Loss(SL) for every position you open.
✅ This is just my idea; I’d love to see your thoughts too!
🔥 If you find it helpful, please BOOST this post and share it with your friends.
Gold is forming a triple top; continue shorting!Gold prices opened higher today, accelerating to around 4639 after breaking through 4630 before stalling and falling back. For two consecutive days, gold prices have broken new highs, but the momentum has been very limited. Yesterday saw a pullback of over $50, indicating some divergence in direction around the 4640-4650 level. Options data also shows a gradual decrease in call options, suggesting a possible correction this week. Although the daily chart shows a new high, it closed with a bearish candle. While the overall trend remains strong, the possibility of a correction is something we need to be aware of. Currently, we can consider a short position around 4640-4650. If the pullback is successful, the key support level is around 4600, where we can consider a long position. The key support level is around 4570. If it breaks below 4570, we should abandon long positions for now, as a sharp drop is possible. If it unexpectedly breaks through 4650, even if there is a short-term rally, the upward momentum should be limited.
Gold Extends Its Rally, Caution Advised After Setting a New High📊 Market Developments:
Gold prices continue to hold at elevated levels after setting a new all-time high at 4,630 USD/oz in the previous session. The bullish momentum is supported by expectations that the Fed will maintain an accommodative monetary policy, weakening U.S. bond yields, and sustained safe-haven demand. However, profit-taking pressure has emerged as prices failed to hold above the peak.
📉 Technical Analysis:
• Key Resistance:
– 4,615 – 4,630 (all-time high, strong supply zone)
– 4,650 – 4,670 (Fibonacci extension, psychological resistance)
• Nearest Support:
– 4,580 – 4,570 (short-term support, recent pullback low)
– 4,545 – 4,530 (strong support zone, dynamic EMA)
• EMA:
Price remains above EMA 09 → the primary trend is still bullish, but signs of overextension from the EMA are emerging.
• Candlestick / Volume / Momentum:
An upper-wick candlestick appeared near the 4,630 peak, while volume is gradually weakening → indicating slowing buying momentum and a higher probability of correction or consolidation before the next directional move.
📌 Outlook:
Gold may experience a short-term correction if it fails to break above the 4,615 – 4,630 zone, but the bullish trend remains intact as long as prices hold above 4,550.
________________________________________
💡 Proposed Trading Strategy:
🔻 SELL XAU/USD at: 4,667 – 4,670
🎯 TP: 40 / 80 / 200 pips
❌ SL: 4,674
🔺 BUY XAU/USD at: 4,575 – 4,572
🎯 TP: 40 / 80 / 200 pips
❌ SL: 4,568.5
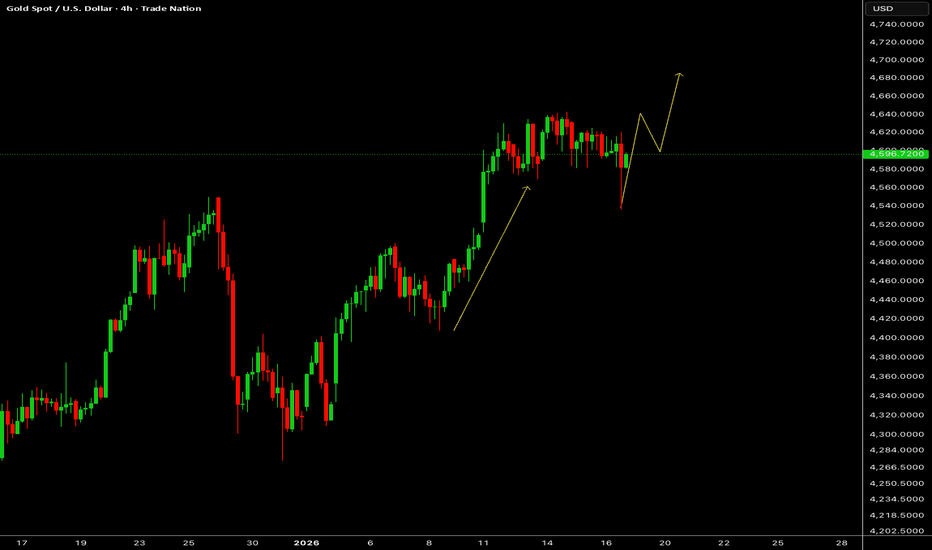
GOLD (XAUUSD) Bullish Bias | Buy on Dips Gold is showing a strong bullish structure on the higher timeframe. Price is holding above key support zones, indicating continuation to the upside.
📌 Buy Zones:
– Look for buying opportunities near the highlighted support areas
– Confluence with structure & demand zones
🎯 Target: 4695
🛑 Risk Management: Always use a proper stop-loss and manage position size accordingly.
This setup aligns with trend continuation. Wait for confirmation before entry and avoid over-leveraging.
⚠️ This is not financial advice. Trade at your own risk.
Hashtags:
#Gold #XAUUSD #Bullish #BuyTheDip #TradingView #Forex #PriceAction #SupportResistance #SmartMoney #TrendTrading
Gold May See a Short-Term Pullback After Hitting 4601📊 Market Overview:
Gold surged strongly in the Asian session, reaching a new high at 4601 USD amid safe-haven demand, expectations of a dovish Fed stance, and a weaker US dollar. After hitting the peak, short-term profit-taking emerged, pushing price back to around 4565 USD.
📉 Technical Analysis:
• Key Resistance Levels:
o 4588 – 4601
o 4620 – 4635
• Nearest Support Levels:
o 4550 – 4542
o 4518 – 4505
• EMA:
Price remains above EMA 09, indicating the overall bullish trend is still intact despite the current pullback.
• Candlestick / Volume / Momentum:
A long upper wick candle formed near 4600 with elevated volume, signaling price rejection. Bullish momentum is weakening, suggesting a short-term consolidation or correction phase.
📌 Outlook:
Gold may continue to correct in the short term if it fails to reclaim the 4588–4601 zone; however, the broader bullish structure remains valid as long as price holds above the 4520 support area.
________________________________________
💡 Suggested Trading Strategy:
🔻 SELL XAU/USD
• Entry zone: 4633 – 4636
• 🎯 TP: 40 / 80 / 200 pips
• ❌ SL: 4639.5
🔺 BUY XAU/USD
• Entry zone: 4545 – 4542
• 🎯 TP: 40 / 80 / 200 pips
• ❌ SL: 4538.5
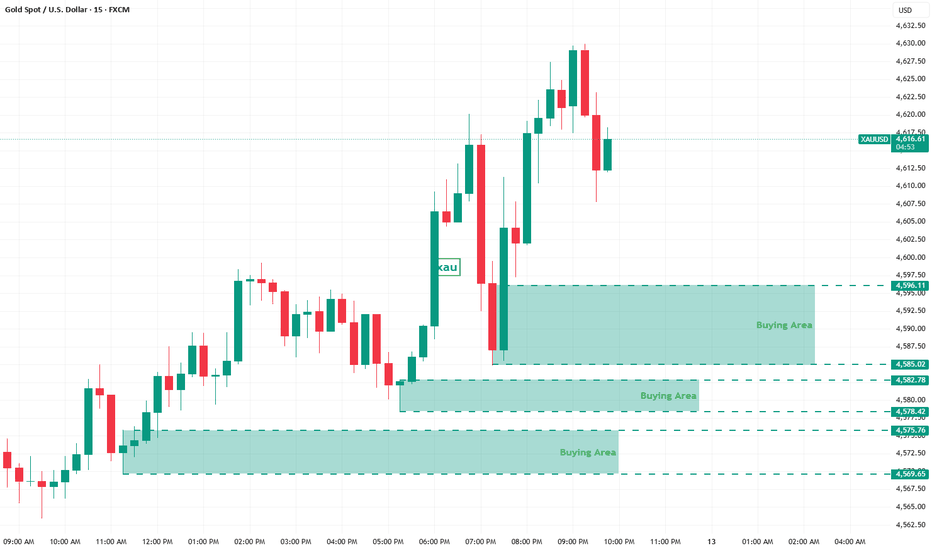
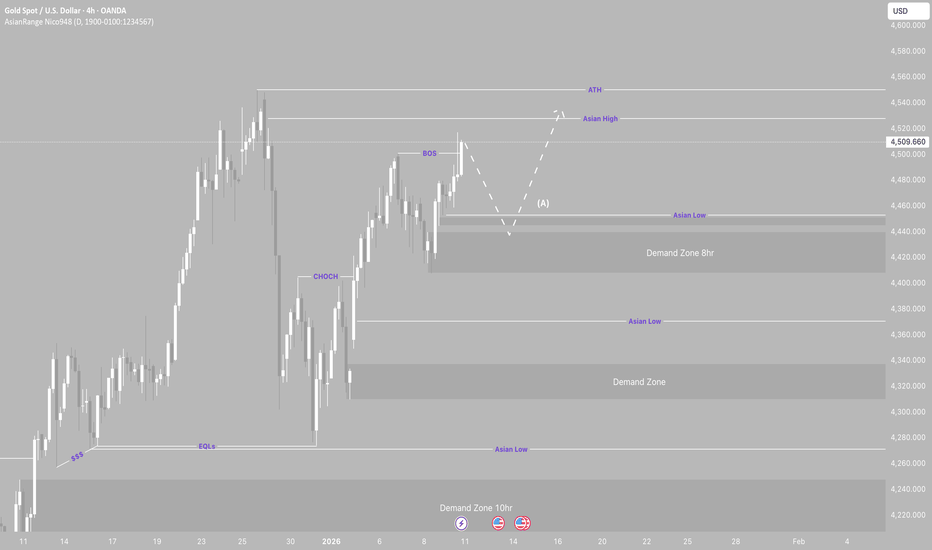
GOLD possible long oppurtunities.My bias this week is for price to continue bullish. Although price initially reacted from a supply zone, it broke structure to the upside, confirming the continuation of the bullish trend. This opens the door for a potential push toward ATH liquidity.
I’ve marked out a few demand zones where price could retrace, with my main focus on the deeper 8hr demand zone, which could act as a strong base for the next bullish rally.
Confluences for Gold Buys:
• Gold remains strongly bullish
• Break of structure confirms trend continuation
• Two clean demand zones left unmitigated
• Asia highs and ATH liquidity resting above current price
P.S. If price makes new highs without retracing, I’ll stay patient and wait for the next valid opportunity to present itself.
XAU/USD Bullish Continuation | Trendline Support & Upside TargetXAU/USD Bullish Continuation | Trendline Support & Upside Targets
Description (Professional & TradingView-Compliant):
Gold (XAU/USD) is respecting a rising trendline and holding above the buying support level, keeping the bullish structure intact. The recent consolidation suggests a potential fake breakout before continuation. As long as price remains supported above the trendline, upside momentum may resume toward the first target, with further extension possible toward the final liquidity target.

