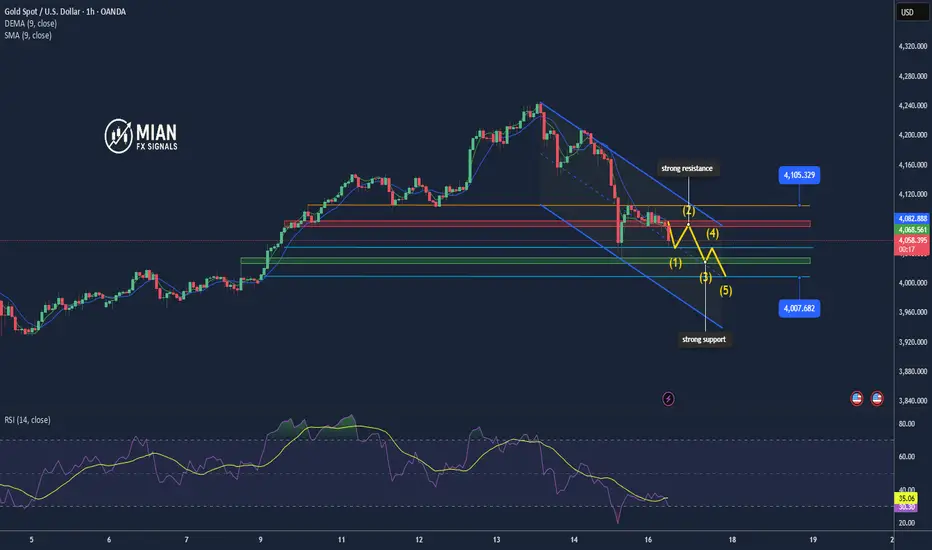
Gold: Bounce or Breakdown? Support Says BounceAs I expected in the previous idea , Gold touched the First Target($4,049) but failed to break the support zone($4,053 – $4,025).
In terms of Elliott Wave theory, given that Gold failed to break the support zone($4,053 – $4,025), we can expect bullish waves, at least in the short term.
---------------------------------------------
Minutes ago, the U.S. labor market indicators were released — including NFP, Average Hourly Earnings, and the Unemployment Rate.
Here are the actual numbers:
NFP: 119K (vs. 53K expected) — much stronger
Hourly Earnings m/m: 0.2% (vs. 0.3% expected) — weaker
Unemployment Rate: 4.4% (vs. 4.3% expected) — higher
Gold’s Fundamental Reaction:
Today’s data is mixed in a very interesting way:
Stronger NFP = USD bullish pressure
A print of 119K signals a stronger labor market rebound, which normally puts downside pressure on gold.
But weaker wage growth (0.2%) = lower inflation pressure
This reduces the urgency for further Fed tightening, which is gold-positive.
Higher unemployment (4.4%) = economic cooling signal
This supports the idea that the economy is slowing beneath the surface — also positive for gold.
Net Result:
Gold is likely to experience initial volatility, but the combination of weaker wage inflation + higher unemployment offsets the strong NFP.
This means gold could find support after the first drop, especially if markets focus on softer inflation expectations and rising unemployment.
---------------------------------------------
I expect Gold to rise to at least $4,137 based on the above explanation.
It is also possible that Gold will form an ascending channel. One of the upside targets for gold could be near the upper line of the ascending channel(possible).
First Target: $4,137
Second Target: $4,174
Stop Loss(SL): $4,017
Points may shift as the market evolves
💡 Please respect each other's opinions and express agreement or disagreement politely.
📌 Gold Analyze (XAUUSD), 1-hour time frame.
🛑 Always set a Stop Loss(SL) for every position you open.
✅ This is just my idea; I’d love to see your thoughts too!
🔥 If you find it helpful, please BOOST this post and share it with your friends.
Goldsetup

Gold May See a Minor Pullback Before Gaining Bullish Momentum📊 Market Update
Gold is currently trading around ≈ 4,050 USD/oz. A firm US Dollar is keeping gold from breaking higher, while markets await clearer signals from the Federal Reserve and upcoming US economic data. Cautious sentiment is keeping gold in a tight consolidation range.
📉 Technical Analysis
Resistance Levels:
• R1: ~ 4,100
• R2: ~ 4,135 (new resistance – recent swing high, strong selling pressure likely)
Support Levels:
• S1: ~ 4,020
• S2: ~ 3,995 – 4,000 (strong support, aligned with recent lows and trend validation)
EMA & Trend:
• Price is below the EMA 09, indicating slowing bullish momentum and short-term consolidation.
• If price moves back above EMA 09 on H1 → bullish momentum may resume.
Candles – Volume – Momentum:
• Narrow-range movement on H1/H4 → sideways market.
• Volume slightly lower → traders are waiting for a catalyst.
• Momentum is soft but no strong reversal signals yet.
________________________________________
📌 Market View
Gold may pull back to the 4,020 or 4,000 support regions before regaining upward momentum.
A weaker USD or negative US economic data could push gold upward again toward 4,100 – 4,135.
________________________________________
💡 Trading Strategy
🔻 SELL XAU/USD at: 4,090 – 4,093
🎯 TP: 40 / 80 / 200 pips
❌ SL: 4,096
🔺 BUY XAU/USD at: 4,023 – 4,020
🎯 TP: 40 / 80 / 200 pips
❌ SL: 4,017

XAU/USD 24 November 2025 Intraday AnalysisH4 Analysis:
-> Swing: Bullish.
-> Internal: Bullish.
Analysis and bias remains the same as analysis dated 20 October 2025.
Price has printed as per previous intraday expectation by printing a bearish CHoCH which indicates, but not confirms, bullish pullback phase initiation.
Price is currently trading within an established internal range, however, I will continue to monitor price with regards to depth of pullback.
Intraday expectation:
Price to continue bearish, react at either discount of 50% internal EQ, or H4 supply zone before targeting weak internal high priced at 4,380.990.
Note:
The Federal Reserve’s sustained dovish stance, coupled with ongoing geopolitical uncertainties, is likely to prolong heightened volatility in the gold market. Given this elevated risk environment, traders should exercise caution and recalibrate risk management strategies to navigate potential price fluctuations effectively.
Additionally, gold pricing remains sensitive to broader macroeconomic developments, including policy decisions under President Trump. Shifts in geopolitical strategy and economic directives could further amplify uncertainty, contributing to market repricing dynamics.
H4 Chart:
M15 Analysis:
-> Swing: Bullish.
-> Internal: Bullish.
As per analysis dated 14 November 2025, price has printed a bearish CHoCH to indicate, but not confirm bearish pullback phase initiation.
Price is currently trading within an established internal range.
Intraday expectation:
Price to trade down to either discount of 50% internal EQ, or M15 demand zone before targeting weak internal high, priced at 4,245.195
Note:
Gold remains highly volatile amid the Federal Reserve's continued dovish stance, persistent and escalating geopolitical uncertainties. Traders should implement robust risk management strategies and remain vigilant, as price swings may become more pronounced in this elevated volatility environment.
Additionally, President Trump’s tariff announcements, particularly against China, are expected to further amplify market turbulence, potentially triggering sharp price fluctuations and whipsaws.
M15 Chart:

Gold may continue to decline toward 4020 – 4015 if 4030 breaks.📊 Market Overview:
Gold has fully broken the strong support zone 4045 – 4040 and quickly dropped to 4030, as the US Dollar strengthens and US Treasury yields rise. The market is reacting to recent Fed signals, giving sellers full control.
________________________________________
📉 Technical Analysis:
• Key Resistance: 4045 – 4055
• Stronger Resistance: 4065 – 4075
• Nearest Support: 4030 – 4032
• Stronger Support: 4020 – 4015
• EMA09: Price is below EMA09 on H1 → short-term bearish trend.
• Candlestick / Volume / Momentum: H1 candles form consecutive lower highs; volume rises on large bearish candles → sellers dominate.
________________________________________
📌 Outlook:
• Gold may continue to decline toward 4020 – 4015 if 4030 breaks.
• Conversely, a clear reversal candle around 4030 could trigger a technical rebound toward 4040 – 4045 before resuming the downtrend.
________________________________________
💡 Suggested Trading Strategy:
🔻 SELL XAU/USD : 4045 – 4048
🎯 TP: 40 / 80 / 200 pips
❌ SL: 4053
🔺 BUY XAU/USD : 4015 – 4012
🎯 TP: 30 / 50 / 100 pips
❌ SL: 4008

Gold Breaks Higher to 4,105 – New Bullish Momentum Confirmed📊 Market Overview
Gold has surged strongly from the 4,084 zone and decisively broke through the 4,102–4,104 resistance area, now trading around 4,105 USD/oz. The rally is supported by a slightly weaker USD, steady U.S. yields, and strong technical buying after the breakout. Buyers are clearly in control.
📉 Technical Analysis
• Nearest Resistance: ~ 4,110 USD/oz
• Additional Resistance: ~ 4,120 USD/oz
• Extended Resistance: ~ 4,135 USD/oz — target if bullish momentum continues.
• Nearest Support: ~ 4,102 USD/oz — fresh breakout zone.
• Additional Support: ~ 4,095 USD/oz — safe pullback level.
• Extended Support: ~ 4,084 USD/oz — key pivot before the rally.
• EMA09: Price is trading well above EMA09, confirming a short-term uptrend.
• Candles & Momentum:
• Strong bullish candles with solid volume → momentum remains strong.
• No significant rejection candles yet → trend remains intact.
📌 Outlook
Gold shows clear bullish momentum after the breakout.
• Holding above 4,102 may lead price toward 4,110 → 4,120, and potentially 4,135 next.
• Only a drop below 4,095 would signal risk of a deeper pullback toward 4,084.
💡 Trade Strategy Suggestions
🔺 BUY XAU/USD
Entry: 4,102 – 4,105 (post-breakout pullback)
🎯 TP: 40 / 80 / 200 pips
❌ SL: 4,098
🔻 SELL XAU/USD (Only with clear rejection)
Entry: 4,118 – 4,121
🎯 TP: 40 / 80 / 200 pips
❌ SL: 4,125

Gold may face short-term pullback📊 Market Movement
Gold is currently trading around USD 4,067/oz. The U.S. dollar is stabilizing while Treasury yields remain firm, which continues to pressure gold. Safe-haven demand is recovering slightly, but the trend is still unclear and lacks strong momentum.
📉 Technical Analysis
• Key Resistance: ~ USD 4,090/oz — area where sellers previously stepped in strongly.
• Additional Resistance: ~ USD 4,110/oz — secondary level if the main resistance breaks.
• Nearest Support: ~ USD 4,030/oz — strong technical reaction zone.
• Additional Support: ~ USD 4,000/oz — psychological level and broader support range.
• EMA09: Price is currently below the EMA09 on short-term charts → indicating a bearish short-term bias.
• Candlestick / Volume / Momentum:
• Recent candles show longer upper wicks → selling pressure appears at higher levels.
• Momentum indicators (MACD, short-term oscillators) are weakening.
• Probability of an immediate strong upward breakout is low; correction risk remains elevated.
📌 Outlook
Gold may decline in the short term if the resistance around USD 4,090 holds and the U.S. dollar continues to strengthen.
If the support at USD 4,030 holds and new buyers step in, a rebound is still possible.
💡 Trade Strategy Suggestions
🔻 SELL XAU/USD at: 4,087 – 4,090
🎯 TP: 40 / 80 / 200 pips
❌ SL: 4,094
🔺 BUY XAU/USD at: 4,026 – 4,029
🎯 TP: 40 / 80 / 200 pips
❌ SL: 4,022

Gold Holds the 4020 Support – Market Awaits the Next Breakout🔸 Market Overview
Gold trades around $4029/oz, slightly down. Daily range 4019–4055 shows strong volatility as traders await upcoming US data.
📊 Technical Analysis
• Short-term trend: mild bearish correction
• Resistance: 4042 – 4055
• Support: 4020 – 4012
• EMA20–50: price below → bearish momentum
• H1 Candle: long upper wick → sellers active
💡 Outlook
Above 4019–4020 → chance for a bounce to 4038–4045.
Below 4019 → drop toward 4010–4005.
No clear reversal yet — wait for confirmation.
🎯 Trade Setups
🔻 SELL XAU/USD: 4042 – 4045
🎯 TP: 40 / 80 / 200 pips
🛑 SL: 4049
🔺 BUY XAU/USD: 4019 – 4022
🎯 TP: 40 / 80 / 200 pips
🛑 SL: 4012

Gold jumps sharply from 4060 to 4083 📊 Market Developments:
• After a strong selloff, gold formed a bottom at 4060 and rebounded aggressively — a clear sign of strong buying pressure returning.
• Price broke back above 4068–4072, invalidating the entire bearish pullback zone.
• The zone 4080–4083 is now acting as a short-term resistance to watch.
________________________________________
📉 Technical Analysis:
• Immediate Resistance: 4085 – 4090
• Extended Resistance: 4096 – 4102
• Immediate Support: 4072 – 4075
• Extended Support: 4060 – 4054
• EMA 09: Price has moved back above the EMA → bullish momentum is returning.
Current candlestick behavior: strong-bodied H1 candles showing solid bullish momentum.
________________________________________
📌 Outlook:
If gold holds above 4075, it may continue rising toward 4088 → 4095.
However, if a strong rejection occurs at 4085–4088, price may retrace back to 4075 before choosing the next direction.
________________________________________
💡 Suggested Trading Strategies:
🔺 BUY if price holds above 4075
• Entry: 4075–4078
• SL: 4070
• TP: 4088 / 4095 / 4102
________________________________________
🔻 SELL at strong resistance
• Entry: 4088–4090
• SL: 4094
• TP: 4080 / 4075 / 4068
________________________________________
🔺 BUY Breakout (only if an H1 candle closes above 4090)
• Entry: 4090–4093
• SL: 4085
• TP: 4102 / 4110 / 4120

Gold Weakens Further After Breaking 4055 – Downside Risk Expands📊 Market Overview
Gold has dropped to 4050 as buying pressure weakens, with the market awaiting fresh catalysts from the European session. Cautious sentiment dominates, preventing buyers from regaining momentum after the earlier rise.
📉 Technical Analysis
Key Resistance Levels
• R1: 4060 – 4068 (near-term resistance)
• R2: 4078 – 4085 (strong resistance during EU–US sessions)
• R3: 4098 – 4105 (major rejection zone; a breakout would confirm a larger bullish trend)
Key Support Levels
• S1: 4050 – 4042 (nearest support)
• S2: 4035 – 4028 (strong support with high probability of rebound)
• S3: 4015 – 4008 (deep support; breaking below may form a medium-term downtrend)
EMA & Momentum
• Price is trading below the EMA 09, confirming short-term bearish momentum.
• Bearish momentum remains strong with weak pullbacks and no reversal patterns.
Candle Structure
• M5–M15 candles show sellers actively suppressing price around 4055.
• A break below 4048 may trigger stronger selling pressure.
📌 Outlook
Gold may continue to decline in the short term if it breaks clearly below 4048, targeting 4042 → 4035.
Conversely, if price closes above 4058, short-term bullish momentum may return, aiming for 4068 → 4078.
💡 Trade Ideas
🔻 SELL XAU/USD : 4082 – 4085
🎯 TP: 40 / 80 / 200 pips
❌ SL: 4088
🟢 BUY XAU/USD: 4011– 4008
🎯 TP: 40 / 80 / 200 pips
❌ SL: 4005
XAU/USD Weekly Plan – Rebound or Breakdown? Key Levels AheadGold experienced a sharp pullback from last week’s 4234 resistance, dropping aggressively on Friday into the 4027 support level before finding temporary support around the 200MA.
Buyers now face early resistance between 4115–4170. A clean break above 4170 would signal that bulls are regaining control, opening the way for a move toward 4232 → 4285.
If price fails to reclaim 4115, we may see another leg lower. A breakdown below 4053 would expose the support zone , with deeper downside risk toward the HTF Support Zone if bearish pressure strengthens.
📌Key levels to watch:
Resistance:
4115
4170
4232
4285
Support:
4078
4053
4027
3996
3968
3921
🔎Fundamental focus:
As the U.S. government reopens for business, all attention will now turn toward when critical data on employment, inflation, and other key economic indicators will be released.

Gold Maintains Uptrend – Waiting for a Pullback for a Safe Buy📌 Market Overview
Gold (XAU/USD) is currently trading around $4200/oz, maintaining strong bullish momentum supported by:
• A weaker USD
• Soft U.S. labor data
• Rising expectations of Fed rate cuts
• Continued safe-haven demand
However, bullish momentum is beginning to slow, suggesting a possible short-term pullback before the next upward move.
📈 Technical Analysis
• Gold remains above key EMAs (EMA20 – EMA100 – EMA200).
• EMA20 at $4176 is acting as dynamic support.
• Strong resistance: $4245 — a breakout could target $4300.
• RSI around 50 → buying pressure still present but not very strong.
• Volume & momentum are weakening → signals a healthy pullback.
🧭 Outlook
The short-term trend remains bullish as long as price stays above $4176 – $4150.
Gold is likely to:
• 🔄 Pull back slightly → then bounce toward resistance at $4245, and potentially $4300.
🎯 Trading Strategy
🔺 BUY XAU/USD
Entry: $4175 – $4172
🎯 TP: 40 / 80 / 200 pips
🛑 SL: $4169
🔻 SELL XAU/USD
Entry: $4243 – $4246
🎯 TP: 40 / 80 / 200 pips
🛑 SL: $4249

Gold Pulls Back to 4200 – Awaiting Direction Confirmation📊 Market Overview
Gold (XAU/USD) has just dropped from the resistance zone $4218–$4219 down to $4203.
The market is currently reacting near the support zone $4200–$4205, with buying pressure starting to appear, but short-term bullish momentum is weakening.
The H1 trend remains slightly bullish, with EMA20 & EMA50 pointing upward, providing support around $4205–$4210.
📉 Technical Analysis
• Main Trend: Slightly bullish (bullish bias).
• EMA20 & EMA50 H1: Upward sloping, support at $4205–$4210.
• Resistance: $4218 – $4222, further $4230 – $4235
• Support: $4205 – $4200, further $4195 – $4190
• RSI H1: Dropping from overbought → warning of a short-term pullback.
📌 Outlook
• The $4205–$4207 zone is a key support; if price holds, a rebound toward $4212–$4215 is likely.
• If price breaks below $4205, a deeper drop toward $4195–$4190 may occur.
• H1/H4 candle signals will determine the next breakout direction; priority is to BUY on support bounces and SELL on clear rejection at resistance.
________________________________________
💡 Trading Strategy
🔺 BUY XAU/USD: $4190 – $4193
• TP: 40 / 80 / 200 pips
• SL: $4186
🔻 SELL XAU/USD: $4233 – $4236
• TP: 40 / 80 / 200 pips
• SL: $4239

Gold near 4,150 resistance — sell reaction, buy the dip at 4,095📊 Market Overview:
Gold (XAU/USD) is trading near $4,130/oz, pausing its recent rally at $4,135–$4,150 resistance.
Traders are waiting for the U.S. CPI data and Fed speeches, while the weaker USD supports short-term bullish sentiment.
🧭 Technical Analysis:
• Resistance: $4,135 – $4,150 / $4,180 – $4,200
• Support: $4,095 – $4,080 / $4,050 – $4,020
• EMA50 (H1): Rising around $4,110, maintaining bullish bias.
• H1 candles show long lower wicks near $4,100 — buyers still defending.
• RSI (H1) near 60, suggesting room for a pullback before continuation.
💬 Outlook:
Gold is consolidating between $4,095–$4,150, signaling indecision.
Best approach: Sell the resistance reaction and Buy the dip at support, waiting for confirmation candles.
A confirmed close above $4,150 opens the path to $4,180–$4,200, while rejection may trigger a short-term pullback.
________________________________________
🎯 Trading Strategy:
🔻 SELL XAU/USD
Entry: $4,145 – $4,148
🎯 TP: 40 / 80 / 200 pips
🛑 SL: $4,151
🔺 BUY XAU/USD
Entry: $4,095 – $4,098
🎯 TP: 40 / 80 / 200 pips
🛑 SL: $4,092

Gold holds above 4050 — market consolidating before next moveMarket Overview
Gold (XAU/USD) is trading around $4056/oz, holding firm above the $4050 psychological level after strong Asian session gains. Safe-haven demand and dovish Fed expectations continue to support sentiment, though momentum is slowing near resistance.
📊Technical Analysis
• Resistance: $4062 – $4075
• Support: $4042 – $4030
• EMA50 (H1): price stays above EMA, confirming short-term bullish bias
• Pattern: consolidation above $4050; breakout above $4062 may target $4080
• Momentum: RSI near 65, still bullish but weakening slightly
💡Outlook
Bias remains bullish, but minor pullback likely before confirmation. A drop below $4042 would limit upside momentum.
🎯Trade Idea
🔺 BUY XAU/USD
Entry: $4042 – $4045
🎯 TP: 40 / 80 / 200 pips
🛑 SL: $4036

Gold consolidates near 4000 as market awaits breakout1️⃣ Market Overview:
Gold (XAU/USD) climbed to $4008 earlier but was quickly sold off back to $3990, showing a strong tug-of-war between buyers and sellers.
Currently trading around $3998–$4002, the market remains in a tight consolidation phase ahead of potential volatility in the U.S. session.
The USD remains steady, while U.S. bond yields stay elevated — both limiting gold’s short-term upside momentum.
2️⃣ Technical Analysis:
• Resistance: $4008 – $4015 – $4025
• Support: $3990 – $3985 – $3972
• EMA50 (H1): around $3996 → acting as short-term dynamic support.
• RSI (H1): neutral near 50 → market still awaiting a decisive signal.
• Multiple spinning top candles on H1 indicate accumulation and indecision.
3️⃣ Outlook:
Gold continues to move sideways between $3990–$4010, showing price compression before a breakout.
If H1 closes above $4015, the bullish momentum could extend toward $4025–$4040.
However, a drop below $3988 could trigger another correction toward $3975.
4️⃣ Trading Strategy:
🔻 SELL XAU/USD
Entry: $4008 – $4012
🎯 TP: 40 / 80 / 200 pips
🛑 SL: $4016
🔺 BUY XAU/USD
Entry: $3975 – $3977
🎯 TP: 40 / 80 / 200 pips
🛑 SL: $3971

Gold sideway around $4000 — waiting for a decisive breakout1️⃣ Market Overview:
Gold (XAU/USD) is currently fluctuating between $3994–$3998, maintaining a narrow range of $3990–$4000 for several hours.
The market is lacking fresh momentum as investors await upcoming U.S. economic data.
Both the USD and Treasury yields are moving sideways, keeping gold in consolidation mode without a clear breakout.
2️⃣ Technical Analysis:
• Resistance: $4005 – $4012
• Support: $3985 – $3975
• EMA50 (H1): holding near $3989 → short-term dynamic support.
• Consecutive small-bodied H1 candles with balanced wicks indicate a strong tug-of-war between buyers and sellers.
• RSI (H1) remains neutral around 50 → market is waiting for a breakout signal.
3️⃣ Market Outlook:
• This is a consolidation phase before a potential breakout, likely to occur within the next few hours.
• If H1 closes above $4005, gold could extend its rally toward $4025–$4040.
• Conversely, if price breaks below $3985, a short-term correction could be triggered toward $3970–$3955.
4️⃣ Trading Strategy:
🔺 BUY XAU/USD
Entry: $3985 – $3982
🎯 TP: 40 / 80 / 200 pips
🛑 SL: $3979
🔻 SELL XAU/USD
Entry: $4012 – $4015
🎯 TP: 40 / 80 / 200 pips
🛑 SL: $4019

Gold rejected at 3990 – caution as range expands📊 Market Overview
Gold (XAU/USD) touched the $3990 resistance zone before retreating back to $3985–$3986, indicating renewed selling pressure near the supply area. The market remains range-bound, but the range is gradually widening, signaling potential volatility ahead.
🧭 Technical Analysis
• Near Resistance: $3990 – $3995
• Major Resistance: $4005 – $4012
• Near Support: $3978 – $3970
• Major Support: $3958 – $3950
• EMA50 (H1): price is hovering around this level, showing a neutral short-term bias.
• Recent candlesticks show upper wicks → sellers are dominating short-term momentum, though dip-buying interest may appear around $3960–$3955.
💡 Outlook
Gold remains in an expanding consolidation phase. The $3995 – $4005 area is a critical test zone — failure to break above could trigger a correction toward $3960.
Conversely, a confirmed H1 close above $4005 would suggest a bullish breakout and potential continuation higher.
🎯 Trading Strategy
🔻 SELL XAU/USD
Entry: $4006 – $4009
🎯 TP: 40 / 80 / 200 pips
🛑 SL: $4013
🔺 BUY XAU/USD
Entry: $3955 – $3952
🎯 TP: 40 / 80 / 200 pips
🛑 SL: $3948

Gold rebounds from 3974, short-term trend turns bullish1. Market Overview:
During the European session, gold dropped sharply from 3985 to 3956 but quickly rebounded after touching the key support area around 3974. The price is now fluctuating near 3980, indicating that dip buyers have re-entered the market after the short-term correction.
2. Technical Analysis:
• Short-term trend: Neutral to slightly bullish
• Resistance levels: 3988 – 3995 / 4010 – 4025
• Support levels: 3974 – 3960 / 3945 – 3930
• The price is currently trading above the EMA20 and EMA50 on the H1 timeframe, and the bullish candle bounce confirms 3974 as a short-term support.
• If the price sustains above 3975, the upward move could extend toward 3995 – 4010.
3. Outlook:
Gold is currently sideways in accumulation mode between 3950–3990. Buyers are regaining control, but a clear breakout above 3988 is needed to confirm further upside momentum.
4. Suggested Trading Strategy:
🔺 BUY XAU/USD
Entry: 3975–3978
🎯 TP: 3990 / 4005 / 4020
🛑 SL: 3960
🟢 Strategy: Buy continuation as long as price holds above 3975
________________________________________
🔻 SELL XAU/USD (only if price fails to break 3988–3995)
Entry: 3988–3995
🎯 TP: 3970 / 3956 / 3935
🛑 SL: 4005

GOLD HOLDS GAINS NEAR 3975, EYES 3995–4010 RESISTANCE📊 Market Overview:
Gold continues its rebound from $3930, trading near $3975 amid softer USD and lower Treasury yields.
Traders await JOLTS data and Fed Chair Powell’s remarks for potential volatility later in the U.S. session.
📉 Technical Analysis:
• Short-term trend: corrective rebound within a medium-term downtrend.
• EMA20 (H1): 3962 | EMA50: 3955 — price holding above, confirming short-term bullish bias.
• RSI (H1): 56, showing recovering momentum.
📌 Key Levels:
• Resistance: 3985–3995 | 4010–4024
• Support: 3960–3950 | 3930–3922
A candle close above $3995 would confirm breakout potential toward $4010–4024,
while a drop below $3950 reopens the path to $3930.
💡 Trading Plan :
🔺 BUY XAU/USD: 3960–3957
🎯 TP: 40/80/200 pips
🛑 SL: 3953
🔻 SELL XAU/USD: 3998–4001
🎯 TP: 40/80/200 pips
🛑 SL: 4004

Gold may reverse up if support ~3,950–3,970 USD/oz holds📊 Market Overview:
Gold is trading around ~3,980 USD/oz in the Asian session after declining from ~4,020 and dipping near ~3,975. On the H4 timeframe the selling pressure remains as no strong bottom has yet been confirmed around the support zone. Meanwhile, economic data and USD/crude oil swings continue to exert pressure.
📉 Technical Analysis:
• Key support: ~3,950–3,970 USD/oz (previous bounce zone).
• Immediate resistance: ~4,020–4,040 USD/oz.
• The EMA 50 is around ~3,990-4,000, acting as interim resistance.
• If price closes H4 below ~3,950 → likely target ~3,900. If it holds above ~3,970 and rallies, target ~4,040.
• Recent H4 candles show a potential hammer/pin-bar at the support zone, but we need confirmation via a strong H4 close.
📌 Outlook:
The medium-term bias remains neutral to slightly bearish until support ~3,950-3,970 holds and price closes above ~4,000 on H4. If the support breaks, deeper declines are probable. If support holds and we see volume/momentum pick up in EU/US session, a recovery may kick in.
💡 Suggested Strategy:
🔺 BUY XAU/USD
Entry: 3,972 – 3,969
🎯 TP: 40 / 80 / 200 PIPS
❌ SL: 3,966
🔻 SELL XAU/USD
Entry: 4019 – 4022
🎯 TP: 40 / 80 / 200 PIPS
❌ SL: 4025

Gold holds above $4000 — waiting for breakout confirmation🟠 Market Overview
Gold (XAU/USD) is trading around $4012, moving in a narrow range between $4000 – $4020.
Buying pressure remains firm near the psychological support at $4000, while sellers are defending the $4025–$4030 resistance zone.
The market is in a neutral consolidation phase, waiting for direction before the U.S. session tonight.
📊 Technical Analysis
• Near-term support: $4000 – $4003
• Near-term resistance: $4025 – $4028
• EMA50 (H1): currently around $4008 — acting as dynamic support.
• RSI (H1): near 48 — neutral, suitable for two-way scalping setups.
🔎 Outlook
Gold is “compressing” around $4010.
Main scenario: if the price holds above $4000 and confirms a bullish H1 candle, the upward trend could resume toward $4035–$4050.
Conversely, if the price closes below $3998, a pullback to $3985 becomes likely.
→ Prefer BUY setups on support reactions, and SELL setups only on strong rejection near resistance.
🎯 TRADE STRATEGY
🔺 BUY XAU/USD : $3987 – $3984
🎯 TP: 40 / 80 / 200 pips
🛑 SL: $3980
________________________________________
🔻 SELL XAU/USD : $4026 – $4029
🎯 TP: 40 / 80 / 200 pips
🛑 SL: $4033

Gold Bullish Butterfly Forming – Reversal Ahead?As I expected in the previous idea , Gold started declining from the Resistance zone($4,192 – $4,137) and has now reached the Support zone($4,004 – $3,895) — full target achieved .
At the moment, Gold is moving within that Support zone($4,004 – $3,895) and Potential Reversal Zone(PRZ) .
Looking at the 1-hour time frame , we can spot a Bullish Butterfly Harmonic Pattern forming, which is likely to complete right in that PRZ .
I expect that in the coming hours, once Gold enters the PRZ , it could rise at least up to around $4,057(First Target) .
Second Target: $4,132
Stop Loss(SL): $3,889(Worst)
Please respect each other's ideas and express them politely if you agree or disagree.
Gold Analyze (XAUUSD), 1-hour time frame.
Be sure to follow the updated ideas.
Do not forget to put a Stop loss for your positions (For every position you want to open).
Please follow your strategy; this is just my idea, and I will gladly see your ideas in this post.
Please do not forget the ✅ ' like ' ✅ button 🙏😊 & Share it with your friends; thanks, and Trade safe.

Gold holds gains but faces strong resistance at $3975📊 Market Overview:
Gold prices remain steady around $3960–$3965, sustaining upside momentum after breaking above the key $3950 resistance. The market is supported by expectations that the Fed may cut rates sooner, while a weaker USD continues to bolster gold. However, profit-taking pressure around $3970–$3975 is slowing the rally ahead of the U.S. session.
📉 Technical Analysis:
• Key Resistance: $3975 – $3985 – $4000
• Nearest Support: $3955 – $3948 – $3935
• EMA: Price is above EMA 09 & EMA 20 (H1) → short-term trend remains bullish.
• Candlestick & Momentum: H1 candles are holding above the $3950 breakout zone, confirming ongoing buying strength, though RSI nearing overbought may trigger a minor correction.
📌 Outlook:
Gold remains in a short-term uptrend above $3955. A clear break above $3975 could open the door to $3985–$4000, while a drop below $3955 may trigger a pullback toward $3948–$3935 before any rebound.
💡 Trading Strategy Suggestion:
🔺 BUY XAU/USD at: $3935 – $3932
🎯 TP: 40 / 80 / 200 pips
❌ SL: $3929
🔻 SELL XAU/USD at: $3975 – $3978
🎯 TP: 40 / 80 / 200 pips
❌ SL: $3981
