Gold Roadmap| Short-termGold ( OANDA:XAUUSD ) has been surprising everyone in the last few weeks, making new All-Time Highs(ATHs) every day.
Let me start by saying that this is a short-term analysis on a 15-minute time frame .
Technical analysis generally works worse when assets are creating ATHs . One reason for this is that there is no past history .
Gold has started to correct after the formation of the last All-Time High(ATH=$3,791.55) .
In terms of Elliott Wave theory , given the bullish momentum of Gold , it seems that the main wave 3 has been completed, and we should wait for the main wave 4 . It seems that the main wave 4 can be completed with a Zigzag Correction(5-3-5) .
I expect Gold to continue its downward trend to the Support zone($3,738-$3,723) , and then if we find a trigger for a Long position , we can ride the bullish wave of Gold again .
Note: If the Resistance lines are broken, we can expect a new All-Time High.
Note: If the Support zone($3,738-$3,723) is broken, we can expect a deeper correction.
Please respect each other's ideas and express them politely if you agree or disagree.
Gold Analyze (XAUUSD), 15-minute time frame.
Be sure to follow the updated ideas.
Do not forget to put a Stop loss for your positions (For every position you want to open).
Please follow your strategy; this is just my idea, and I will gladly see your ideas in this post.
Please do not forget the ✅ ' like ' ✅ button 🙏😊 & Share it with your friends; thanks, and Trade safe.
Goldsetup

Gold hits 3,717 low – Short-term technical reboundMarket Overview:
Last night, gold dropped to a low of 3.717 USD/oz under strong selling pressure from the US market. Currently, it rebounds slightly to 3.736 USD/oz, indicating emerging bottom-buying interest.
Technical Analysis:
• Support: 3,717 / 3.723 USD
• Resistance: 3.740 / 3.750 USD
• EMA: EMA50 trending down; EMA200 above price, medium-term downtrend persists
• Candlestick pattern: Hammer candle observed at 3,717 low, signaling possible technical rebound
Outlook:
Gold may rebound short-term toward 3.740–3.750 USD if buying pressure holds, but monitor price reaction at 3,717–3.723 USD to confirm reversal or continuation.
Trading Strategy:
🔺 BUY XAU/USD : 3.718 – 3.715
🎯 TP: 40/80/200 pips
🛑 SL: 3.712
🔻 SELL XAU/USD : 3.750 – 3.753
🎯 TP: 40/80/200 pips
🛑 SL: 3.756

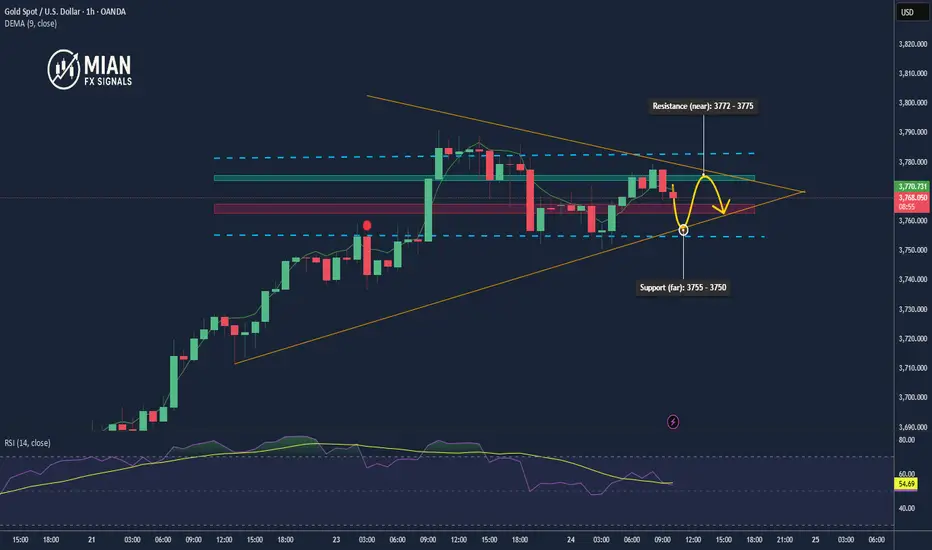
Gold breaks below 3770 – short-term correction signal📌 Market Developments:
Gold failed to hold the 3771–3774 area and dropped below 3770, now trading around 3768. This shows selling pressure has returned as buyers were not strong enough to break the 3778–3780 resistance zone.
📉 Technical Analysis:
🔺 Resistance (near): 3772 – 3775
🔺 Resistance (far): 3778 – 3781
🔻 Support (near): 3765 – 3762
🔻 Support (far): 3755 – 3750
📊 Short-term EMA is flattening as price moves back below 3770.
🕯️ H1 candles show strong selling pressure with long upper wicks and rising volume.
🧐 Outlook:
The main trend remains bullish, but gold is in a short-term correction after failing at 3778–3781. If 3765 breaks, price may continue to decline toward 3755 – 3750 before buyers step in again.
🎯 Trading Strategy:
🔺 BUY XAU/USD : 3755 – 3750
🎯 TP: 40 / 80 / 200 pips
🛑 SL: 3747
🔻 SELL XAU/USD: 3772 – 3775
🎯 TP: 40 / 80 / 200 pips
🛑 SL: 3778
Gold holds above $3765, bullish momentum continues📌 Market Overview
Gold is consolidating around $3765–$3768 after reaching another all-time high. Market sentiment remains bullish as expectations of Fed rate cuts persist, the USD weakens, and Treasury yields edge lower.
📊 Technical Analysis
• Near resistance: $3775 – $3785
• Additional (strong) resistance: $3800 – $3815
• Near support: $3755 – $3740
• Additional (strong) support: $3725 – $3710
• EMA 50 (H1): price remains above EMA, supporting the bullish bias.
• Candlestick pattern: rejection candles near $3755 show active buying demand.
• Momentum (RSI H1): stays above 60, no extreme overbought signals yet.
📝 Outlook
The main trend is still bullish, but the $3775–$3785 zone could trigger short-term profit-taking. As long as price holds above $3755, gold is likely to aim for $3800–$3815.
🎯 Trading Strategy
🔺 BUY XAU/USD : $3748 – $3751
🎯 TP: 40 / 80 / 200 pips
🛑 SL: $3743
🔻 SELL XAU/USD : $3781 – $3784
🎯 TP: 40 / 80 / 200 pips
🛑 SL: $3788

New High at 3791, Then Pullback📌 Market Movements:
Recently, gold prices set a new all-time high at $3791/oz before retreating slightly and are now trading around $3778/oz. The initial surge was driven by strong dip-buying and risk-aversion sentiment, but profit-taking pressure pulled prices back from record highs.
📉 Technical Analysis:
🔺 Resistance: 3791 (new ATH) and 3805
🔻 Support: 3770, followed by 3755
📈 EMA 50 on H1 remains below price, confirming short-term bullish bias
🕯️ H1 candles show long upper wicks near 3790–3791, signaling strong selling pressure at resistance
📊 Declining volume during the pullback suggests the market is waiting for the next breakout confirmation
🧐 Outlook:
The main trend remains bullish, but after touching 3791, gold needs consolidation to absorb selling pressure. Holding above 3770 keeps the door open for another test of 3791, aiming toward 3800–3805. A break below 3770 could push gold toward 3755 before any rebound.
🎯 Trading Strategy (Suggested):
🔺 BUY XAU/USD
• 📌 Entry: 3770–3773
• 🎯 TP: 3785 / 3795 / 3805
• 🛑 SL: 3765

Gold Pulls Back After Hitting $3726.5 High📌 Market Overview
Gold tested a new high at $3726.5 before retreating to around $3720. The market shows short-term profit-taking pressure, but the broader bullish trend remains intact.
📊 Technical Analysis
• Near resistance: $3725 – $3732 (recently tested zone).
• Major resistance: $3745 – $3750.
• Near support: $3712 – $3710.
• Major support: $3697 – $3690.
• EMA50 (H1): price pulling back toward EMA, suggesting a technical correction.
• RSI (H1): easing from overbought, now around 62.
🧐 Outlook
The primary trend remains bullish, but current movement suggests gold needs consolidation before extending higher. The $3745 – $3750 zone will be a critical resistance if momentum continues.
🎯 Trading Strategy
🔺 BUY XAU/USD : $3712 – $3715
🎯 TP: 40 / 80 / 200 pips
🛑 SL: $3705
🔻 SELL XAU/USD : $3745 – $3750
🎯 TP: 40 / 80 / 200 pips
🛑 SL: $3755

Gold holds firm at $3680 – testing pressure toward $3725 resista📌 Market Overview
Spot gold is trading around $3691/oz, recovering from Asian session lows. Strong USD and high yields keep pressure on, but safe-haven flows are limiting the downside.
📊 Technical Analysis
• Near resistance: $3697 – $3707 (short-term ATH).
• Major resistance: $3725 – $3732.
• Near support: $3680 – $3670.
• Major support: $3658 – $3650.
• EMA50 (H1): price holding above EMA, keeping bullish bias intact.
• Candles: lower wicks near $3680 suggest strong dip-buying interest.
🧐 Outlook
Gold remains in a mildly bullish structure, but $3707 is key resistance. A rejection could push price back, while a breakout may target $3725.
🎯 Trading Strategy
🔺 BUY XAU/USD : $3682 – $3685
🎯 TP: 40 / 80 / 200 pips
🛑 SL: $3675
🔻 SELL XAU/USD : $3725 – $3730
🎯 TP: 40 / 80 / 200 pips
🛑 SL: $3735

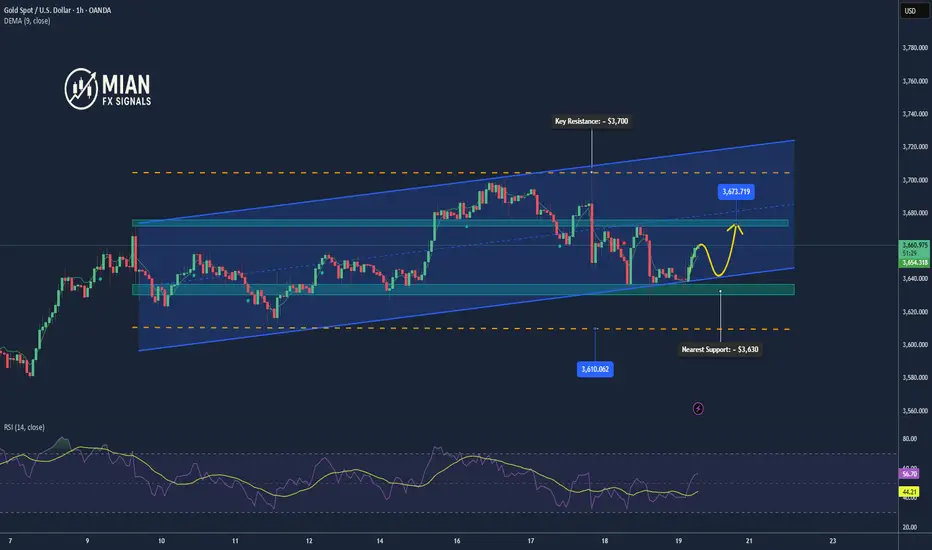
Gold Breaks Out of Range, Targeting Higher Resistance📊 Market Developments:
After consolidating in the 3643–3658 range, gold has broken out, moving up to 3665 in the US session. The rally is supported by safe-haven flows as expectations grow for further Fed easing, while the USD shows signs of stabilizing.
📉 Technical Analysis:
• Key Resistance: 3672–3675 (a breakout could extend toward 3685–3692).
• Nearest Support: 3658 (the breakout level) — if successfully retested, it may turn into new support.
• EMA 09: Price is now above EMA09 → confirming short-term bullish momentum.
• Candles / Volume / Momentum: A strong H1 breakout candle with higher volume confirms buyer dominance.
📌 Outlook:
• Gold has exited the sideways range and is trending higher in the short term.
• Holding above 3658 keeps the upside bias intact toward 3672–3685.
• Downside risk only emerges if price falls back below 3658.
💡 Suggested Trading Strategy:
• BUY XAU/USD at: 3658–3662 (on a retest after breakout)
🎯 TP: 40 / 80 / 200 pips
❌ SL: 3654
• SELL short-term only if a strong reversal signal appears around 3675–3685.

Gold struggles within 3630–3675 range, awaiting breakout📊 Market developments
• Yesterday, gold rebounded from 3633 to test the resistance zone at 3675 but failed, then dropped sharply to a low of 3627.
• This morning, gold recovered from that low and is now trading around 3658–3660, showing that short-term buying pressure has re-emerged.
• A stronger USD and slightly higher U.S. bond yields after the Fed meeting continue to weigh on gold, while expectations of further Fed rate cuts in the coming months prevent deeper declines.
🧭 Technical analysis
• Near resistance: 3670–3675 (key short-term barrier, repeatedly rejected).
• Major resistance: 3700 (psychological level; only a breakout would confirm a new bullish leg).
• Near support: 3630 (yesterday’s low).
• Major support: 3600–3610.
• RSI on H1/H4 has rebounded from oversold levels, signaling potential for further recovery, though momentum remains weak.
📌 Outlook
• In the short term, gold is expected to consolidate within the 3630–3675 range.
• A breakout above 3675 could open the way toward 3700.
• Failure to break 3675 would likely send prices back to retest 3630, or even lower toward 3600.
🎯 Trading strategy
• Short-term SELL: around 3670–3675, SL above 3678, TP at 3640–3630.
• Speculative BUY: around 3630–3635, SL below 3627, TP at 3665–3675.
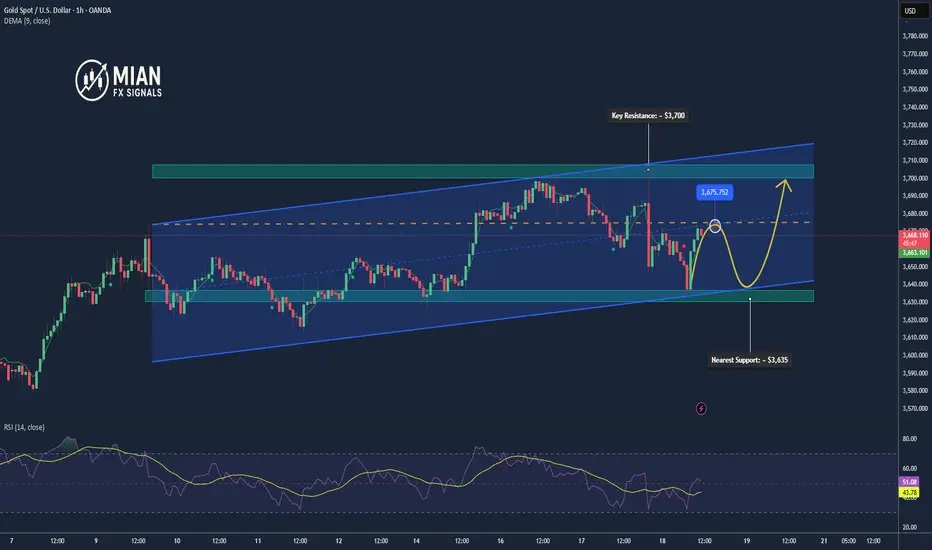
Gold Volatile After Fed, Rebounds to 3670📊 Market Developments:
• After the Fed’s 25 bps rate cut, gold surged sharply and hit a new all-time high at 3707.
• Strong profit-taking and a temporary USD rebound then dragged gold down to 3633 in the Asian session this morning.
• Currently, gold has rebounded to around 3670, showing buying demand returning after the sharp pullback.
📉 Technical Analysis:
• Key Resistance: $3700 – $3707 (new peak).
• Nearest Support: $3630 – $3635 (successfully tested this morning).
• EMA09 (H1): Price just bounced back above the short-term EMA, indicating a short-term recovery trend.
• Candlestick / Momentum: H1 candles printed a long lower wick around 3633 → signal of bottom-fishing demand. Momentum is recovering but resistance at 3700 remains tough, suggesting further choppiness ahead.
📌 Outlook:
Gold is in a highly volatile state following the Fed decision. Holding above 3660–3670 could trigger another test of the 3700–3707 resistance area. Conversely, a break below 3660 may drag gold back to retest 3630.
💡 Suggested Trading Strategy:
• SELL XAU/USD : $3702 – $3705
🎯 TP: 40 / 80 / 200 pips
❌ SL: $3708
• BUY XAU/USD: $3635 – $3638
🎯 TP: 40 / 80 / 200 pips
❌ SL: $3632
Gold consolidates around $3,660 after Fed’s rate cut decision🧭 Market Overview
Gold is currently trading around $3,660/oz after the Fed announced a 0.25% rate cut. Earlier, prices hit a new all-time high at $3,707/oz but quickly pulled back as the USD rebounded and profit-taking pressure increased.
📈 Technical Analysis
• Near Resistance: $3,675 – $3,700
• Key Support: $3,645 – $3,630
• EMA50 (H1): price is moving sideways around this level, indicating consolidation.
• Recent H1 candles show long upper wicks, reflecting selling pressure near $3,675.
• Trading volume has declined after the spike, suggesting the market is waiting for a new catalyst.
🧐 Outlook
• In the short term, gold is likely to consolidate – retrace within the $3,645–$3,675 range.
• The broader trend remains bullish, but a clear breakout above $3,675 on H1/H4 closes is needed to confirm further upside.
• A break below $3,630 would increase the risk of a deeper move toward $3,600.
🎯 Suggested Trading Strategy
🔺 BUY XAU/USD: $3,647 – $3,650
🎯 TP: 40 / 80 / 200 pips
🛑 SL: $3,643
🔻 SELL XAU/USD
Entry: $3,675 – $3,678
🎯 TP: 40 / 80 / 200 pips
🛑 SL: $3,681

Gold Faces Resistance – Possible Short-Term Correction📊 Market Drivers:
• Expectations that the Fed will cut interest rates have supported gold by lowering the opportunity cost of holding the metal.
• The US dollar tends to weaken amid signs of slowing economic growth, which supports safe-haven demand for gold.
• Geopolitical uncertainties and continued central bank demand also add upward pressure on gold.
📉 Technical Analysis:
• Key Resistance: ~ $3,700 – $3,720 / ounce; a strong psychological round number level drawing market focus.
• Nearest Support: ~ $3,660 – $3,645 / ounce; if this breaks, gold could test deeper support near ~$3,580.
• EMA: Gold is trading above the EMA50 in many analyses → medium-term trend remains bullish.
• Candlestick / Volume / Momentum: Signs of stalling near resistance; momentum could weaken if the USD firms up or if the Fed signals caution. Overbought RSI and momentum indicators could trigger a short-term pullback.
📌 View:
Gold may see a short-term pullback if it fails to break above the ~$3,700–3,720 resistance zone. If bearish catalysts emerge – such as a stronger USD or a hawkish Fed stance – gold could retreat towards ~$3,645–3,660 support.
On the other hand, a clear breakout above ~$3,700 could open the way towards ~$3,720 and higher.
💡 Short-Term Trading Strategy (Scalping before news):
• SELL XAU/USD at: 3688 – 3692 (near short-term resistance)
🎯 TP: 40 / 80 / 200 pips
❌ SL: 3695
• BUY XAU/USD at: 3672 – 3668 (near intraday support)
🎯 TP: 40 / 80 / 200 pips
❌ SL: 3665

Gold Holds Strong, Buy on Nearby Support📊 Market Developments:
• Gold remains firm above $3,680/oz, after hitting a fresh high near $3,689, supported by a weaker USD and strong Fed rate-cut expectations.
• Traders are cautious ahead of Fed Chair Powell’s speech tomorrow, causing choppy moves at elevated levels.
📉 Technical Analysis:
• Key Resistance: $3,720 – $3,730/oz → breakout could extend rally higher.
• Nearest Support: $3,668 – $3,672 (EMA-09 H1) and $3,660 – $3,662 (recent pullback low).
• EMA: Price trades well above EMA-09 and EMA-50 → bullish bias intact.
• Candlestick / Volume / Momentum: Strong buying pressure in recent H1 candles, but RSI shows overbought signals → a short-term dip likely before resuming higher.
📌 Outlook:
Gold remains bullish overall. Short-term corrections to $3,668 – $3,672 or deeper to $3,660 – $3,662 are likely buying opportunities if these supports hold.
💡 Suggested Trading Strategy:
🔺 BUY XAU/USD
• Entry: $3,668 – $3,672
🎯 TP: 40 / 80 / 200 pips
❌ SL: $3665
🔻 SELL XAU/USD
• Entry: $3,725 – $3,727 – small lot (if tested strongly)
🎯 TP: 40 / 80 pips
❌ SL: $3730

Gold Sideways Ahead of FOMC, Holding Support at $3,638📊 Gold Analysis (XAU/USD)
• Current: Price is trading around $3,642, holding support at $3,638, with resistance near $3,646–$3,650. Market remains sideways, waiting for Fed news.
• Technical:
o Holding above $3,638 → potential rebound to $3,650 – $3,655, possibly $3,668.
o Break below $3,638 → could drop to $3,632 – $3,628.
• Trend: Consolidation in a narrow range, awaiting FOMC breakout.
• Strategy:
o BUY around $3,638–$3,632 with tight SL.
o SELL near $3,646–$3,655 if no breakout occurs.

Gold Holds Above $3,640, Market Awaits Fresh Catalysts📊 Market Movement:
Gold is trading around $3,644/oz, consolidating in a narrow range after recent volatility. Investors remain cautious ahead of key Fed signals and U.S. economic data this week. A pause in the USD and U.S. bond yields is helping gold maintain crucial support.
📈 Technical Analysis:
• Near support: $3,638 – $3,632 (H1 EMA20 + Asian session low).
• Strong support: $3,620 (multiple tested lows).
• Near resistance: $3,650 – $3,655 (Asian session high).
• Strong resistance: $3,668 – $3,672 (H4 EMA50 + strong supply zone).
• RSI on H1 remains above 50, showing mild bullish momentum.
🤔 Outlook:
Gold is trading sideways within $3,638 – $3,655. A breakout above $3,655 may open the way to $3,670. Conversely, a breakdown below $3,632 could trigger a decline toward $3,620. The short-term trend remains in consolidation, awaiting a breakout signal.
🎯 Trading Strategy:
SELL XAU/USD: $3,655 – $3,658
🎯 TP: 40 / 80 / 200 pips
❌ SL: $3661
BUY XAU/USD: $3,638 – $3,635
🎯 TP: 40 / 80 / 200 pips
❌ SL: $3632

Gold Holds Sideways Above $3,640, Awaiting Fresh Momentum📊 Market Developments:
Gold prices are currently fluctuating around $3,648 – $3,650/oz during the Asian session.
Markets remain cautious ahead of the upcoming Fed meeting, with strong expectations for a rate cut.
A weaker USD and slightly lower bond yields support gold, but profit-taking pressure still prevents a clear breakout.
📉 Technical Analysis:
• Key Resistance: $3,657 – $3,670
• Nearest Support: $3,638 – $3,626
• EMA: Price remains above EMA50, maintaining a short-term bullish structure.
• Momentum: RSI around neutral zone (50–55), reflecting sideways consolidation awaiting signals.
📌 Outlook:
Gold is likely to continue trading sideways within the $3,638 – $3,657 range until fresh U.S. economic data or Fed statements emerge.
• A breakout above $3,670 could open the way to $3,700.
• A breakdown below $3,626 may trigger selling pressure toward $3,600.
💡 Trading Strategy:
• 🔻 SELL XAU/USD: $3,657 – $3,660
🎯 TP: 40 / 80 / 200 pips
❌ SL: $3663
• 🔺 BUY XAU/USD: $3,626 – $3,623
🎯 TP: 40 / 80 / 200 pips
❌ SL: $3620

Next week's Fed decision,Has the gold bull market peaked?Let's take a look at the trend of gold this week at the weekend. The strong bull market of gold has slowed down this week. After continuing to rise to 3600 on Monday, it rose and fell to a peak of 3675 on Tuesday. From Wednesday to Friday, it fluctuated at a high level. So, does gold still have the motivation to continue to rise in the current situation? Or is 3675 the ceiling? This recent surge in gold prices began at 3311, reaching a high of $364 at 3675. Based on previous upward trends, a bull market typically peaks just over $400. Therefore, with limited room above 3700, blind buying is discouraged. Be wary of a potential reversal of price action after reaching the peak, with the upper limit at 3750. All of this depends on the Federal Reserve's interest rate decision next week. The market will become increasingly cautious as we approach this date. Therefore, gold is currently adjusting at a high level, just shy of a final acceleration towards the top. The uncertainty remains as to whether this acceleration will occur before or after the Fed's decision. If the rate cut is just 25 basis points, gold will have no further momentum to rally. Buying on expectations and selling on facts will lead to a peak and decline upon the announcement. However, if the rate cut is aggressively implemented by 50 basis points, gold will likely experience further upward momentum, most likely leading to a decline after a sharp rise. Therefore, gold is currently in a tailspin. At the end of the bull run, it's best to be bullish rather than chasing the market. It's prudent to wait for a pullback at key support levels before resuming a bullish trend. Two key support levels to watch are 3580 and 3511-3512. Having already seen four consecutive weekly gains, there's a high probability of a negative correction next week. Even if gold does rally next week, it will be the final stretch. The world's largest gold ETF has been steadily reducing its holdings in recent days, with bulls gradually taking profits. We shouldn't be tempted to buy at high levels, especially for medium- and long-term investors. It's important to emphasize that the overall trend and direction of gold remains upward, directly linked to the weakening US dollar. However, market trends aren't linear. After each bullish cycle, there's a deep correction, and this cycle repeats. This is how trends form. See if this pattern persists. Trading, then, is a process of finding the right position, following the trend and the swings. A cost-effective position gives you the confidence to hold onto your position without panic. For gold on Monday, expect continued volatility. Upper pressure lies between 3655 and 3660. A breakout would undoubtedly trigger a test of the 3675 high, leading to a potential surge and then a decline. Whether it can reach 3700 depends on the strength of the market, but I don't think the probability is high, at least for Monday. Lower support lies between 3635 and 3630, the 618 golden ratio. A break below would signal a short-term bearish bias, potentially leading to further declines to the 3610-3600 support levels.

Gold Set to Extend Gains as Fed Rate Cuts Loom📊 Market Developments:
Gold is supported by expectations that the Federal Reserve will cut interest rates, lowering the opportunity cost of holding bullion.
Recent U.S. labor market data showed weakness, with higher jobless claims and downward revisions in nonfarm payrolls.
CPI inflation remains elevated, while PPI softened slightly, reinforcing bets on policy easing.
A weaker U.S. dollar and lower Treasury yields further boost gold’s appeal.
📉 Technical Analysis:
• Key Resistance: $3,670 – $3,674, with further upside potential toward $3,700–$3,730.
• Nearest Support: $3,600; if broken, next levels at $3,561–$3,536.
• EMA: Price is trading above EMA50 and EMA200, keeping the bullish structure intact.
• Candlestick / Momentum: RSI remains elevated, showing strong upward momentum though slightly overbought; dips are being bought quickly.
📌 Outlook:
Gold may continue to rise in the short term if Fed maintains a dovish stance and U.S. data remain soft.
However, stronger-than-expected inflation or hawkish Fed signals could trigger a pullback toward $3,600 or lower.
________________________________________
💡 Suggested Trading Strategy:
• SELL XAU/USD: $3,682 – $3,685
🎯 TP: 40 / 80 / 200 pips
❌ SL: $3688
• BUY XAU/USD: $3,617 – $3,620
🎯 TP: 40 / 80 / 200 pips
❌ SL: $3614

Gold Pulls Back Short-Term After Hitting $3,673📊 Market Overview:
• Gold eased after touching $3,673, pressured by profit-taking and a slight rebound in the U.S. Dollar.
• Expectations of Fed rate cuts continue to support gold in the medium term, but near-term correction pressure is dominant.
• Geopolitical tensions and bullish forecasts of $3,800–$4,000 remain longer-term supportive factors.
📉 Technical Analysis:
• Key Resistance: $3,645 – $3,670
• Nearest Support: $3,600, further down $3,585
• EMA 09: Price is currently below EMA 09, signaling short-term bearish pressure.
• Candles / Momentum: After peaking at $3,673, gold formed a corrective sequence; RSI has cooled off from overbought, confirming selling pressure in the short term.
• Fibonacci Extensions: A breakout above $3,670 could open the way toward $3,697 and $3,725.
📌 Outlook:
In the short term, gold is likely to continue correcting toward $3,600 before buyers may step back in. A reclaim of EMA 09 and a breakout above $3,670 could extend the bullish move toward $3,697 – $3,725.
💡 Suggested Trading Strategy:
🔻 SELL XAU/USD : $3,670 – $3,673
🎯 TP: 40 / 80 / 200 pips
🛑 SL: $3676
🔺 BUY XAU/USD : $3,602 – $3,605
🎯 TP: 40 / 80 / 200 pips
🛑 SL: $3,599

Gold (XAUUSD) – 9 Sep | Patience at Highs, Demand Zones in Focus🟡 Gold (XAUUSD) Analysis – 9 September
Market Overview
Gold continues to display relentless strength. Both the H4 and M15 structures remain aligned to the upside, confirming that the broader bullish trend is firmly intact.
In yesterday’s session, price printed a new all-time high at 3646.5 . The bullish momentum didn’t stop there — during today’s Asian session, that high was taken out again, with price pushing to yet another fresh peak at 3654.5 . Repeated breakouts like this highlight not just a strong trend, but also aggressive buyers absorbing liquidity on every pullback.
Current Phase
Despite the strength, gold is extended at the highs. Chasing impulsive rallies is rarely a sustainable strategy. Markets typically need a pullback to “reset” before continuing, and this is where patience becomes critical.
Here are the key zones we’re monitoring:
🔹 First POI Zone (3637.5–3634.5)
The closest M15 demand zone formed after the latest impulse. A retrace here could offer a quick long setup, but due to its proximity to the highs, we will only engage if there is clear M1 confirmation . Without it, the risk of failure is high.
🔹 Second POI Zone (3592.6–3587)
If the first zone fails, this deeper M15 demand zone becomes the focus. It represents a stronger accumulation area, making it more reliable for continuation trades.
🔹 High-Probability Zone (3555–3545)
The same level highlighted in yesterday’s outlook. This is one of the most structurally significant demand areas on the chart. A pullback here would likely sweep sell-side liquidity, setting the stage for a high-probability long opportunity.
Execution Plan
Patience is the strategy. We are not chasing highs.
Wait for price to retest a demand zone.
Drop to the M1 chart for confirmation.
Enter long only with structured risk.
If the immediate zone breaks, step aside and let the market pull deeper before reassessing.
Patience is a position too — wait for the market to reveal its hand before playing yours.
Bias for Today
📈 Bullish bias only.
Long setups will be considered from demand zones, but only once confirmation is present. Until then — no trades, no FOMO.
📘 Shared by @ChartIsMirror

Gold hits new ATH at $3,657–Bullish momentum eyeing $3,675–3,690🟡 Market Overview
Gold extended its rally and just hit a new all-time high at $3,657/oz. The move is fueled by expectations of a Fed rate cut in September, weaker USD, and lower bond yields. Safe-haven demand remains strong as US labor data signals economic slowdown.
📉 Technical Analysis
• Resistance (near): 3670 – 3675
• Resistance (far): 3690 – 3700
• Support (near): 3640 – 3635
• Support (far): 3615 – 3605
• Price is trading above EMA20 and EMA50 on H1, confirming the bullish momentum. Strong volume at the 3650 breakout zone supports further upside.
📌 Outlook
Main trend: Bullish Gold could extend gains toward 3675 – 3690 as long as it holds above 3640. Short-term pullbacks may occur before continuation.
🎯 Suggested Trading Strategy
• BUY XAU/USD
Entry: 3645 – 3648 (after a pullback holding above 3640)
🎯 TP: 3670 / 3690
🛑 SL: 3630
• Short-term SELL (speculative, small size only)
Entry: 3672 – 3675 (near resistance)
🎯 TP: 3645
🛑 SL: 3678

Gold (XAUUSD) – 8 Sep | Bullish Bias, Watching 3555–3545 POI🟡 Gold (XAUUSD) Analysis – 8 September
Market Overview
Gold printed a fresh all-time high at 3600 during last Friday’s NFP event.
Both H4 and M15 remain bullish, confirming that the broader uptrend is still intact.
Current Phase
Price is now in a pullback phase after the new high.
Our focus is on the 3555–3545 demand zone — the origin of last Friday’s impulsive move.
There’s liquidity sitting below this zone, and the market loves to sweep such levels before resuming its trend.
This is where patient traders often find the best entries — after the sweep, not before it.
Key Zone to Watch
🔹 3555–3545 (M15 Demand Zone)
If respected and confirmed on M1 , this zone could offer a high-probability long setup for continuation toward new highs.
Execution Plan
Wait for M1 structure confirmation before entering — don’t pre-empt the move.
If this zone is not respected, don’t rush into trades. Step aside, let price settle, and re-analyze before planning the next move.
Bias for Today
📈 Bullish — focus remains on long setups if the demand zone holds.
Use at least 1:3 RR based on your own risk plan to stay consistent.
📘 Shared by @ChartIsMirror

Gold Holds Above $3,620 – Uptrend Strengthens📊 Market Overview:
Gold continues its rally, trading above the $3,600 psychological level, supported by strong safe-haven demand, growing expectations of a Fed rate cut, and ongoing geopolitical risks. Analysts, including Goldman Sachs, have even suggested potential upside toward $5,000/oz if confidence in Fed independence weakens.
📉 Technical Analysis:
- Resistance: $3,630 – $3,640
- Support: $3,600 (key psychological level)
- Indicators: MA, RSI, MACD, and STOCH all show strong bullish momentum, reinforcing the continuation of the uptrend.
📌 Outlook:
Gold remains in a bullish short-term trend. A clear breakout above $3,640 could open the path to $3,650+, while any pullback is likely to find strong buying interest near $3,600.
💡 Trading Strategy:
🔺 BUY XAU/USD near $3,607 – $3,610
🎯 TP: 40/80/200 pips
❌ SL: $3,604
🔻 SELL XAU/USD if price rejects $3,642 – $3,645
🎯 TP: 40/80/200 pips
❌ SL: $3,647
