Gold: Technicals vs. Fundamentals as Prices DipGold is currently facing significant downward pressure, recently touching its lowest point since early October and dipping below the $4,000 mark. This bearish sentiment is largely fueled by two key factors: cautious remarks from Federal Reserve Chairman Jerome Powell regarding policy easing, and a noticeable de-escalation in the ongoing trade tensions between the United States and China.
As traders, we're now watching for the next catalyst. Upcoming macroeconomic data from the US, coupled with further commentary from Fed officials, will be critical in shaping Gold's near-term valuation.
The December Rate Cut: Not a Done Deal
While the market has been pricing in potential rate cuts, it's important to remember that a cut in December is not yet a certainty. This ambiguity is keeping buyers on the sidelines and adding to the metal's weakness.
A Look at the Charts (Technical View)
From a technical perspective, Gold is at a critical juncture. The key breakout level to watch is the $4050 - $4060 area.
The Bullish Case: If Gold can decisively break above this $4050/$4060 resistance, it would open the door for a test of the next significant level, around $4150 / $4160.
The Bearish Case: However, until Gold can firmly establish itself and stabilize above the $4150/$4160 zone, the risk of a deeper correction remains very high till $3700
We are observing a recurring pattern: Gold is repeatedly failing at immediate trendline resistance levels. In technical trading, this is often a classic sign that the market is weak and may be poised for a further decline, assuming there are no major fundamental surprises.
Trading Strategy: Patience is Key
For those of us looking to enter long-term buy positions, a two-pronged approach is necessary:
Fundamental Watch: Keep a close eye on fundamental developments. Specifically, any new updates regarding US-China tariffs or shifts in the Federal Reserve's tone on interest rates will be major market movers.
Technical Confirmation: Patience is required. We must wait for a confirmed technical breakout above the $4150 / $4160 area. Until this happens, the bearish pressure is likely to continue. Otherwise, gold still have bigger chances to test $3700 before it rise again.
Goldsignal

DeGRAM | GOLD is forming a new local ascending structure📊 Technical Analysis
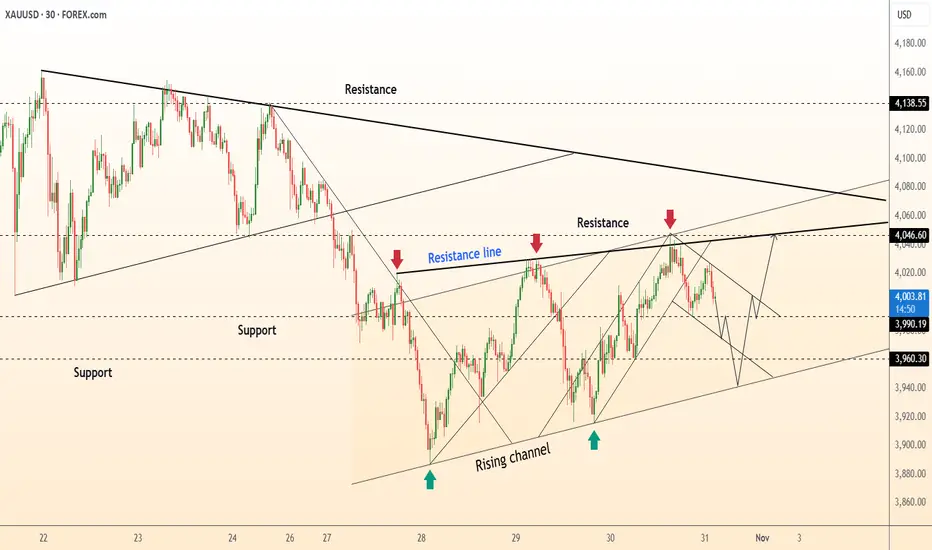
● XAU/USD is forming a rising channel, holding firm above 3,960 support after rejecting from the resistance near 4,046.
● The pattern suggests a continuation of the uptrend as long as price sustains above the channel base, with potential breakout targets toward 4,138.
💡 Fundamental Analysis
● Gold remains supported by a softer dollar and cautious market sentiment ahead of key U.S. employment data, which could further boost safe-haven demand.
✨ Summary
● Long bias above 3,960; targets 4,046–4,138. Rising structure and weaker dollar fundamentals reinforce short-term bullish momentum.
-------------------
Share your opinion in the comments and support the idea with a like. Thanks for your support!
DeGRAM | GOLD formed a rising bottom📊 Technical Analysis
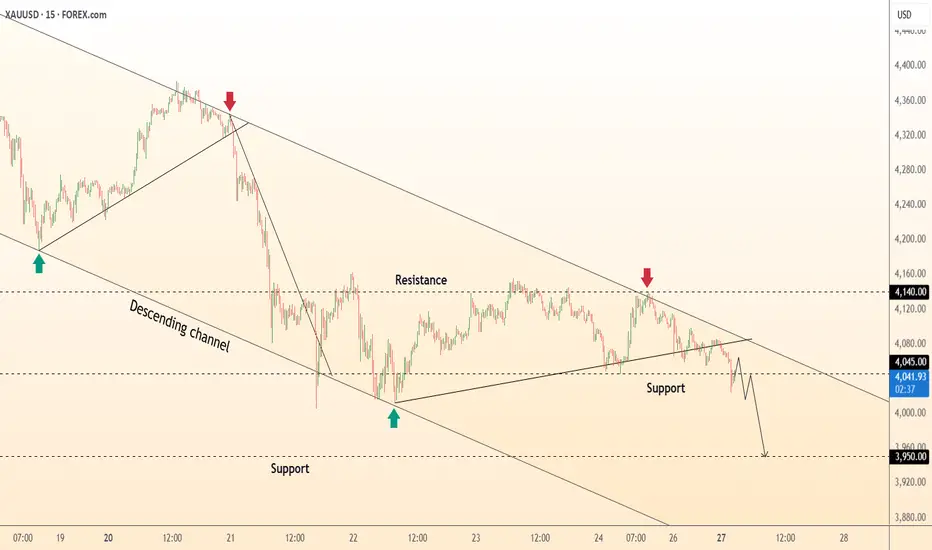
● XAU/USD is trading inside a descending channel, forming a short-term rebound from the support line near 3,945, signaling a potential breakout attempt.
● A move above the 4,025–4,040 resistance zone would confirm a channel break and open the path toward the 4,138 level.
💡 Fundamental Analysis
● Gold finds demand amid geopolitical uncertainty and weaker U.S. Treasury yields, while markets await key inflation data that may limit dollar strength.
✨ Summary
● Long bias above 3,945; target 4,040–4,138. Channel bottom rebound supports a short-term bullish recovery scenario.
-------------------
Share your opinion in the comments and support the idea with a like. Thanks for your support!

Gold climbs above $4030, bullish momentum remains strong📊 Market Overview:
Gold extended its gains to around $4030, supported by a weaker USD and stronger safe-haven demand. After consolidating between $4015–$4020, buyers regained control, pushing the price higher toward short-term resistance.
📉 Technical Analysis:
• Key Resistance: $4035 – $4050
• Nearest Support: $4018 – $4022
• EMA: Price remains above the 9-EMA, confirming a short-term bullish trend.
• Candle / Momentum: Momentum is still positive on the H1 chart, showing solid buying pressure with no clear reversal signs.
📌 Outlook:
Gold may continue to rise if it stays above $4018, targeting $4045 – $4052 in the short term. However, if a rejection candle appears near $4035–$4040, a technical pullback toward $4020 could occur.
💡 Trading Plan:
🔺 BUY XAU/USD
Entry: $4024 – $4028
🎯 TP: 40 / 80 / 200 pips
🛑 SL: $4018

Gold Bullish Butterfly Forming – Reversal Ahead?As I expected in the previous idea , Gold started declining from the Resistance zone($4,192 – $4,137) and has now reached the Support zone($4,004 – $3,895) — full target achieved .
At the moment, Gold is moving within that Support zone($4,004 – $3,895) and Potential Reversal Zone(PRZ) .
Looking at the 1-hour time frame , we can spot a Bullish Butterfly Harmonic Pattern forming, which is likely to complete right in that PRZ .
I expect that in the coming hours, once Gold enters the PRZ , it could rise at least up to around $4,057(First Target) .
Second Target: $4,132
Stop Loss(SL): $3,889(Worst)
Please respect each other's ideas and express them politely if you agree or disagree.
Gold Analyze (XAUUSD), 1-hour time frame.
Be sure to follow the updated ideas.
Do not forget to put a Stop loss for your positions (For every position you want to open).
Please follow your strategy; this is just my idea, and I will gladly see your ideas in this post.
Please do not forget the ✅ ' like ' ✅ button 🙏😊 & Share it with your friends; thanks, and Trade safe.

DeGRAM | GOLD seeks to decline📊 Technical Analysis
● Price trends inside a descending channel, posting lower highs after rejections at ~4045; latest pullback broke intraday base and points toward mid-channel.
● Bearish structure with failed bounce at prior support (~3950) keeps momentum down; next magnet sits near 3855 (channel/HTF support confluence).
💡 Fundamental Analysis
● Short-term bearish: stronger USD and improved risk appetite recently weighed on gold after the retest of record highs, triggering corrective pressure.
✨ Summary
● Bias: short toward 3950 → 3855, invalidation above 4045. Key levels: 4045 (res), 3950/3855 (supports).
-------------------
Share your opinion in the comments and support the idea with a like. Thanks for your support!

Gold Analysis: Price action is back... Revised Gold Market Analysis (XAU/USD)
1. Current Market Situation
Your technical view remains sharp. The market has seen a significant break below the major psychological level of $4,000 per ounce. It is currently consolidating in the $3,940 - $3,980 range, attempting to find its footing after this major drop.
This pullback has been driven by short-term fundamental factors, primarily a reduction in "safe-haven" demand due to easing US-China trade tensions and significant profit-taking.
2. The Critical Resistance Zone: $4113
Your identification of $4113 as the key resistance is a crucial correction. This level isn't just a minor pivot; it's a major structural ceiling, likely representing a recent high or a significant reversal point.
The $4,000 - $4,018 area, which was just broken, now acts as the first minor hurdle, but $4113 is the true test of the bullish trend.
Your Scenarios:
Scenario 1: Rejection (Your "Hard to Go Up" Thesis) You are correct. If gold attempts a rally from its current price but fails to reclaim the $4113 level, it will be a powerful bearish confirmation. This failure would signal that the recent break below $4000 was not a small correction but the start of a much deeper move, with **$3770** as the logical target.
Scenario 2: Breakout (Your "Return to Previous Rate" Thesis) This is the long-term bullish-continuation scenario. If the price can stabilize, build momentum, and eventually push back above $4113, it would invalidate the entire recent sell-off. This would prove the drop was just a deep pullback, trapping short-sellers and signaling a strong move to new, higher records.
3. The Powerful Support Zone: $3,770
Your identification of "377" (the $3,770 area) remains the most critical support floor. This is a major structural level that everyone is watching.
Key Moving Average: This zone aligns perfectly with the 50-day moving average (approx. $3,767), a key dynamic support level for institutional traders.
Structural Lows: It also lines up with other identified pivot points (e.g., $3,830 and $3,754) and the 1-month low.
A decisive break below this $3,770 zone would be a very serious bearish development, signaling a potential medium-term trend change.
4. Key Fundamental Drivers (The "Why")
The technicals are being driven by a powerful "tug-of-war" between opposing fundamental forces:
Bearish Pressure (Short-Term):
Geopolitics: Optimism around US-China trade talks is pulling money out of safe havens like gold and into "risk-on" assets like stocks.
Profit-Taking: After a historic rally, many large funds are selling to lock in massive profits.
Bullish Support (Long-Term):
Federal Reserve Policy: This is the most important factor. The market has priced in a ~96% probability of a Fed interest rate cut today (October 29). Lower interest rates make non-yielding gold more attractive.
U.S. Dollar: Fed cuts tend to weaken the US Dollar, which makes gold (priced in USD) cheaper for international buyers.
Central Bank Buying: Global central banks continue to be massive buyers of gold, providing a strong, consistent baseline of demand.

DeGRAM | GOLD is declining in the channel📊 Technical Analysis
● XAU/USD remains confined within a descending channel, forming consistent lower highs and lows, reinforcing bearish control.
● Price recently rejected the 4,140 resistance and is targeting the 3,950 support zone, confirming short-term continuation within the channel structure.
💡 Fundamental Analysis
● Gold faces pressure from a stronger USD and rising Treasury yields, as traders scale back expectations of early Fed rate cuts.
✨ Summary
● Short bias below 4,140; targets 4,000–3,950. Technical rejection and macro strength in USD sustain bearish momentum.
-------------------
Share your opinion in the comments and support the idea with a like. Thanks for your support!
Gold Pullback or Reversal? Key Zone Ahead!As I expected , Gold ( OANDA:XAUUSD ) started to drop thanks to the Double Top Pattern and reached its target at the Support zone($4,011 – $3,981) .
Now, do you think Gold will start dropping again, or will it resume its recent weeks’ uptrend?
Today, I’m going to do a short-term 15-minute analysis of Gold , so stay tuned.
At the moment, Gold is approaching a Resistance zone($4,192 – $4,137) —also a Potential Reversal Zone (PRZ) —and moving within an ascending channel . Overall, the recent moves in Gold over the past couple of days look like a pullback to the previous Support zone($4,192 – $4,137) .
From an Elliott Wave perspective , it seems that Gold , given the momentum of its recent drop, is completing corrective waves, and we should expect another decline .
I expect Gold to start dropping again from the Resistance zone($4,192 – $4,137) and PRZ , and AFTER breaking the lower line of the ascending channel , it could fall at least down to around $4,039(First Target) .
Second Target: Support zone($4,011 – $3,981)
Stop Loss(SL): $4,222
Please respect each other's ideas and express them politely if you agree or disagree.
Gold Analyze (XAUUSD), 15-minute time frame.
Be sure to follow the updated ideas.
Do not forget to put a Stop loss for your positions (For every position you want to open).
Please follow your strategy; this is just my idea, and I will gladly see your ideas in this post.
Please do not forget the ✅ ' like ' ✅ button 🙏😊 & Share it with your friends; thanks, and Trade safe.

DeGRAM | GOLD is continuing to decline📊 Technical Analysis
● XAU/USD is trading within a descending channel after a double-top rejection near 4,360, with momentum now pressing below 4,106 resistance.
● Consecutive lower highs and breakdown retests suggest continuation toward 4,015 and possibly 3,953 as bears maintain control.
💡 Fundamental Analysis
● Gold weakens as U.S. Treasury yields rebound and market sentiment shifts to risk-on, reducing demand for safe-haven assets.
✨ Summary
● Short bias below 4,106; targets 4,015–3,953. Technical and macro pressure align for extended downside in the medium term.
-------------------
Share your opinion in the comments and support the idea with a like. Thanks for your support!

DeGRAM | GOLD rebounded in a descending channel📊 Technical Analysis
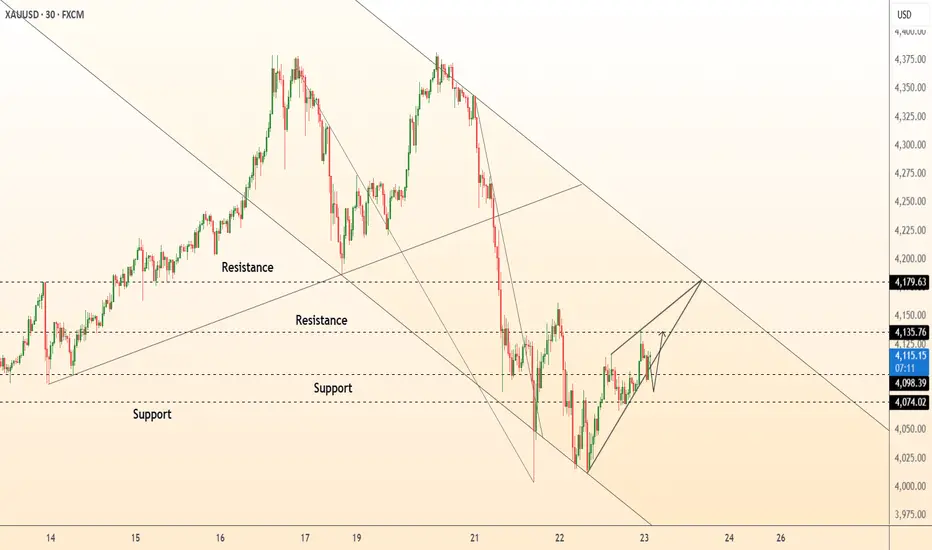
● XAU/USD is consolidating between 4,074 and 4,179, forming a short-term ascending structure within a broader descending channel.
● Price action suggests a potential breakout attempt above 4,135 toward 4,179, supported by higher lows and tightening range momentum.
💡 Fundamental Analysis
● Gold gains traction as traders anticipate weaker U.S. PMI data, which could limit dollar strength and revive demand for safe-haven assets.
✨ Summary
● Long bias above 4,100; targets 4,179. Technical compression and macro softness support short-term bullish continuation.
-------------------
Share your opinion in the comments and support the idea with a like. Thanks for your support!
RGLD Ready to Shine—Ride the Next Precious Metals WaveRoyal Gold Inc. (RGLD) is showing trending buy momentum supported by boosted FY2025 earnings estimates and solid growth in streaming revenues. Monitor price action near Weekly Support for an entry on this high-quality precious metals play.

Double Top Confirmed! Is Gold About to Fall Deeper?As expected from my previous idea , Gold touched its target of $4,183 ( the double top pattern’s target(Small) ). Before reaching that target, it had some ups and downs over the past few days, mainly due to the ongoing US-China tensions .
Gold is trading near a Support zone($4,193 – $4,156) .
From a classical technical analysis perspective, it’s forming a clear double top pattern on the 1-hour timeframe . There’s also a regular bearish divergence (RD-) visible between the two peaks of the double top.
From an Elliott Wave theory standpoint, it looks like Gold has started its corrective wave. If the Support zone($4,193 – $4,156) and the double top pattern’s neckline break , we can expect further downside .
I expect that after breaking the Support zone($4,193 – $4,156) and the neckline , Gold could drop at least to around $4,083(First Target) .
Second Target: $4,057
Stop Loss(SL): $4,385(Worst)
Note: Keep in mind that given the ongoing US-China tensions, any news could invalidate this analysis. So it’s more important than ever to manage your risk carefully these days.
Please respect each other's ideas and express them politely if you agree or disagree.
Gold Analyze (XAUUSD), 1-hour time frame.
Be sure to follow the updated ideas.
Do not forget to put a Stop loss for your positions (For every position you want to open).
Please follow your strategy; this is just my idea, and I will gladly see your ideas in this post.
Please do not forget the ✅ ' like ' ✅ button 🙏😊 & Share it with your friends; thanks, and Trade safe.

XAUUSD: Double top pattern completed, gold confirms reversalContrary to the vast majority of people's beliefs, OANDA:XAUUSD was unable to break through the old peak at $4380/oz to move above the $4400/oz area but formed a double top pattern on the 1 hour timeframes and corrected downwards with a record margin from $4380 to near $4000/oz.
With these factors, we can almost certainly conclude that gold has completed this rally and will begin to correct downwards in the near future.
Looking through the options market, almost all traders have withdrawn all Longcall contracts from the market and a large number of Longput contracts have been pushed in.
This further reinforces the fact that the price has begun to enter a downward correction cycle in the near future.
Some key levels that we need to pay attention to in today's trading session:
Resistance: , , ,
Support:
Margin zone support:
Strong support:
Always be patient and wait for the price to reach the support and resistance zones above and get confirmation. Do not place limit orders or enter orders when the price is increasing or decreasing sharply.
Take advantage of the above support and resistance zones and trade short-term when the price reacts at these support and resistance zones.
Take profit when the price moves from 10 to 20 prices since entering the order at the support and resistance areas.
Wait for reactions such as Engulfing candles, Doji,... at the support and resistance zones.
Always set stop loss when trading and manage risks closely.
Note: Price may spike through support or resistance levels and then reverse. Therefore, it is crucial to patiently wait for the candle to close before entering a trade.
Victor Dan @ ZuperView

DeGRAM | GOLD broke an ascending structure📊 Technical Analysis
● XAU/USD is trading within a descending channel but recently bounced off its lower boundary near 4,070, showing early signs of bullish correction.
● A breakout above 4,149 could trigger momentum toward 4,192 and 4,236, supported by a double rejection at the channel’s lower trendline.
💡 Fundamental Analysis
● Gold is gaining mild strength as lower U.S. Treasury yields and geopolitical tensions boost demand for safe-haven assets.
✨ Summary
● Long bias above 4,070; targets 4,149–4,236. Technical recovery and safe-haven demand support short-term bullish momentum.
-------------------
Share your opinion in the comments and support the idea with a like. Thanks for your support!

Gold (XAU/USD) M30 Smart Money Setup – Price Action Analysis📊 Current Structure:
On the M30 timeframe, CHOCH (Change of Character) has formed around 4186, confirming a possible bearish shift in market structure. The previous low stands at 4004, which acts as a major liquidity zone and final bearish target.
🧠 Smart Money Concept Overview
After the CHOCH at 4186, Gold is expected to retrace to premium zones before continuing its bearish move. The market has created two Fair Value Gaps (FVGs) — potential supply areas where price may react.
⚙️ Key Zones
1️⃣ 1st FVG (4231 – 4246) → Minor retracement zone 🟠
2️⃣ 2nd FVG (4302 – 4322) → Strong supply zone 🔴
📍 Stop Loss (SL): 4346
🎯 Target (TP): 4001
🧭 Trading Plan
Wait for price to tap into any FVG zone (4231–4322).
Confirm bearish reaction using candlestick rejection or CHOCH on lower TFs (M5–M15).
Enter short positions aiming for the 4001 target.
Risk management: keep SL tight above 4346.
📉 Conclusion
Gold currently shows strong bearish pressure after CHOCH confirmation. Smart money traders will be looking for short entries from FVG zones toward the 4001 liquidity target. Manage your trade wisely and follow structure confirmation before entry. 🧩
💡 Disclaimer: This analysis is for educational purposes only. Always do your own research before trading. 📚

Analysis and trading position for gold
Hello traders
The structure of the one-hour time frame is bearish for now
The algorithm for one-hour sellers has also been activated, but it has not yet pulled back to its equilibrium. In one hour, there are two pullback ranges, 4207 and 4232, which you can look for a trigger sell (this range has high validity until the defined TP is touched. If it gives the target first, this range will be merely a reaction). From these areas and TP, the one-hour sellers of this algorithm are defined at 4040, which is one with a daily support, the one-hour seller is liquidating here, which is also the daily support, so we can expect a good move from this support.

Gold Double Top Forming – Correction Ahead?When an asset hits an All-Time High(ATH) , technical analysis can get a bit tricky because there’s no historical resistance above and the usual technical rules might have less impact. However, right now it seems like some technical principles are still visible on gold’s chart, at least on the 1-hour timeframe , and I’d like to share that with you.
At the moment, Gold has broken below the lower line of its ascending channel, the Support zone($4,320 – $4,279) , and the neckline of a Double Top Pattern . This could indicate the start of a short-term correction. Given how strong gold’s momentum has been in recent weeks, this correction might not last too long since gold remains very attractive globally.
From an Elliott Wave perspective , the formation of a double top pattern might signal the end of an impulsive wave and the beginning of a corrective phase .
I expect that in the next few hours, Gold could at least drop to the Double Top Pattern’s target around $4,183 . If Gold breaks the Support zone($4,193 – $4,156) , we could see a deeper correction .
Second target:$4,143
Stop Loss(SL): $4,385(Worst)
Please respect each other's ideas and express them politely if you agree or disagree.
Gold Analyze (XAUUSD), 1-hour time frame.
Be sure to follow the updated ideas.
Do not forget to put a Stop loss for your positions (For every position you want to open).
Please follow your strategy; this is just my idea, and I will gladly see your ideas in this post.
Please do not forget the ✅ ' like ' ✅ button 🙏😊 & Share it with your friends; thanks, and Trade safe.

DeGRAM | GOLD held the support line📊 Technical Analysis
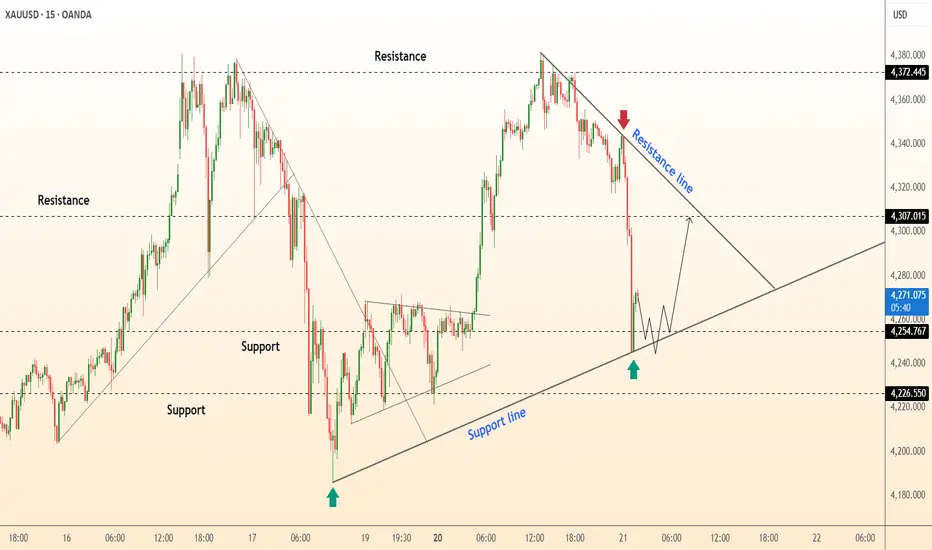
● XAU/USD rebounded from the 4,226 support area, confirming the strength of the rising trendline and signaling a potential short-term recovery.
● A break above 4,254 could trigger a bullish continuation toward 4,307, with the upward trajectory supported by a well-formed correction structure after the recent drop.
💡 Fundamental Analysis
● Gold gains support from weaker U.S. yields and safe-haven demand amid ongoing geopolitical concerns and Fed policy uncertainty.
✨ Summary
● Long bias above 4,226; targets 4,254–4,307. Trendline support and improving fundamentals favor a short-term bullish rebound.
-------------------
Share your opinion in the comments and support the idea with a like. Thanks for your support!
DeGRAM | GOLD above the support area📊 Technical Analysis
● XAU/USD found strong support in the 4,220 zone, where buyers stepped in after a brief pullback, confirming the area as a key accumulation level.
● Price is now consolidating below 4,260, preparing for a potential bullish breakout toward 4,312–4,357, supported by the fixing pattern near the support zone.
💡 Fundamental Analysis
● Gold demand remains solid as geopolitical uncertainty and lower Treasury yields sustain its safe-haven appeal.
✨ Summary
● Long bias above 4,220; objectives 4,312–4,357. Price stabilization at support suggests renewed upward momentum in the short term.
-------------------
Share your opinion in the comments and support the idea with a like. Thanks for your support!

Gold Price Outlook | Buyers Stay in Full ControlGold remains firmly positioned within its broader bullish trajectory, supported by consistent demand from both institutional and retail investors. The market has shown strong resilience, forming a well-defined higher-low structure, which reflects continued accumulation. Price action indicates that buyers are confidently stepping in after each controlled pullback, maintaining upward momentum.
The current market tone favors continuation toward the 4,180–4,250 range if momentum persists. Short-term retracements into the 4,070–4,090 area may offer new buying opportunities for position traders aligning with the prevailing trend. Macroeconomic factors such as ongoing inflation concerns, geopolitical instability, and cautious monetary policy stance continue to underpin gold’s strength.

DeGRAM | GOLD held the support line📊 Technical Analysis
● XAU/USD continues to respect the ascending support line, confirming an active short-term uptrend. Price rebounded from 4,308 support, forming a higher low structure that suggests momentum preservation.
● Immediate resistance lies at 4,376, where a breakout could extend the bullish leg if the current consolidation near 4,330 holds.
💡 Fundamental Analysis
● Gold remains supported by softer U.S. inflation expectations and rising geopolitical risk, keeping investor demand intact.
✨ Summary
● Long bias above 4,308; objectives 4,376–4,380. Trendline strength and supportive fundamentals signal continued short-term upside.
-------------------
Share your opinion in the comments and support the idea with a like. Thanks for your support!

DeGRAM | GOLD formed a bullish takeover📊 Technical Analysis
● XAU/USD shows a bullish takeover after rebounding from the support line near 4,219, confirming buyers’ control in the short-term structure.
● Price is now trading within an ascending channel, aiming toward the 4,240–4,250 resistance area, with intraday pullbacks likely forming higher lows.
💡 Fundamental Analysis
● Gold gains support from softer U.S. yields and cautious Fed remarks, improving sentiment for safe-haven assets.
✨ Summary
● Long bias above 4,219; objectives 4,240–4,250. Strong bullish candle and favorable macro backdrop confirm short-term upward momentum.
-------------------
Share your opinion in the comments and support the idea with a like. Thanks for your support!
