DeGRAM | GOLD is correcting 📊 Technical Analysis
● XAU/USD tested resistance at 3871 within an ascending channel and showed rejection, signaling a short-term corrective phase.
● Price structure suggests a pullback toward 3825–3785 support before a potential re-test of upper channel levels.
💡 Fundamental Analysis
● Dollar strength is reinforced by hawkish Fed commentary and firm bond yields, weighing on gold’s near-term outlook.
✨ Summary
Gold faces rejection at 3871, with downside targets near 3825 and 3785. Short-term bias remains bearish while under resistance.
-------------------
Share your opinion in the comments and support the idea with a like. Thanks for your support!
Goldsignal

DeGRAM | GOLD reached the upper boundary of the channel📊 Technical Analysis
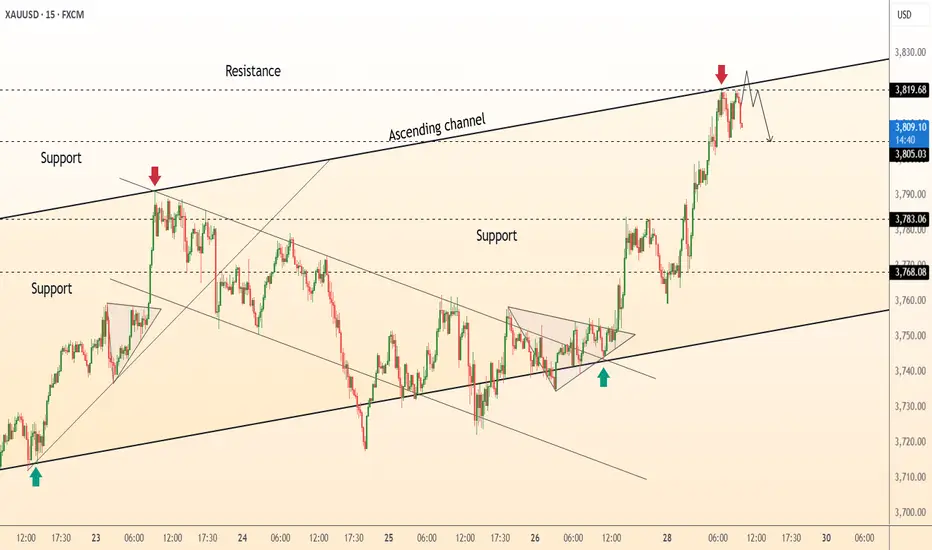
● XAU/USD hit resistance at 3819 within the ascending channel, showing rejection signals and forming a possible reversal pattern.
● The setup points to a short-term pullback toward 3805 and possibly 3768, while failure to reclaim highs strengthens the bearish case.
💡 Fundamental Analysis
● Rising U.S. yields and a stronger dollar weigh on gold, as recent Fed commentary signals a cautious stance on rate cuts.
✨ Summary
Gold faces rejection at 3819 resistance, with downside risk toward 3805–3768. Bearish momentum dominates unless price reclaims the highs.
-------------------
Share your opinion in the comments and support the idea with a like. Thanks for your support!
DeGRAM | GOLD above the demand zone📊 Technical Analysis
● XAU/USD rebounded from the demand zone and broke above the descending resistance line, confirming bullish intent.
● Price is consolidating near 3,748, with targets at 3,758 and 3,771, while support remains firm at 3,735.
💡 Fundamental Analysis
● Gold is supported by weaker U.S. Treasury yields and renewed safe-haven demand amid global economic concerns, boosting short-term upside potential.
✨ Summary
XAU/USD has broken resistance from the falling structure, eyeing 3,758–3,771 while holding support at 3,735. Upside momentum strengthens with safe-haven flows.
-------------------
Share your opinion in the comments and support the idea with a like. Thanks for your support!

Gold Roadmap: Breakout Confirmed –New ATH or Another Correction?Gold ( OANDA:XAUUSD ) as I expected in the previous idea (Short and Long positions hit the target).
First of all, I should say that this analysis is for the short term and on a 15-minute time frame.
Gold seems to have managed to break the Resistance lines, Resistance zone($3,763-$3,750), and the upper line of the symmetrical triangle in the past few minutes.
I expect Gold to rise to at least $3,779, and then there are two scenarios for Gold: creating a new All-Time High, OR re-correcting.
Stop Loss(SL): $3,741.7
Please respect each other's ideas and express them politely if you agree or disagree.
Gold Analyze (XAUUSD), 15-minute time frame.
Be sure to follow the updated ideas.
Do not forget to put a Stop loss for your positions (For every position you want to open).
Please follow your strategy; this is just my idea, and I will gladly see your ideas in this post.
Please do not forget the ✅ ' like ' ✅ button 🙏😊 & Share it with your friends; thanks, and Trade safe.
Gold's rise encountered resistance and launched adeep correctionGold maintains high-level fluctuations at the daily level, but the short-term trend shows weakness. The price on the 4-hour chart has fallen below the previous fluctuation range and is currently obviously constrained by the 3760-3770 pressure zone. The K-line continues to run below the short-term moving average. The overall structure shows a weak and volatile pattern. The recent rebound has approached the previous key pressure area. It is expected that the downward trend will most likely continue after the rebound repair is completed. Although a V-shaped reversal has formed in the smaller cycle, the price has stagnated near the pressure zone. The technical indicators show a top divergence signal, indicating that the short-term momentum is gradually weakening and there is a tendency to turn to adjustment again. The comprehensive technical aspect shows that gold faces downside risks in the short term. It is necessary to focus on the adjustment strength and the performance of the key support level below. The operation suggestion is to short on rallies. Focus on the rebound resistance of 3760-3770 on the top and the support of 3715-3700 on the bottom.

Gold Roadmap| Short-termGold ( OANDA:XAUUSD ) has been surprising everyone in the last few weeks, making new All-Time Highs(ATHs) every day.
Let me start by saying that this is a short-term analysis on a 15-minute time frame .
Technical analysis generally works worse when assets are creating ATHs . One reason for this is that there is no past history .
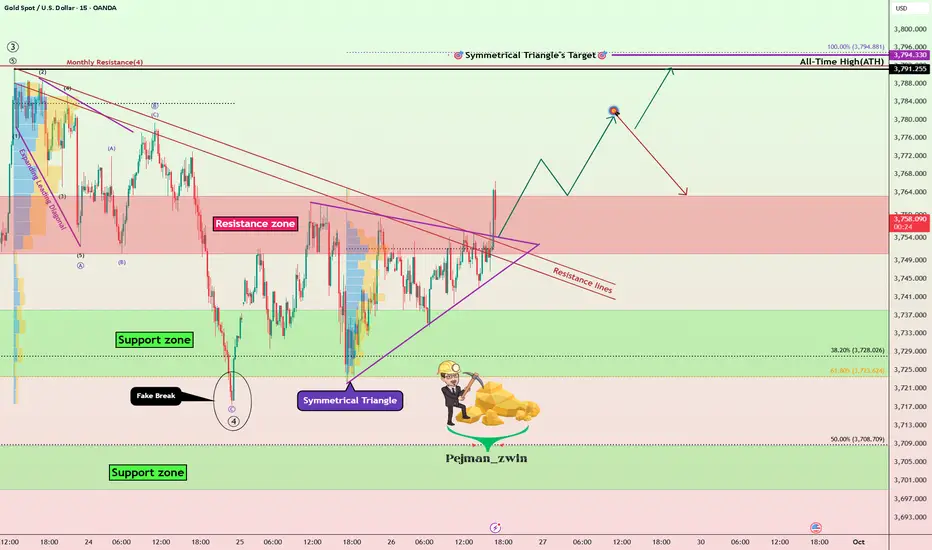
Gold has started to correct after the formation of the last All-Time High(ATH=$3,791.55) .
In terms of Elliott Wave theory , given the bullish momentum of Gold , it seems that the main wave 3 has been completed, and we should wait for the main wave 4 . It seems that the main wave 4 can be completed with a Zigzag Correction(5-3-5) .
I expect Gold to continue its downward trend to the Support zone($3,738-$3,723) , and then if we find a trigger for a Long position , we can ride the bullish wave of Gold again .
Note: If the Resistance lines are broken, we can expect a new All-Time High.
Note: If the Support zone($3,738-$3,723) is broken, we can expect a deeper correction.
Please respect each other's ideas and express them politely if you agree or disagree.
Gold Analyze (XAUUSD), 15-minute time frame.
Be sure to follow the updated ideas.
Do not forget to put a Stop loss for your positions (For every position you want to open).
Please follow your strategy; this is just my idea, and I will gladly see your ideas in this post.
Please do not forget the ✅ ' like ' ✅ button 🙏😊 & Share it with your friends; thanks, and Trade safe.

DeGRAM | GOLD fixed in the ascending channel📊 Technical Analysis
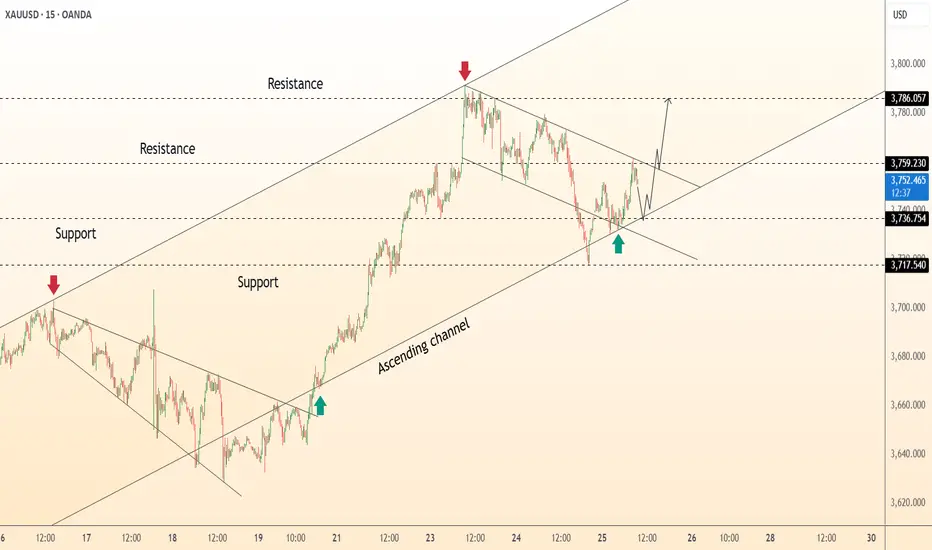
● XAU/USD is trading within an ascending channel, bouncing from the 3,717 support and reclaiming 3,736, signaling strong buying interest.
● A breakout from the short-term corrective channel targets 3,786, aligning with the channel’s upper boundary and confirming bullish continuation.
💡 Fundamental Analysis
● Gold is supported by softer U.S. yields and safe-haven demand as uncertainty around global growth and Fed policy tempers dollar strength.
✨ Summary
XAU/USD builds bullish momentum above 3,717 support. Key target: 3,786 resistance, with 3,736 as interim support. Short-term outlook favors further upside.
-------------------
Share your opinion in the comments and support the idea with a like. Thanks for your support!
DeGRAM | GOLD formed the descending top📊 Technical Analysis
● XAU/USD hit resistance near 3,788, showing rejection signals and forming a potential short-term top.
● Price is consolidating under resistance with lower highs, pointing toward a corrective move to 3,752 or deeper to 3,714 support.
💡 Fundamental Analysis
● Hawkish Fed commentary and rising bond yields continue to pressure gold, limiting upside momentum in the short term.
✨ Summary
Gold faces rejection near 3,788 with bearish momentum favoring a pullback toward 3,752 and 3,714 support zones.
-------------------
Share your opinion in the comments and support the idea with a like. Thanks for your support!

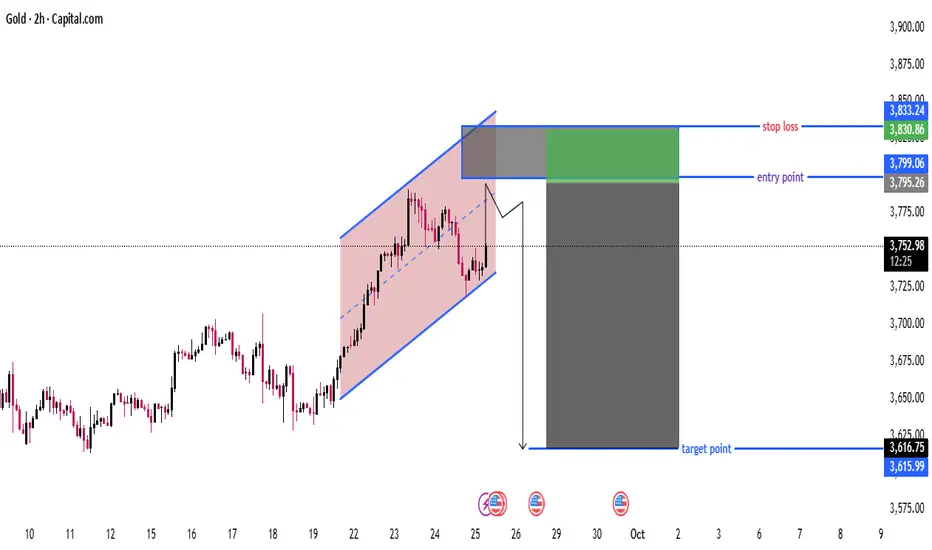
Gold 2H – Bearish Channel Breakdown SetupChart Overview
This chart shows a bearish setup for Gold, suggesting a short (sell) trade with the following key components:
🔵 Channel Analysis
Rising Parallel Channel: Price has been moving within an ascending channel (pink shaded area), indicating a short-term uptrend.
The recent candle breaks or touches the lower boundary of this channel, hinting at a potential breakdown.
📉 Trade Setup
This looks like a short (sell) trade idea based on a potential breakout to the downside.
Component Level Details
Entry Point 3,799.06 Entry zone marked in green; at/near the lower trendline of the ascending channel
Stop Loss 3,833.24 Just above the recent highs and the channel top
Target Point 3,616.75–3,615.99 Target area marked in blue; aligns with a prior support zone
✅ Trade Logic
Bearish Bias: Price action shows weakening momentum near the top of the channel.
Breakdown Expected: Entry assumes a breakdown of the ascending channel.
Risk-Reward Ratio (RRR): Very favorable — large potential move down compared to the stop loss range.
📊 Risk Management
Stop Loss: Properly placed above resistance zone — protects against false breakouts.
Target Zone: Based on historical support/resistance structure.
RRR Estimate: Approx. 1:5+, which is excellent if the move materializes.
⚠️ Potential Risks
False Breakout: Price could rebound back into the channel, invalidating the bearish thesis.
Fundamental Triggers: Gold is sensitive to macroeconomic news (e.g., interest rate changes, geopolitical tension, inflation data).
📌 Summary
This is a well-structured short trade setup based on a rising channel breakdown.
With a clear entry, stop loss, and profit target, it presents a high-reward, controlled-risk opportunity.
Best confirmed with:
Bearish candlestick confirmation at the entry point
Volume spike on breakdown
Fundamental catalysts supporting gold weakness
Expecting more drop Gold As per chart mentioned its falling triangle pattern . Price should visit below 3700 and if marked circle passed it will be straight blood bath ‼️‼️

XAU/USD: Demand Zone Long Setup After Resistance Rejection ?Technical Analysis Breakdown:
🔹 1. Price Structure:
Strong bullish breakout occurred around 09:00 with a wide-bodied green candle, indicating high buying interest.
Price consolidated in a tight range under resistance (~3,782.996 – 3,784.000), suggesting accumulation or distribution.
Followed by a strong bearish rejection (2 large red candles), confirming a liquidity sweep and rejection from resistance.
🔹 2. Supply & Demand Zones:
Demand Zone: Marked between 3,743.367 and 3,748.000 (highlighted in light blue).
Price previously reacted here and then rallied aggressively—indicating strong buying interest.
Entry Position: Placed slightly above the demand zone, betting on a bounce.
Stop Loss: Below the demand zone (~3,737.837) – to avoid deeper liquidity sweeps.
Take Profit: Near previous resistance/consolidation (~3,759.914).
🔹 3. Candlestick Behavior:
The recent bearish momentum shows a liquidity grab or stop hunt below minor lows before touching the demand zone.
The current candle shows a potential reversal wick, indicating possible buying pressure returning.

DeGRAM | GOLD reached the upper boundary of the channel📊 Technical Analysis
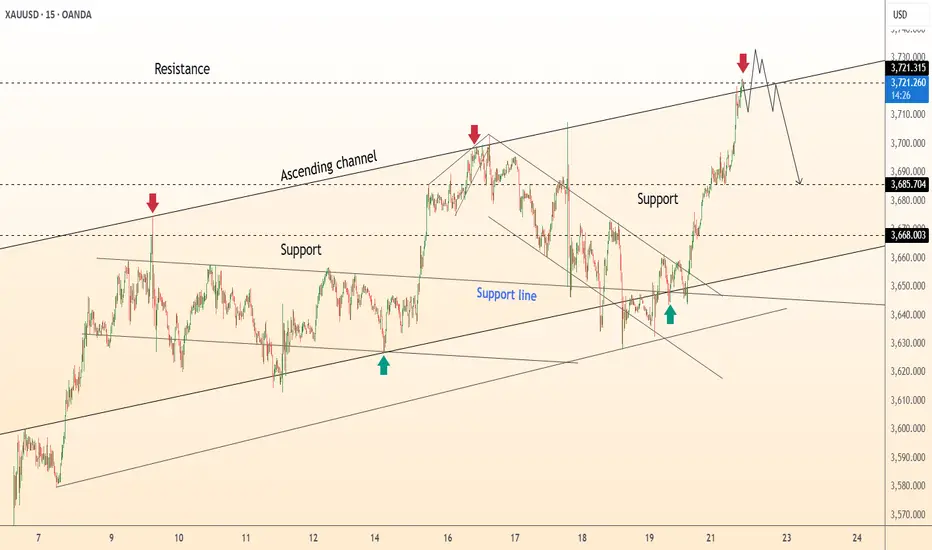
● XAU/USD touched the upper boundary of the ascending channel near 3720–3730, where rejection signals have formed.
● Price is expected to retrace toward 3685 and possibly 3668 support, confirming a short-term pullback.
💡 Fundamental Analysis
● Gold faces selling pressure as U.S. yields remain elevated and the dollar holds firm ahead of Fed commentary, reducing safe-haven demand.
✨ Summary
Gold shows rejection at 3720–3730 resistance, projecting a correction toward 3685 and 3668 support with short-term bearish momentum.
-------------------
Share your opinion in the comments and support the idea with a like. Thanks for your support!
DeGRAM | GOLD fixed above the support line📊 Technical Analysis
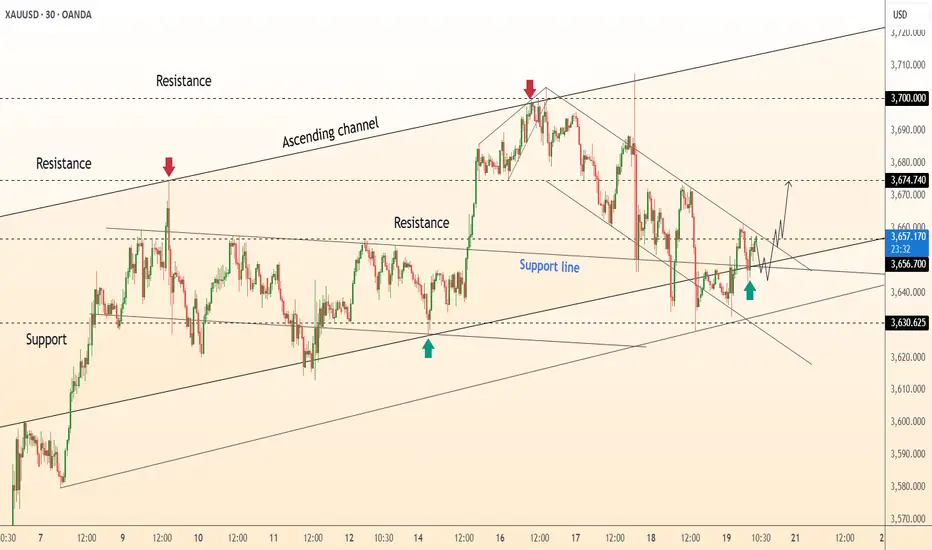
● XAU/USD is trading within an ascending channel, holding above the 3630 support and attempting to reclaim 3656 resistance.
● A breakout above 3674 would confirm bullish momentum, opening the path toward 3700 while the lower boundary near 3630 acts as structural support.
💡 Fundamental Analysis
● Gold gains short-term support from weaker Treasury yields and cautious Fed outlook, as traders weigh inflation risks against slower global growth.
✨ Summary
XAU/USD defends 3630 support and targets 3674–3700 resistance, with momentum favoring a bullish short-term continuation.
-------------------
Share your opinion in the comments and support the idea with a like. Thanks for your support!
Don’t hesitate when gold rebounds, just go short!Gold fluctuated repeatedly in the range yesterday, and the trend was completely in line with our trading idea of selling high and buying low. The long and short two-way layout was stable and profits were achieved. The daily line closed with a negative line and a long upper shadow, indicating that the high-level adjustment pattern is still continuing, but the technical indicators have not formed a death cross, and the overall bullish trend is still dominant. The short-term level continues to maintain a volatile and bearish idea. The rebound of the middle track of the Bollinger band in the 4H cycle was blocked and fell back. At the same time, the 1H secondary high was suppressed, and the upper pressure was still significant. Today's operation focus is based on the middle track pressure to see a volatile downward trend. Pay attention to the 3660-3675 area on the top. If this range is broken, the short-term may extend to test the 3685 line; pay attention to the 3625-3610 range on the bottom. Once it stabilizes, it is still a good opportunity to buy on the low. If it holds this position, the bullish pattern remains unchanged. If it is lost, we must be alert to the risk of a deep correction. The current volatile market continues to release room for selling high and buying low. Planned trading is the key to avoiding emotional chasing of gains and losses.

Gold After Fed Decision: Buy the Rumor, Sell the News?Gold ( OANDA:XAUUSD ) seems to have caught many traders by surprise, as many thought it would continue to create new daily All-Time High(ATH) with the Federal's interest rate announcement , but Gold followed the adage " Buy the rumour, sell the news ".
Gold started moving emotionally yesterday after the US interest rate announcement and made a new ATH($3,707.555) . Given the volume of yesterday's candle , it seems that Gold is having a hard time creating a new ATH.
Gold is currently breaking the Support lines , which is a sign of weakness in the bullish trend of Gold .
In terms of Elliott Wave theory , it seems that Gold has completed the main wave 5 and we should wait for corrective waves . Do you agree with me!?
I expect Gold to at least decline after the pullback of the Support lines to the First target($3,614) .
Second Target: $3,599
Third Target: $3,577
Stop Loss (SL) = $3,677
Note: To enter a short position, it is better to wait for an upward correction, but depending on the movement of gold and your strategy, you can open a short position.
Do you think Gold can create a new ATH anytime soon?
Please respect each other's ideas and express them politely if you agree or disagree.
Gold Analyze (XAUUSD), 1-hour time frame.
Be sure to follow the updated ideas.
Do not forget to put a Stop loss for your positions (For every position you want to open).
Please follow your strategy; this is just my idea, and I will gladly see your ideas in this post.
Please do not forget the ✅ ' like ' ✅ button 🙏😊 & Share it with your friends; thanks, and Trade safe.

Overestimate and undervalue, opportunities abound!The range operation ideas we shared have been verified to be correct again. We have perfectly grasped the market rhythm by going short first and then long. Congratulations to friends who are paying attention. After the US market, gold fell to the key support area of 3630-3620 and then rebounded quickly. At present, we continue to focus on the short pressure position of 3670-3690. This position is not only the pressure near the 5-day line, but also the upper pressure area of the hourly chart moving average band. In the short term, it may become the core area of the bull-bear game.
Although the interest rate cut has been implemented, the market focus has shifted to whether the pace and magnitude of future rate cuts will increase. The marginal benefits to bulls are weakening. Therefore, the short-term recommendation is still to sell high and buy low in the range, and not to chase highs and sell lows. If your recent operations are not ideal, or you want to make your investment more stable, you are welcome to communicate with me at any time, and I will help optimize the strategy.
From the 4-hour level, 3630-3620 is still the key defensive support level. If it falls below this area, the bullish and bearish pattern in the future market may change; and 3670-3690 is still a strong pressure. Strategically, we will continue to use this range as the core for long and short layout. In the middle position, we should watch more and do less, and wait patiently for the key points before entering the market to avoid unnecessary risks brought by frequent chasing orders.
Gold operation strategy: When it falls back to the 3630-3620 area, lightly arrange long orders, and first target 3660-3670. When it touches the upper pressure, you can gradually reduce the position and take profit to provide protection.

DeGRAM | GOLD rebound in the ascending channel📊 Technical Analysis
● XAU/USD rebounded sharply from the ascending channel’s lower boundary near 3,640, confirming active demand.
● Price is now targeting 3,685 resistance; a breakout above could extend momentum toward 3,700.
💡 Fundamental Analysis
● Softer U.S. yields and weaker dollar momentum support gold’s short-term bullish outlook despite Fed’s cautious stance.
✨ Summary
Gold bullish above 3,654; near-term targets 3,685 and 3,700. Key support remains at 3,654.
-------------------
Share your opinion in the comments and support the idea with a like. Thanks for your support!

DeGRAM | GOLD under the resistance area📊 Technical Analysis
● XAU/USD rejected the 3,690–3,700 resistance area and broke below the channel support, signaling fading bullish momentum.
● The structure now favors continuation lower, with short-term pullbacks likely capped below 3,678 before targeting the 3,664 and 3,638 supports.
💡 Fundamental Analysis
● Gold remains pressured as firm U.S. yields and hawkish Fed expectations support the dollar, while easing safe-haven demand limits upside momentum.
✨ Summary
Bearish below 3,678; targets 3,664 → 3,638. Invalidation on a close above 3,690.
-------------------
Share your opinion in the comments and support the idea with a like. Thanks for your support!

DeGRAM | GOLD reached the upper boundary of the channel📊 Technical Analysis
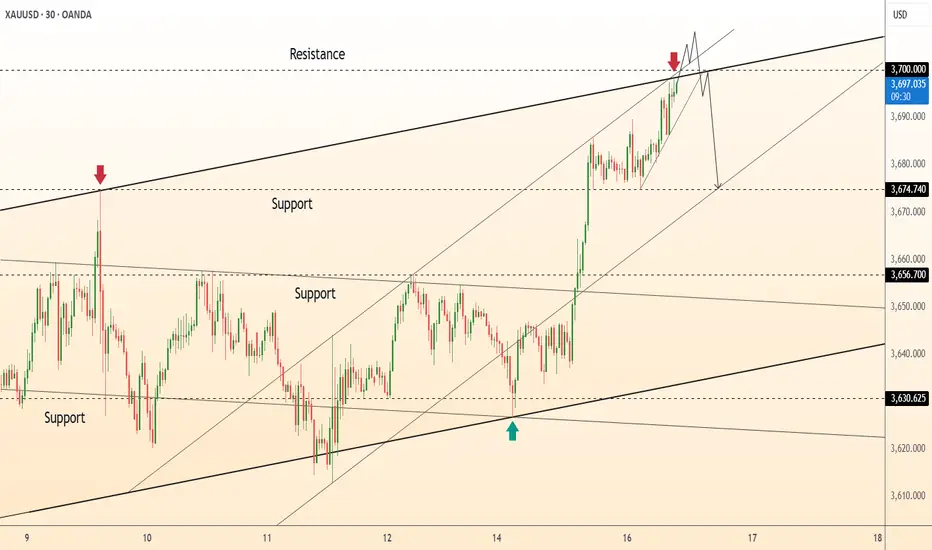
● XAU/USD has reached the 3,700 resistance, forming a rejection wick that signals weakening bullish momentum at the upper channel boundary.
● A pullback scenario is favored, with downside targets aligning at 3,674 support first and then 3,656 if selling pressure extends.
💡 Fundamental Analysis
● Gold is facing renewed headwinds from stronger US Treasury yields, while dollar demand remains firm on expectations of a prolonged restrictive Fed stance.
✨ Summary
Bearish below 3,700; targets 3,674 → 3,656. Invalidation on a close above 3,705.
-------------------
Share your opinion in the comments and support the idea with a like. Thanks for your support!
GOLD: No Bears In SightGold is still bullish. If price pulls back, the 3660–3665 zone is my POI. If momentum keeps driving and we get a breakout above 3690, my target will be 3725. Gold has pushed well beyond the 3660 liquidity pool, confirming buyers strength.
(H1)
Impulsive leg from 3642-3677 left behind some imbalances below:
3660–3665 FVG (fresh demand).
3635–3642 (deeper support if volatility spikes).
As long as gold holds above 3660, buyers remain in control.
(M15)
Price is consolidating just under 3680, showing short-term exhaustion after the run.
Liquidity rests above 3685–3690, which could be swept next.
We also have equal lows at 3665 which may get tested if a pullback occurs.
Pullback Buy (High-Probability)
Entry Zone 3660–3665
SL 3650
TP1 3685
TP2 3700
TP3 3725
Breakout Buy (If No Pullback)
Entry Break above + Retest 3690
Stop Loss 3680
TP1 3705
TP2 3725
Invalidation: H4 close below 3650, which would open retrace toward 3635.

DeGRAM | GOLD above the support📊 Technical Analysis
● XAU/USD bounced from the 3,638 support line and is attempting a breakout from the descending resistance line.
● A confirmed push above 3,646 opens the way toward 3,656, with potential momentum extension toward 3,666.
💡 Fundamental Analysis
● Gold is supported by easing US dollar strength as traders reassess Fed policy outlook, while safe-haven demand is firm amid geopolitical risks and weaker global growth signals.
✨ Summary
Bullish above 3,638; targets 3,646 → 3,656 → 3,666. Invalidation on a close below 3,638.
-------------------
Share your opinion in the comments and support the idea with a like. Thanks for your support!

Gold Correction After ATH – Bearish Waves Ahead?Gold( OANDA:XAUUSD ) has been in a correction mode for the past four days after creating a new All-Time High (ATH) . The question is whether the correction will continue or not.
Over the past 4 days, US indices were released, but Gold was not greatly affected by these indices, although the manner in which the US indices were announced was in favor of Gold ( Maybe gold is saturated with buying. ).
Gold is currently trading in the Support zone($3,644-$3,636) and near the Support line.
In terms of Elliott Wave theory , it seems that Gold has completed the Double Three Correction structure(WXY), and we can expect bearish waves .
I expect Gold to break the Support zone($3,644-$3,636) AFTER breaking the Support line and fall to at least $3,624(First Target) .
Second Target: Support lines
Stop Loss (SL) = $3,662
Please respect each other's ideas and express them politely if you agree or disagree.
Gold Analyze (XAUUSD), 15-minute time frame.
Be sure to follow the updated ideas.
Do not forget to put a Stop loss for your positions (For every position you want to open).
Please follow your strategy; this is just my idea, and I will gladly see your ideas in this post.
Please do not forget the ✅ ' like ' ✅ button 🙏😊 & Share it with your friends; thanks, and Trade safe.

Big events in gold this week!Gold closed with another positive line on the weekly chart. Although it has a long upper shadow line, the overall upward pattern is still solid, the trend has not been destroyed, and it still maintains a strong pattern. The daily level shows a high-level yin-yang cycle consolidation. It has failed to break through the 3660 high in the short term. Therefore, it will temporarily respond with a shock thinking, waiting for another bullish opportunity after the breakthrough. What needs to be paid attention to is that the Federal Reserve’s interest rate decision is about to come this week. The market may usher in a new direction choice, and volatility may intensify. At that time, the market rhythm will be more critical. Pay attention to the 3620-3660 area in the small range of the day. If it can break through, look at the extension space of the large range of 3675-3610. Remind brothers, this week’s trading should pay more attention to rhythm and risk control, avoid blindly chasing ups and downs, wait patiently for the key positions to be confirmed before entering the market accurately, execute high-winning trading plans, and lock profits firmly in the account.For the specific layout and operation rhythm, please refer to the bottom notification I released at the first time to ensure consistent execution and unified thinking, and avoid blindly following the trend and causing unnecessary risks.
