Gold Pulls Back After Hitting $3,895 – Consolidation Before 3900📊 Market Overview
Gold reached a new high at $3,895, approaching the psychological $3,900 level, before facing profit-taking pressure and retreating toward $3,885. The market shows caution when testing strong resistance, as the USD remains weak and safe-haven demand persists.
📈 Technical Analysis
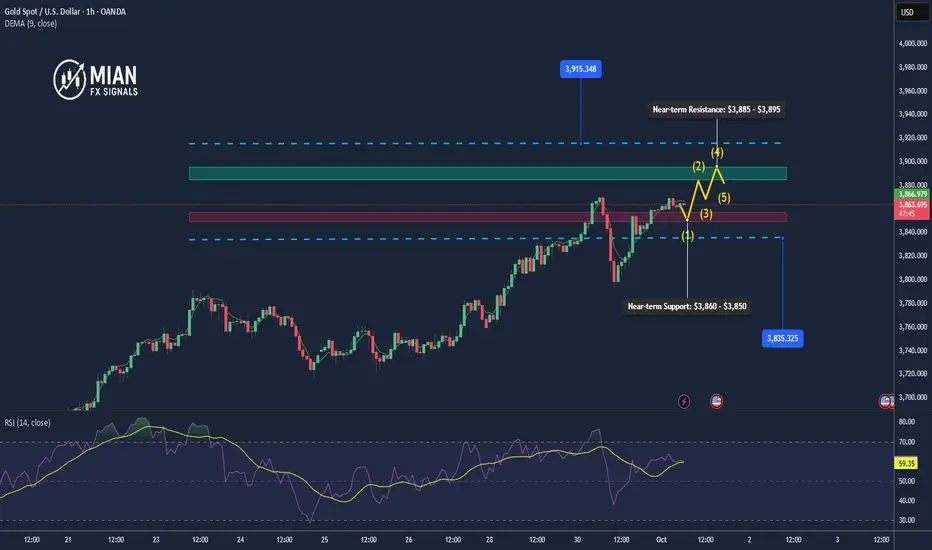
• Near-term Resistance: $3,895 – $3,900
• Strong Resistance: $3,915
• Near-term Support: $3,873 – $3,870
• Strong Support: $3,860 – $3,850
• EMA20 (H1): Price remains above EMA20, keeping the short-term uptrend intact.
• H1 Candlestick: Long upper wick at $3,895 indicates strong selling pressure at resistance, raising the risk of a short-term pullback.
📌 Outlook
Gold maintains its short-term bullish trend, but the $3,895–$3,900 zone remains a key barrier. A breakout could push price to $3,915, while a correction to $3,880–$3,872 would be normal consolidation before further gains. A break below $3,872 may drive price toward $3,860.
🎯 Trading Strategy
🔺 BUY XAU/USD
• Entry: $3,872 – $3,869
• 🎯 TP: 40 / 80 / 200 pips
• 🛑 SL: $3,866
Goldsignals

Gold Buy Setup – High Probability Reversal from Key Zone
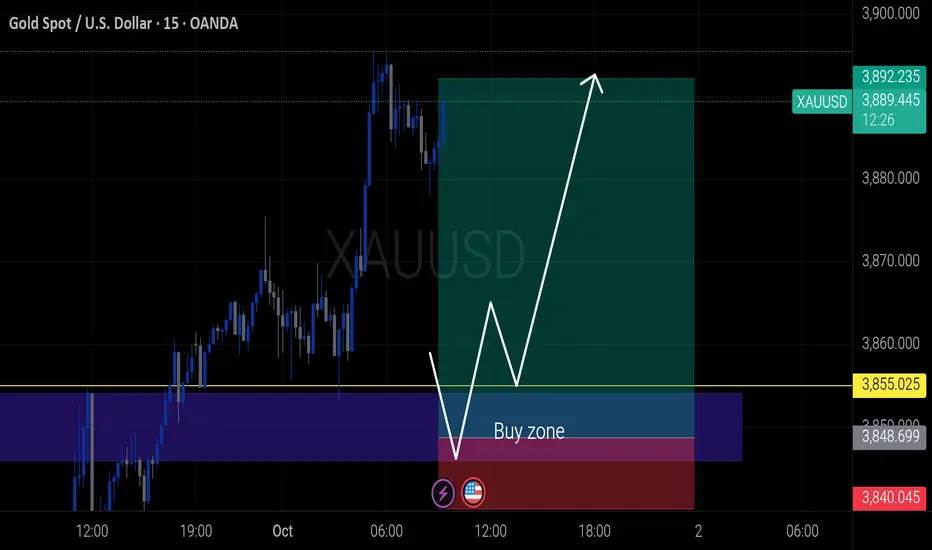
Price tapped into a strong demand zone near 3855, showing signs of a bullish reversal. Clean structure and potential for upside. Watch closely for confirmation and manage risk wisely.
#XAUUSD #GoldAnalysis #PriceAction #ForexTrading #SmartMoney #TechnicalAnalysis
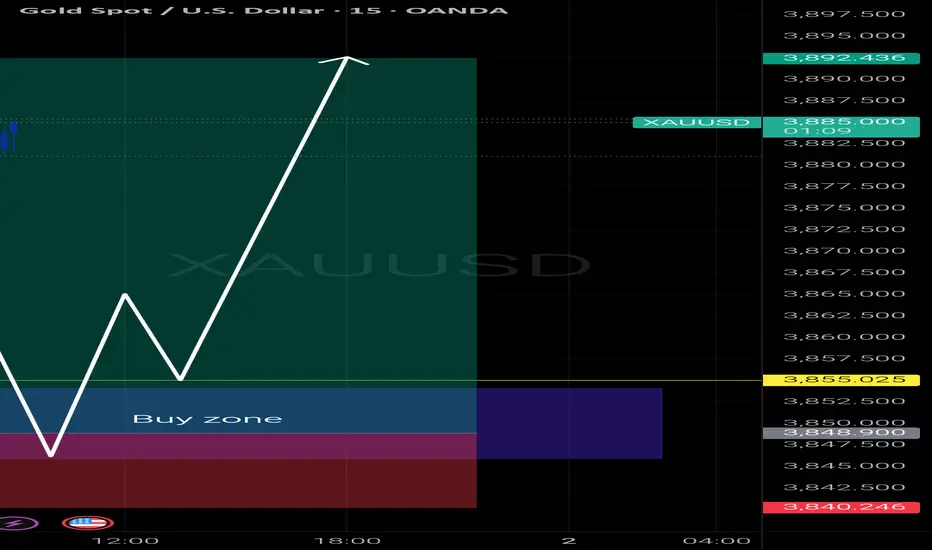
Gold Buy Setup – High Probability Reversal from Key Zone
Price tapped into a strong demand zone near 3855, showing signs of a bullish reversal. Clean structure and potential for upside. Watch closely for confirmation and manage risk wisely.
Short-term Bullish with Key Resistance Ahead📊 Market Overview
Gold is currently trading around $3,876.80/oz, after a strong rally in the previous session. Buying pressure remains stable as the USD shows signs of weakness, while safe-haven demand stays elevated. However, the market is cautious ahead of upcoming U.S. economic data releases.
📈 Technical Analysis
• Near-term Resistance: $3,885 – $3,895
• Strong Resistance: $3,915
• Near-term Support: $3,860 – $3,850
• Strong Support: $3,835
• EMA20 (H1): Price is holding above EMA20, indicating that the short-term uptrend remains intact.
• H1 Candlestick: Small-bodied candles suggest slowing bullish momentum, with potential for a technical pullback before resuming the trend.
📌 Outlook
Gold maintains a short-term bullish trend, but the $3,885–$3,895 zone will be a key challenge. A breakout above this level could drive price toward the psychological $3,900 mark and further to $3,915. Conversely, if profit-taking increases, price may retest the $3,860–$3,850 support zone.
🎯 Trading Strategy
🔺 BUY XAU/USD: $3,845 – $3,850
• 🎯 TP: 40 / 80 / 200 pips
• 🛑 SL: $3,840
🔻 SELL XAU/USD: $3,885 – $3,895
• 🎯 TP: 40 / 80 / 200 pips
• 🛑 SL: $3,900
Gold Futures Bullish Setup – Entry at Demand Zone1. Channel Formation
The price is moving inside a rising parallel channel (blue lines).
Recently, the price broke below the midline (dashed blue) of the channel, indicating short-term weakness.
2. Trade Setup: Long (Buy) Position
The chart indicates a bullish outlook, expecting a price reversal from the demand zone.
🔹 Entry Zone
Entry Price: ₹116,251 – ₹116,277
This is marked with a grey zone, which aligns with a support area and previous consolidation.
🔻 Stop Loss (SL)
Stop Loss Price: ₹115,705 – ₹115,729
Placed just below the lower boundary of the support zone to protect against a false breakout.
🎯 Target (TP)
Target Price: ₹119,331 – ₹119,338 (LABA target point)
This lies above recent highs and near the upper boundary of the channel, suggesting continuation of the bullish trend.
3. Risk-Reward Ratio
The blue shaded box indicates a reward zone.
The trade has a favorable Risk-Reward Ratio (RRR) > 2:1, which is considered a strong setup.
🧠 Interpretation & Strategy
The red curved arrow indicates expected price action: a short-term pullback into the demand zone, followed by a bullish bounce toward the target.
The structure suggests a buy-the-dip opportunity within an ongoing uptrend.
⚠️ Key Takeaways
Component Value (INR)
Entry Zone 116,251 – 116,277
Stop Loss 115,705 – 115,729
Target 119,331 – 119,338
Trend Bullish inside channel
Risk/Reward Favorable (>2:1)
✅ Conclusion
This setup represents a bullish continuation pattern. If price revisits the highlighted demand/support zone, and forms bullish reversal candles (e.g., hammer, bullish engulfing), it could offer a high-probability long entry toward the upper end of the channel near ₹119,338.

XAUUSD: The last bull run?FXOPEN:XAUUSD keeps grinding higher, but the structure suggests this may be the last impulse of the current move. I expect price to complete the advance into the large liquidity pocket at before a sharper correction, as upside momentum has started to fade.
You can read my previous analysis here:
CME flow shows heavy long-call positioning around 3867. A failure back below 3867 would likely open a deeper pullback.
That said, there is still a Margin Zone/liquidity pool at actively traded by CME participants, so price may push through 3867 toward before reversing.
Watch 3828 (prior session POC) — price can react and bounce from 3828 without visiting the deeper supports.
Key support: ,
Margin Zone:
Trading Plan
Sell: Look for strong sell signals from Quantum Vol-Delta on the M5/M1 timeframes inside .
Buy: If price pulls back into the key supports, wait for Quantum Vol-Delta to confirm buyers returning → Enter on the candle close.
Risk management:
Stop loss: below/above the most recent 5m timeframe swing low/high or beyond the respective support/resistance zone.
Move to break-even at +1R (R:R = 1:1).
Please like and comment below to support our traders. Your reactions motivate us to do more analysis in the future 🙏✨

Gold rebounds after a drop to $3794📌 Market Movement:
Today, gold sharply dropped to the $3794 level but quickly rebounded and is now trading around $3803. This indicates some dip-buying interest at short-term support, though selling pressure has not completely faded.
📊 Technical Analysis:
• Short-term support: $3794 – $3790
• Near-term resistance: $3810 – $3815
• EMA 50 on H1 remains an overhead barrier.
• The H1 candlestick shows a long lower wick, reflecting buying pressure at the lows.
🔎 Outlook:
Gold is consolidating in a narrow range after rebounding from $3794. If it holds above $3798, the recovery could extend toward $3810 – $3815. Conversely, a break below $3794 would bring back downside pressure.
🎯 Trading Strategy Suggestion:
• Prefer to stay cautious and wait for clear confirmation.
• BUY around $3794 – $3798 if price holds above support.
o TP: $3810 – $3815
o SL: $3790
• SELL if price fails to break $3815 and shows reversal signals.
o TP: $3800 – $3795
o SL: $3818

GOLD (XAUUSD): Updated Support & Resistance Analysis
Here is my latest structure analysis for Gold.
Horizontal Structures
Support 1: 3767 - 3793 area
Support 2: 3690 - 3736 area
Support 3: 3613 - 3644 area
Support 4: 3560 - 3580 area
Resistance 1: 3898 - 3902 area
Vertical Structures
Vertical Support 1: Rising trend line
Support 1 and Vertical Support 1 will compose an important contracting demand zone.
There will be a high chance to see a bullish movement from that.
❤️Please, support my work with like, thank you!❤️
I am part of Trade Nation's Influencer program and receive a monthly fee for using their TradingView charts in my analysis.

Gold Holds Near Record Highs, Eyes 3,870 Test📊 Market Overview:
Gold is trading around the record area of 3,867 as the US dollar weakens and expectations rise for the Fed to shift toward monetary easing. Concerns over slowing US growth and safe-haven demand continue to support prices.
📉 Technical Analysis:
• Key Resistance: 3,870 – 3,880
• Extended Resistance: 3,900 – 3,920
• Nearest Support: 3,840 – 3,830
• Extended Support: 3,800 – 3,790
• EMA09: Price remains above the EMA09 on H1, signaling short-term bullish bias.
• Momentum: RSI is overbought, suggesting a possible pullback before further upside.
📌 Outlook:
Gold may see a short-term pullback toward 3,840 before extending gains toward 3,880 – 3,900 if USD weakness persists.
💡 Suggested Trading Strategy:
🔻 SELL XAU/USD : 3,872 – 3,875
🎯 TP: 40 / 80 / 200 pips
❌ SL: 3,878
🔺 BUY XAU/USD: 3,838 – 3,835
🎯 TP: 40 / 80 / 200 pips
❌ SL: 3,832

Gold Hits New High at $3831 – Can the Rally Hold?📌 Market Overview
Gold (XAU/USD) surged today, marking a fresh high at $3831/oz, breaking well above previous resistance zones. The rally was fueled by expectations of a potential Fed policy adjustment, a weaker USD, and rising safe-haven demand amid ongoing financial and geopolitical uncertainties.
📊 Technical Analysis
• Key Resistance: 3831 (new high) – 3850
• Immediate Support: 3805 – 3790
• EMA 50 & EMA 200 (H1/H4): Both trending upward, confirming short-term bullish momentum.
• RSI (H1): Approaching overbought territory >70, signaling potential short-term correction.
• Chart Pattern: Strong parabolic rally, though vulnerable to a pullback toward support.
🧐 Outlook
The current uptrend remains supported by safe-haven flows and policy easing expectations. However, with gold posting new highs, profit-taking pressure may emerge near the 3830–3850 zone. A technical pullback to test support is a likely scenario in the short term.
🎯 Trading Strategy
• Cautious BUY: Consider buying on pullbacks toward 3805–3790, SL below 3785.
• Short-term SELL (scalping): Consider selling near 3830–3835, SL above 3840, short TP of 40–80 pips.
• Risk management is essential — avoid FOMO entries at the peak levels.

Gold Buy Setup – Buy the Dip Towards 3868 Target1. Trend:
Price is in a clear uptrend within a rising channel (highlighted in pink).
Currently, price is at the upper boundary of the channel, showing a potential short-term pullback before continuing higher.
2. Key Levels:
Entry Point: Around 3,766 – 3,765 (blue zone).
Stop Loss: Around 3,748 (below the channel support).
Target Point: 3,868 (top blue line).
3. Chart Pattern:
Price has formed a bullish flag/channel.
The projected move suggests a pullback to support (blue entry zone), then a bounce to the target area.
4. Risk-to-Reward Ratio:
Risk: ~18 points (from 3,766 entry to 3,748 stop loss).
Reward: ~100 points (from 3,766 entry to 3,868 target).
R:R ≈ 1:5.5, which is very favorable.
---
Trading Idea
Bias: Bullish (Buy setup)
Plan:
Wait for price to drop near 3,765 entry zone.
Place stop loss just below support at 3,748.
Target the upper zone around 3,868.
---
Summary
This chart shows a buy-the-dip strategy within an uptrend.
The plan is to enter near the channel support, with a tight stop loss, aiming for a continuation of the bullish move toward the target.
✅ Strong R:R setup
✅ Trend-following trade
⚠ Risk: If price breaks below 3,748, trend may reverse or consolidate deeper.

GOLD's Situation, A Comprehensive Analysis ! (XAUUSD)In my opinion, the price will rise to around $4000 and then enter a corrective wave. Currently, the price is forming the third upward wave, which I have estimated using technical analysis. These upward waves will continue up to around $4000, and after this rise, the price could decline toward the PRZ (Potential Reversal Zone). However, this price correction depends on the breakout of the wedge pattern.

XAUUSD targeting 3860 with the 1H MA50 supporting.Gold (XAUUSD) has entered a new Channel Up pattern by turning its 1H MA50 (blue trend-line) into Support.
The last time it formed such a pattern after a -2.00% decline was during September 19 - 23. Both fractals are identical in structure both in 1H MA50 and Channel terms.
The previous Channel Up eventually peaked a little above the 2.0 Fibonacci, which more than covers our 3860 Target. The pattern gets technically invalidated if the 1H MA50 breaks.
-------------------------------------------------------------------------------
** Please LIKE 👍, FOLLOW ✅, SHARE 🙌 and COMMENT ✍ if you enjoy this idea! Also share your ideas and charts in the comments section below! This is best way to keep it relevant, support us, keep the content here free and allow the idea to reach as many people as possible. **
-------------------------------------------------------------------------------
💸💸💸💸💸💸
👇 👇 👇 👇 👇 👇

Gold (XAUUSD) Technical Analysis 29/09/2025Gold is currently trading around the $3,800 zone, showing strong bullish momentum after breaking recent resistance levels. The market opened with upward strength, supported by safe-haven demand and a weaker dollar outlook.
🔎 Key Technical Levels:
Immediate Resistance: $3,815 – $3,825 (psychological barrier & intraday supply zone)
Major Resistance: $3,850 (weekly resistance, potential breakout level)
Immediate Support: $3,780 – $3,770 (intraday demand & 20 EMA zone)
Major Support: $3,740 (previous structure support & 50 EMA)
📈 Trend & Momentum:
Trend: Bullish above $3,780, but facing minor consolidation near $3,815.
Indicators: RSI hovering near 65-70, suggesting strength but slightly overbought conditions.
Moving Averages: Price trading above 20 & 50 EMA, indicating buyers in control.
⚠️ Outlook:
As long as Gold sustains above $3,780, the bullish trend remains intact with a potential target towards $3,850 – $3,870. A break below $3,770 could trigger correction towards $3,740.
💡 Bias: Short-term bullish, but traders should watch for rejection candles around $3,815 – $3,825 which could trigger intraday pullbacks.

XAUUSD Analysis todayHello traders, this is a complete multiple timeframe analysis of this pair. We see could find significant trading opportunities as per analysis upon price action confirmation we may take this trade. Smash the like button if you find value in this analysis and drop a comment if you have any questions or let me know which pair to cover in my next analysis.

Gold Price Analysis – XAU/USD Hits New All-Time High at 3812🌍 Market Developments
Gold prices continue to surge, reaching a new record high at $3,810/oz in today’s session. The rally is driven by expectations that the Federal Reserve will maintain a dovish policy stance, a weakening US dollar, and falling US Treasury yields. Safe-haven demand is also supported by ongoing geopolitical tensions and fears of a global economic slowdown.
📈 Technical Analysis
• Key Resistance: 3815 – 3825
• Immediate Support: 3785 – 3770, with deeper support at 3750
• EMA 50 & 100: both trending upward, confirming strong bullish momentum
• H1 and H4 candles show powerful upward momentum, though RSI is approaching overbought territory → possible pullbacks or short-term volatility
💡 Outlook
The primary trend remains bullish, but the sharp rally after setting a new record may trigger profit-taking around the 3815 – 3830 zone. As long as gold holds above 3770, the bullish bias remains intact.
🎯 Trading Strategy Suggestion
🔺 BUY XAU/USD : 3780 – 3777
🎯 TP: 40/80/200 pips
🛑 SL: 3773
🔻 SELL XAU/USD : 3817 – 3822
🎯 TP: 40/80/200 pips
🛑 SL: 3827

XAUUSD approaching buy zone!GOLD open with a gap, as past week it has broken out of the intial structure, with new market open has sown significant bullish price action. From daily price action, it is in long term uptrend. Current 15minute price is about to cross the daily support and 4h support which in turn could lead the price to bouce off and a good area for potential buy entry, however, would like to see the support been tested with longer ATR candle.
My SL in this entry would be 1.5ATR which is 91 pip in 15min which is well below the intraday support level.

GOLD (XAUUSD): More Growth is Coming?!
Gold was very bullish on Friday.
A formation of a buying imbalance candle accompanied by a confirmed
breakout of a significant intraday resistance suggest a strong bullish pressure.
With a high probability, the market will update the ATH again and will aim at 3800 psychological level.
❤️Please, support my work with like, thank you!❤️
I am part of Trade Nation's Influencer program and receive a monthly fee for using their TradingView charts in my analysis.

XAUUSD Analysis todayHello traders, this is a complete multiple timeframe analysis of this pair. We see could find significant trading opportunities as per analysis upon price action confirmation we may take this trade. Smash the like button if you find value in this analysis and drop a comment if you have any questions or let me know which pair to cover in my next analysis.

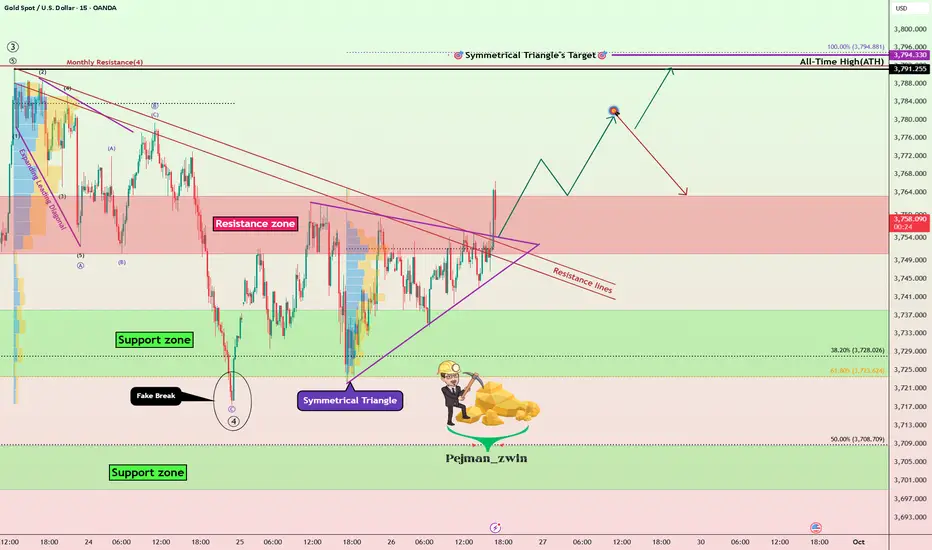
Gold Roadmap: Breakout Confirmed –New ATH or Another Correction?Gold ( OANDA:XAUUSD ) as I expected in the previous idea (Short and Long positions hit the target).
First of all, I should say that this analysis is for the short term and on a 15-minute time frame.
Gold seems to have managed to break the Resistance lines, Resistance zone($3,763-$3,750), and the upper line of the symmetrical triangle in the past few minutes.
I expect Gold to rise to at least $3,779, and then there are two scenarios for Gold: creating a new All-Time High, OR re-correcting.
Stop Loss(SL): $3,741.7
Please respect each other's ideas and express them politely if you agree or disagree.
Gold Analyze (XAUUSD), 15-minute time frame.
Be sure to follow the updated ideas.
Do not forget to put a Stop loss for your positions (For every position you want to open).
Please follow your strategy; this is just my idea, and I will gladly see your ideas in this post.
Please do not forget the ✅ ' like ' ✅ button 🙏😊 & Share it with your friends; thanks, and Trade safe.
XAUUSD Anlaysis todayHello traders, this is a complete multiple timeframe analysis of this pair. We see could find significant trading opportunities as per analysis upon price action confirmation we may take this trade. Smash the like button if you find value in this analysis and drop a comment if you have any questions or let me know which pair to cover in my next analysis.

Back to 3700 Before Breaking through 3800?Dollar remain strong from yesterdays fundamental's
A deep retrace t0 3700 would be appropriate before climbing up again.

Wave 5 is about to start – today just time your Buy right!📊 Wave Perspective
The market is still following the scenario of one more wave 5 increase.
It is expected that on Friday morning, the price may move around 3765 to confirm the continuation trend.
After confirmation, there will be 2 important zones to time your Buy for the big wave.
✅ Trading Plan
Zone 1: High Entry – Main Priority
Entry: 3749 – 3751
SL: 3746
TP: 3792
This is the first buying point, suitable for those who want to enter the wave early following the trend.
Zone 2: Backup Entry – Last Support
Entry: 3738 – 3736
Maximum SL: 3730
TP: 3792
This is a strong support zone, if the price breaks zone 1, this will be the "timing" zone to re-enter.
Note: Since this is a backup entry, reduce Lot size, widen SL a bit, and tighten SL when the price matches to optimize risk.
📌 Capital Management Note
Every order must comply with SL to avoid risks.
Prioritize entering orders according to the big wave plan, avoid FOMO.
EA setup: should be set to Only Buy according to the upward wave perspective.
Analysis perspective is for reference only, combine with personal view before entering orders.
🎯 Expectation
If the scenario is correct, the price may complete wave 5 at target 3792.
Upon reaching TP, partial take profit can be done to secure profits.
