XAUUSD: Continuation of the pullbackPrice failed to break the Asian session high at 3,753 (no candle close above it). As a result, a deeper correction is likely before any new advance. The pullback targets are , and if extended, .
📉 Analysis
Wait for an Easy Trend sell signal on a break below the trendline with big volume.
Key resistance: , .
Key support: , , .
📊 Trading Plan
Wait for an Easy Trend confirmation when price breaks the trendline to the downside on strong volume, first target is 3717.
Example (SIGNAL): On 15m timeframe, price breaks the trendline with high volume — enter on the candle close, with the stop below the most recent swing low.
Risk management: Place the stop above/below the nearest 5m swing high/low, move to break-even at 1R (R:R = 1:1).
Please like and comment to support our traders. Your feedback motivates us to produce more analysis in the future 🙏✨
Goldsignals

Gold Slightly Bearish, Sideway 3715 – 3755📊 Market Overview
Gold is trading around $3737 – $3740/oz. The USD strengthened slightly after strong U.S. data, but selling pressure on gold has weakened. The market is waiting for more signals from the U.S. session to determine a clearer direction.
📉 Technical Analysis
• Near Resistance: $3748 – $3755
• Major Resistance: $3765
• Near Support: $3722 – $3715
• Key Support: $3700
• EMA50 is still above price, keeping short-term pressure bearish, though sellers are losing momentum.
📌 Outlook
Gold is likely to continue ranging between $3715 – $3755. A break below $3715 could push prices to test $3700, where strong buying interest may appear.
🎯 Trading Strategy
🔻 SELL XAU/USD : 3755 – 3758
🎯 TP: 40/80/200 pips
🛑 SL: 3762
🔺 BUY XAU/USD : 3695 – 3700
🎯 TP: 40/80/200 pips
🛑 SL: 3692

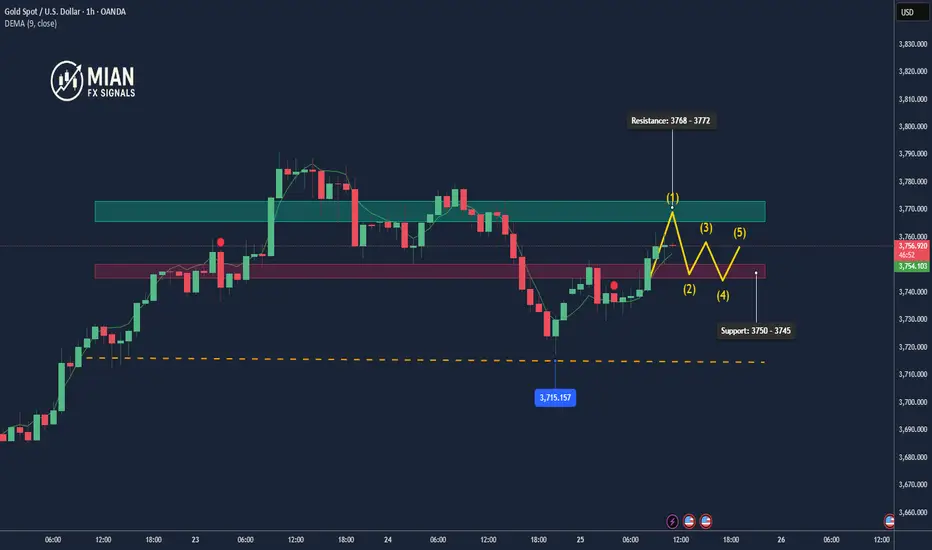
Gold rebounds but not yet clearly breaking out📊 Market Movement:
Gold touched 3761, then dropped to 3750, but has now rebounded to around 3757. The market is still fluctuating in a narrow range without a clear trend.
📉 Technical Analysis:
• Resistance: 3768 – 3772 (key zone to confirm buyers’ strength)
• Support: 3750 – 3745
• Short-term EMA: showing recovery momentum but not strong enough to confirm a bullish reversal
• Candlestick: leaning towards technical rebound, no clear breakout signal yet
📝 Outlook:
Gold is in a mild recovery phase, but it needs to break and hold above 3772 to confirm an uptrend. Failure here could trigger a pullback to 3750 – 3745.
🎯 Trading Strategy:
🔺 BUY XAU/USD : 3750 – 3745
🎯 TP: 40 / 80 / 200 pips
🛑 SL: 3742
🔻 SELL XAU/USD : 3768 – 3772
🎯 TP: 40 / 80 / 200 pips
🛑 SL: 3776
Gold's rise encountered resistance and launched adeep correctionGold maintains high-level fluctuations at the daily level, but the short-term trend shows weakness. The price on the 4-hour chart has fallen below the previous fluctuation range and is currently obviously constrained by the 3760-3770 pressure zone. The K-line continues to run below the short-term moving average. The overall structure shows a weak and volatile pattern. The recent rebound has approached the previous key pressure area. It is expected that the downward trend will most likely continue after the rebound repair is completed. Although a V-shaped reversal has formed in the smaller cycle, the price has stagnated near the pressure zone. The technical indicators show a top divergence signal, indicating that the short-term momentum is gradually weakening and there is a tendency to turn to adjustment again. The comprehensive technical aspect shows that gold faces downside risks in the short term. It is necessary to focus on the adjustment strength and the performance of the key support level below. The operation suggestion is to short on rallies. Focus on the rebound resistance of 3760-3770 on the top and the support of 3715-3700 on the bottom.

Gold Roadmap| Short-termGold ( OANDA:XAUUSD ) has been surprising everyone in the last few weeks, making new All-Time Highs(ATHs) every day.
Let me start by saying that this is a short-term analysis on a 15-minute time frame .
Technical analysis generally works worse when assets are creating ATHs . One reason for this is that there is no past history .
Gold has started to correct after the formation of the last All-Time High(ATH=$3,791.55) .
In terms of Elliott Wave theory , given the bullish momentum of Gold , it seems that the main wave 3 has been completed, and we should wait for the main wave 4 . It seems that the main wave 4 can be completed with a Zigzag Correction(5-3-5) .
I expect Gold to continue its downward trend to the Support zone($3,738-$3,723) , and then if we find a trigger for a Long position , we can ride the bullish wave of Gold again .
Note: If the Resistance lines are broken, we can expect a new All-Time High.
Note: If the Support zone($3,738-$3,723) is broken, we can expect a deeper correction.
Please respect each other's ideas and express them politely if you agree or disagree.
Gold Analyze (XAUUSD), 15-minute time frame.
Be sure to follow the updated ideas.
Do not forget to put a Stop loss for your positions (For every position you want to open).
Please follow your strategy; this is just my idea, and I will gladly see your ideas in this post.
Please do not forget the ✅ ' like ' ✅ button 🙏😊 & Share it with your friends; thanks, and Trade safe.

Gold hits 3,717 low – Short-term technical reboundMarket Overview:
Last night, gold dropped to a low of 3.717 USD/oz under strong selling pressure from the US market. Currently, it rebounds slightly to 3.736 USD/oz, indicating emerging bottom-buying interest.
Technical Analysis:
• Support: 3,717 / 3.723 USD
• Resistance: 3.740 / 3.750 USD
• EMA: EMA50 trending down; EMA200 above price, medium-term downtrend persists
• Candlestick pattern: Hammer candle observed at 3,717 low, signaling possible technical rebound
Outlook:
Gold may rebound short-term toward 3.740–3.750 USD if buying pressure holds, but monitor price reaction at 3,717–3.723 USD to confirm reversal or continuation.
Trading Strategy:
🔺 BUY XAU/USD : 3.718 – 3.715
🎯 TP: 40/80/200 pips
🛑 SL: 3.712
🔻 SELL XAU/USD : 3.750 – 3.753
🎯 TP: 40/80/200 pips
🛑 SL: 3.756

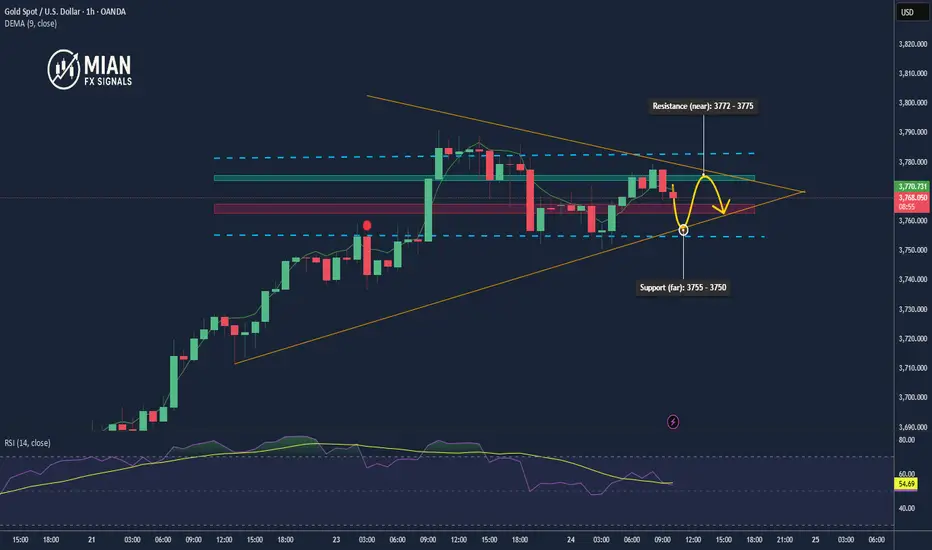
XAUUSD — Rebound or Short-Term Downtrend Continuation?Gold just flushed hard into the support zone, reinforcing 3790 as a temporary top. What should we do now?
📉 Analysis
Price is reacting at resistance; wait for price action here.
Scenario 1: A clean break above opens a recovery toward the next resistance zone around .
Scenario 2: A retest/rejection at leads to another leg down toward , after which the broader uptrend can resume. A liquidity sweep/stop-run into is possible before price turns higher.
Key resistance: ,
Key support:
📊 Trading Plan
Wait for an Easy Trend reversal signal with high volume on 5m when price taps the marked support/resistance zones.
Price is rolling under the trendline; wait for an Easy Trend signal on 5m with high volume to confirm entry.
Example (ENTRY): On 5m timeframe, price broke below the trendline and printed an Easy Trend sell signal with heavy volume, followed by a sharp drop.
Risk management: Stop above the most recent M5 swing high ; move to break-even at 1R (R:R = 1:1).

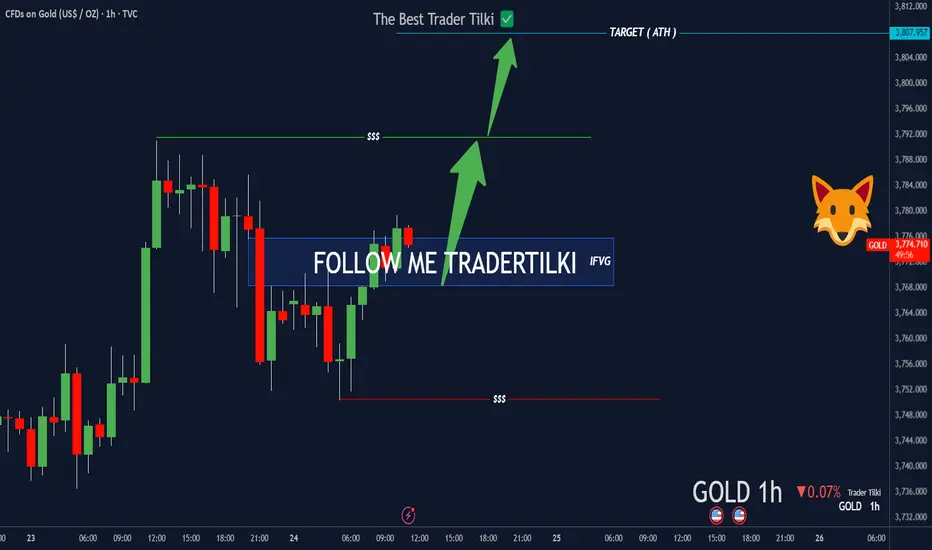
XAUUSD-Gold Game Just Changed: Post-FVG Violation SetupHey Traders,
Gold is currently sitting at 3774. From here, I’m aiming straight for 3807.
Why?
FVG got violated—we now have a clean IFVG.
That’s why my target is locked: 3807.
Set your stop-loss based on your own margin.
I believe we’ll hit that level sooner or later.
Every single like you drop keeps me motivated
to keep sharing these insights.
Big thanks to everyone supporting!
How to seize the certain opportunities in the gold market?Yesterday, gold continued its record-breaking rally, achieving its sixth consecutive week of gains and further entering an unknown price range. The core driving force behind this round of gains lies in the market's continued rise in dovish expectations for the Federal Reserve to further implement loose policies before the end of the year. Although the 25 basis point interest rate cut last week has been digested by the market, investors are increasingly expecting two more interest rate cuts in October and December, providing strong support for gold prices. In addition, ongoing geopolitical tensions, increased gold holdings by various countries and strong inflows of funds into gold ETFs have together constituted the multiple pillars of this bull market. Under the interweaving of risk aversion and loose expectations, gold has risen by more than 40% this year, highlighting its strong appeal.
From a technical perspective, the daily chart shows that gold prices closed with a large real body positive line, and the trend is extremely strong. The MACD indicator double lines sent a golden cross signal, confirming the short-term bullish trend. However, the indicator has deviated seriously into the overbought area, suggesting that there is a large risk of technical correction in the later period. Strategy analysis needs to focus on the support role of the MA5 moving average below. If it falls below, it may trigger a deeper adjustment. It is recommended to remain cautious in operation. You can consider light positions and try to arrange short orders on rallies. The upper resistance focuses on the 3780-3800 range, and the lower support is around 3745-3730. Although the current market trend is upward, we need to be vigilant against the risk of high-level corrections.
Is XAUUSD Setting for drop?there is reversal patter on GOLD with potenial previous daily support to break. Market may continue to drop to fill the dialy fair value gap followed by 4h fair value gap may lead the price to continue to drop to support level.

XAUUSD Analysis todayHello traders, this is a complete multiple timeframe analysis of this pair. We see could find significant trading opportunities as per analysis upon price action confirmation we may take this trade. Smash the like button if you find value in this analysis and drop a comment if you have any questions or let me know which pair to cover in my next analysis.

XAU/USD | GOLD Breaking Records – $4K Target Loading…!By analyzing the TVC:GOLD chart on the 1-hour timeframe, we can see that nothing seems to be stopping its series of new record highs — it almost feels like the $4,000 target isn’t too far away! Every small correction in gold is simply gathering more liquidity and demand to push toward higher levels.
At this very moment, gold has printed a new ATH at $ 3,734 , and I expect the rally to continue. The next possible upside targets are $3,740, $3,780, and $3,800.
THE MAIN ANALYSIS :
Please support me with your likes and comments to motivate me to share more analysis with you and share your opinion about the possible trend of this chart with me !
Best Regards , Arman Shaban

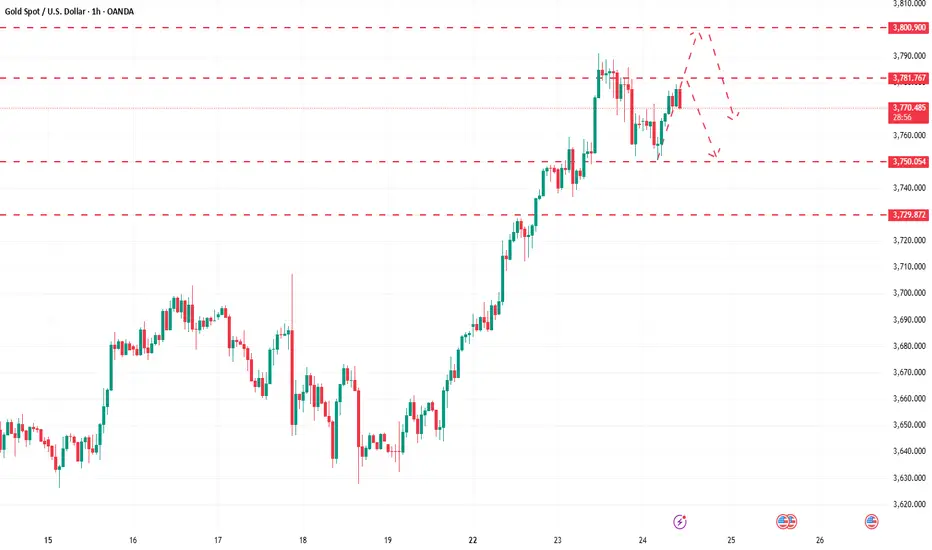
Gold breaks below 3770 – short-term correction signal📌 Market Developments:
Gold failed to hold the 3771–3774 area and dropped below 3770, now trading around 3768. This shows selling pressure has returned as buyers were not strong enough to break the 3778–3780 resistance zone.
📉 Technical Analysis:
🔺 Resistance (near): 3772 – 3775
🔺 Resistance (far): 3778 – 3781
🔻 Support (near): 3765 – 3762
🔻 Support (far): 3755 – 3750
📊 Short-term EMA is flattening as price moves back below 3770.
🕯️ H1 candles show strong selling pressure with long upper wicks and rising volume.
🧐 Outlook:
The main trend remains bullish, but gold is in a short-term correction after failing at 3778–3781. If 3765 breaks, price may continue to decline toward 3755 – 3750 before buyers step in again.
🎯 Trading Strategy:
🔺 BUY XAU/USD : 3755 – 3750
🎯 TP: 40 / 80 / 200 pips
🛑 SL: 3747
🔻 SELL XAU/USD: 3772 – 3775
🎯 TP: 40 / 80 / 200 pips
🛑 SL: 3778
Gold holds above $3765, bullish momentum continues📌 Market Overview
Gold is consolidating around $3765–$3768 after reaching another all-time high. Market sentiment remains bullish as expectations of Fed rate cuts persist, the USD weakens, and Treasury yields edge lower.
📊 Technical Analysis
• Near resistance: $3775 – $3785
• Additional (strong) resistance: $3800 – $3815
• Near support: $3755 – $3740
• Additional (strong) support: $3725 – $3710
• EMA 50 (H1): price remains above EMA, supporting the bullish bias.
• Candlestick pattern: rejection candles near $3755 show active buying demand.
• Momentum (RSI H1): stays above 60, no extreme overbought signals yet.
📝 Outlook
The main trend is still bullish, but the $3775–$3785 zone could trigger short-term profit-taking. As long as price holds above $3755, gold is likely to aim for $3800–$3815.
🎯 Trading Strategy
🔺 BUY XAU/USD : $3748 – $3751
🎯 TP: 40 / 80 / 200 pips
🛑 SL: $3743
🔻 SELL XAU/USD : $3781 – $3784
🎯 TP: 40 / 80 / 200 pips
🛑 SL: $3788

GOLD (XAUUSD): Intraday Bullish Signal
Gold looks very bullish this morning, forming a confirmed
Change of Character after a test of a key intraday horizontal support.
With a high probability, the price will rise more today and reach 3784 level.
❤️Please, support my work with like, thank you!❤️
I am part of Trade Nation's Influencer program and receive a monthly fee for using their TradingView charts in my analysis.

New High at 3791, Then Pullback📌 Market Movements:
Recently, gold prices set a new all-time high at $3791/oz before retreating slightly and are now trading around $3778/oz. The initial surge was driven by strong dip-buying and risk-aversion sentiment, but profit-taking pressure pulled prices back from record highs.
📉 Technical Analysis:
🔺 Resistance: 3791 (new ATH) and 3805
🔻 Support: 3770, followed by 3755
📈 EMA 50 on H1 remains below price, confirming short-term bullish bias
🕯️ H1 candles show long upper wicks near 3790–3791, signaling strong selling pressure at resistance
📊 Declining volume during the pullback suggests the market is waiting for the next breakout confirmation
🧐 Outlook:
The main trend remains bullish, but after touching 3791, gold needs consolidation to absorb selling pressure. Holding above 3770 keeps the door open for another test of 3791, aiming toward 3800–3805. A break below 3770 could push gold toward 3755 before any rebound.
🎯 Trading Strategy (Suggested):
🔺 BUY XAU/USD
• 📌 Entry: 3770–3773
• 🎯 TP: 3785 / 3795 / 3805
• 🛑 SL: 3765

Gold spikes to 3760 then pulls back to 3745 📊 Market Overview:
Gold surged to a new ATH at 3760 USD/oz, then dropped quickly to 3735 USD/oz on profit-taking. Currently, it trades around 3745 USD/oz, showing a tug-of-war between buyers and sellers.
📈 Technical Analysis:
🔺 Resistance 1: 3755 – 3760
🔺 Resistance 2: 3775
🔻 Support 1: 3735
🔻 Support 2: 3720
• EMA 50 (H1) still pointing upward → bullish bias intact.
• Last H1 candle with long upper wick → short-term selling pressure.
📝 Outlook:
Trend remains bullish, but 3755–3760 is a key resistance zone. If it fails to break, price may retest 3735 or even 3720.
🎯 Trading Strategy:
🔺 BUY XAU/USD : 3735 – 3738
🎯 TP: 40/80/200 pips
🛑 SL: 3732
🔻 SELL XAU/USD : 3775 – 3780
🎯 TP: 40/80/200 pips
🛑 SL: 3785

Gold breaks through strongly, seizing opportunities is the key!Gold continued its strong rally from last week yesterday, hitting new all-time highs, reaching a high near 3759, sending the market into a frenzy once again. Since its initial rise from 3311, the overall gain has reached nearly $450, a rare and impressive rise in recent years. However, amidst this upward trend, market sentiment is inevitably wary of rising prices.
From a technical perspective, bulls still have upward momentum, but a reversal could lead to a significant pullback. The previous pullback did not reach key support, so the correction remains limited. Short-term pressure is focused on the 3760 area, which is crucial for further gains in the European session. If the European session lacks momentum, the probability of new highs in the US session will decrease. Support below this level is around 3730, with the watershed still near 3700. A break below 3700 would signal the end of the bull market.
Therefore, for intraday trading, it is advisable to try to position yourself based on the initial top. While there are certain risks, the potential for blindly chasing long positions at this level is already limited. It is recommended that if gold touches around 3760-3765, you can consider placing short orders at the right time, and first look at the retracement space below.

GOLD (XAUUSD): Updated Support & Resistance Analysis
Here is my latest structure analysis for Gold.
Resistance 1: 3798 - 3802 area
Resistance 2: 3848 - 3852 area
Support 1: 3690 - 3707 area
Support 2: 3613 - 3643 area
Support 3: 3560 - 3580 area
Support 4: 3511 - 3532 area
Consider these structures for pullback/breakout trading.
❤️Please, support my work with like, thank you!❤️
I am part of Trade Nation's Influencer program and receive a monthly fee for using their TradingView charts in my analysis.

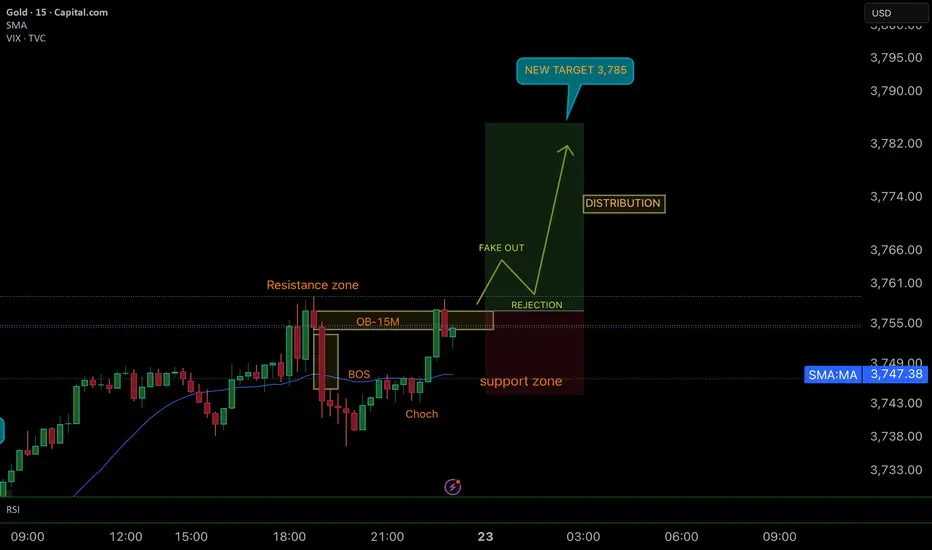
SMART MONEY CONCEPT (SMC)📊 Bullish SMC Analysis – GOLD
1. Resistance Break & Confirmation
Waiting for a clean breakout above the resistance zone to confirm bullish intention.
2. Liquidity Grab (Fake Out)
A fake out is expected after the breakout, designed to trap sellers and sweep liquidity.
3. Rejection Entry
Entry would be ideal at the rejection from the liquidity grab, aligning with institutional order flow.
4. Support Zone & Stop Loss
Stop loss is wisely placed below the support zone, giving the trade structure-based protection.
5. Targeting New Highs (HH)
Once rejection confirms, the momentum should aim toward new highs with the next target at 3,785.
✅ Conclusion: This plan is perfectly aligned with institutional footprints — waiting patiently for confirmation, entering on rejection, and protecting the position with a clean SL under support. Excellent setup for a high R:R trade. GOOD LUCK TRADERS ;)
Perfectly grasp the golden trading opportunity?Last Thursday and Friday, gold continued its range-sweeping pattern as expected. The market fluctuated too quickly, and hesitation basically meant missing out. However, frequent trading can also be a burden. We ambushed both the bulls and the bears in advance and reaped good profits.
For today's market, first of all, the gold daily chart combination is a typical "big sun front resistance line" pattern, which is an obvious lure to buy. As long as it does not break through the previous high of 3707, then today we tend to continue to be bearish. From a technical point of view, the high-level continuous negative adjustment state is obvious, and the rebound momentum is gradually weakening. The long upper shadow line of the daily line shows that the upper selling pressure is heavy, and the short-term bullish power is insufficient. The upper track of the Bollinger band in the 4-hour cycle is repeatedly under pressure, the MACD momentum column continues to shrink, and the fast and slow lines show signs of forming a dead cross, indicating that the rise is weak.
On the news front, the Fed's expected interest rate cut has been realized, and the realization of positive news has weakened the momentum for gold to rise further. The subsequent market focus will be on "whether there will be another interest rate cut and the extent of the cut." Uncertainty makes funds more inclined to take profits at high levels. At the same time, the US dollar index stabilized and rebounded, and US Treasury yields stopped falling, which continued to suppress gold.
At the level of funds and market sentiment, long positions are already at a high level, with limited room for growth. Institutions are more likely to overvalue and undervalue at high levels, and it is difficult for gold to maintain a sustained upward trend under the volatile pattern.
Therefore, in terms of operation, it is recommended to look for short opportunities below the previous high of 3707 today, especially above 3685, where short orders can be arranged in batches, positions can be strictly controlled, and stop-loss space can be enlarged to cope with fluctuations. The short-term target will first look at the 3670-3660 area. If it breaks down strongly, it will further look down to the 3650-3635 area.

Gold Pulls Back After Hitting $3726.5 High📌 Market Overview
Gold tested a new high at $3726.5 before retreating to around $3720. The market shows short-term profit-taking pressure, but the broader bullish trend remains intact.
📊 Technical Analysis
• Near resistance: $3725 – $3732 (recently tested zone).
• Major resistance: $3745 – $3750.
• Near support: $3712 – $3710.
• Major support: $3697 – $3690.
• EMA50 (H1): price pulling back toward EMA, suggesting a technical correction.
• RSI (H1): easing from overbought, now around 62.
🧐 Outlook
The primary trend remains bullish, but current movement suggests gold needs consolidation before extending higher. The $3745 – $3750 zone will be a critical resistance if momentum continues.
🎯 Trading Strategy
🔺 BUY XAU/USD : $3712 – $3715
🎯 TP: 40 / 80 / 200 pips
🛑 SL: $3705
🔻 SELL XAU/USD : $3745 – $3750
🎯 TP: 40 / 80 / 200 pips
🛑 SL: $3755

XAUUSD Analysis todayHello traders, this is a complete multiple timeframe analysis of this pair. We see could find significant trading opportunities as per analysis upon price action confirmation we may take this trade. Smash the like button if you find value in this analysis and drop a comment if you have any questions or let me know which pair to cover in my next analysis.
