Gold holds firm at $3680 – testing pressure toward $3725 resista📌 Market Overview
Spot gold is trading around $3691/oz, recovering from Asian session lows. Strong USD and high yields keep pressure on, but safe-haven flows are limiting the downside.
📊 Technical Analysis
• Near resistance: $3697 – $3707 (short-term ATH).
• Major resistance: $3725 – $3732.
• Near support: $3680 – $3670.
• Major support: $3658 – $3650.
• EMA50 (H1): price holding above EMA, keeping bullish bias intact.
• Candles: lower wicks near $3680 suggest strong dip-buying interest.
🧐 Outlook
Gold remains in a mildly bullish structure, but $3707 is key resistance. A rejection could push price back, while a breakout may target $3725.
🎯 Trading Strategy
🔺 BUY XAU/USD : $3682 – $3685
🎯 TP: 40 / 80 / 200 pips
🛑 SL: $3675
🔻 SELL XAU/USD : $3725 – $3730
🎯 TP: 40 / 80 / 200 pips
🛑 SL: $3735
Goldsignals

XAUUSD Week ahead analysis GOLD With FOMOC had a significant rejection to the daily 10ema which is complete break of strcutre of the daily trend. As higher timeframe monthly and weekly price is significantly bullish, at the endo the week see XAUUSD has rejected with a stong momentum and may continue to rise up to potentially all time high.
More in depth analysis has shown in this video

GOLD (XAUUSD): Rise to All-Time High Confirmed
There is a high chance that Gold will continue rising next week,
following a completion of a correctional movement on a 4H time frame
with a confirmed bullish Change of Character CHoCH.
Odds are high, that the price will rise to 3707 level,
with a highly probable update of ATH.
❤️Please, support my work with like, thank you!❤️
I am part of Trade Nation's Influencer program and receive a monthly fee for using their TradingView charts in my analysis.

Perfectly grasp the golden trading opportunity?Gold touched the pressure level near 3660-3370 several times during the day and then fell under pressure, which perfectly verified our strategic prediction. The continuous short selling at high levels has reaped great rewards. The current trend relies on the pressure of the 4-hour middle track. The short-term trend is still dominated by a volatile downward trend. The pressure focuses on the 3675-3685 area, and the support below focuses on the 3645-3630 area. From the technical structure, the middle track of the Bollinger band is obviously suppressing. If the rebound cannot break through the middle track pressure, the bears will still dominate the short-term rhythm. In terms of operation, it is recommended to maintain range thinking, enter and exit quickly at high altitudes and low prices, focus on grasping the rhythm, and lock in profits. Steady trading comes from early layout and strict execution. Patiently wait for signals from key positions and then enter the market decisively to seize profit opportunities in the volatile market!

Gold Breaks Out of Range, Targeting Higher Resistance📊 Market Developments:
After consolidating in the 3643–3658 range, gold has broken out, moving up to 3665 in the US session. The rally is supported by safe-haven flows as expectations grow for further Fed easing, while the USD shows signs of stabilizing.
📉 Technical Analysis:
• Key Resistance: 3672–3675 (a breakout could extend toward 3685–3692).
• Nearest Support: 3658 (the breakout level) — if successfully retested, it may turn into new support.
• EMA 09: Price is now above EMA09 → confirming short-term bullish momentum.
• Candles / Volume / Momentum: A strong H1 breakout candle with higher volume confirms buyer dominance.
📌 Outlook:
• Gold has exited the sideways range and is trending higher in the short term.
• Holding above 3658 keeps the upside bias intact toward 3672–3685.
• Downside risk only emerges if price falls back below 3658.
💡 Suggested Trading Strategy:
• BUY XAU/USD at: 3658–3662 (on a retest after breakout)
🎯 TP: 40 / 80 / 200 pips
❌ SL: 3654
• SELL short-term only if a strong reversal signal appears around 3675–3685.

Gold rebound encountered resistance, bears may exert force againGold continued its decline yesterday, extending the previous day's downward trend. It hit a low near 3633 before rebounding, peaking at 3672 before falling under pressure again. The US market quickly dipped to around 3627, another sign of bearishness. After breaking through the high, the upward move did not continue, but instead continued to rebound during the day, leaving room for short-term market volatility. Strong upward pressure currently persists around 3670, which also served as a barrier to yesterday's high. While prices have rebounded, the probability of reaching this level is low. A successful breakout could signal the end of the bearish correction. Yesterday, after initially reaching around 3660, the price quickly retreated. While the decline was limited, it provided a clear technical warning. Key support remains at 3620. If this fails, a direct drop below 3600, or even to around 3580, is possible. On the whole, the daily line is still biased towards a bearish retracement pattern. It is recommended to wait patiently for a pullback. If gold pulls back to the 3660-3670 area first, continue to arrange short orders on rallies, with the target first looking at the 3645-3630 area.

Gold After Fed Decision: Buy the Rumor, Sell the News?Gold ( OANDA:XAUUSD ) seems to have caught many traders by surprise, as many thought it would continue to create new daily All-Time High(ATH) with the Federal's interest rate announcement , but Gold followed the adage " Buy the rumour, sell the news ".
Gold started moving emotionally yesterday after the US interest rate announcement and made a new ATH($3,707.555) . Given the volume of yesterday's candle , it seems that Gold is having a hard time creating a new ATH.
Gold is currently breaking the Support lines , which is a sign of weakness in the bullish trend of Gold .
In terms of Elliott Wave theory , it seems that Gold has completed the main wave 5 and we should wait for corrective waves . Do you agree with me!?
I expect Gold to at least decline after the pullback of the Support lines to the First target($3,614) .
Second Target: $3,599
Third Target: $3,577
Stop Loss (SL) = $3,677
Note: To enter a short position, it is better to wait for an upward correction, but depending on the movement of gold and your strategy, you can open a short position.
Do you think Gold can create a new ATH anytime soon?
Please respect each other's ideas and express them politely if you agree or disagree.
Gold Analyze (XAUUSD), 1-hour time frame.
Be sure to follow the updated ideas.
Do not forget to put a Stop loss for your positions (For every position you want to open).
Please follow your strategy; this is just my idea, and I will gladly see your ideas in this post.
Please do not forget the ✅ ' like ' ✅ button 🙏😊 & Share it with your friends; thanks, and Trade safe.

How to operate the layout and don’t miss the golden opportunity!News: As expected, the Federal Reserve cut interest rates by 25 basis points on Wednesday and hinted at two more cuts this year, pushing gold to a record high above $3,700. The dollar's rebound from multi-year lows and rising Treasury yields have put some pressure on gold prices. The latest dot plot suggests another 50 basis point rate cut before the end of the year, but Powell expressed caution about the pace of rate cuts. The long-awaited moment has finally arrived. Despite persistently high inflation, the Fed has clearly shifted its policy focus to achieving full employment. The median forecast for the next two years indicates that the Fed plans to cut interest rates by 25 basis points each year. The forecast range for the end-2026 interest rate is 2.6% to 3.9%. Policymakers expect the unemployment rate to reach 4.5% in December this year and fall to 4.4% by the end of 2026. The market will then focus on Thursday's economic data, including US initial jobless claims and the Philadelphia Fed manufacturing index, as well as policy moves from the Bank of England and the Bank of Japan, which may cause short-term fluctuations in gold prices.
Gold Trend Analysis: Gold's bullish trend remains intact, and the overall outlook remains bullish, but there is still a risk of medium-term correction. Therefore, when trading, consider waiting for a pullback to go long. After the ups and downs of Monday, Tuesday, and Wednesday this week, gold has twice tested the 3707 high, only to experience significant pullbacks after both attempts. In particular, after the Federal Reserve's interest rate decision, market buying sentiment subsided, and gold fell to a low of 3645. Therefore, it is unlikely that gold will continue to rise in the short term, or even break new highs. Therefore, gold is likely to experience a period of volatile correction in the near term, and there is no need to overestimate the market after the interest rate decision.
From a technical perspective, the daily chart closed at a high level, but failed to break through the unilateral moving average support. Therefore, it is unclear whether gold will reverse its trend. At most, it is showing signs of weakening, forming a high-level consolidation. The key support level below is 3620. A break below 3620 and a series of daily declines, breaking through the unilateral moving average, would indicate potential for a significant decline. The H4 Bollinger Bands are currently converging, with the moving averages converging, indicating a very clear volatile trend. The support point between the lower Bollinger Band and the 60-day moving average is near 3635. Unless this level is broken, it will be difficult to pull the lower Bollinger Band apart, leading to a unilateral decline. Gold surged and then retreated, reaching a low near 3645. Therefore, support points below are very clear, with 3635 and 3620 as key support points. Assuming the overall trend remains unchanged, the principle of buying on dips to key support points is bullish. Focus on 3675, 3690, and 3710 above. Thursday and Friday are likely to see continued high-level fluctuations in the bullish trend.
Gold struggles within 3630–3675 range, awaiting breakout📊 Market developments
• Yesterday, gold rebounded from 3633 to test the resistance zone at 3675 but failed, then dropped sharply to a low of 3627.
• This morning, gold recovered from that low and is now trading around 3658–3660, showing that short-term buying pressure has re-emerged.
• A stronger USD and slightly higher U.S. bond yields after the Fed meeting continue to weigh on gold, while expectations of further Fed rate cuts in the coming months prevent deeper declines.
🧭 Technical analysis
• Near resistance: 3670–3675 (key short-term barrier, repeatedly rejected).
• Major resistance: 3700 (psychological level; only a breakout would confirm a new bullish leg).
• Near support: 3630 (yesterday’s low).
• Major support: 3600–3610.
• RSI on H1/H4 has rebounded from oversold levels, signaling potential for further recovery, though momentum remains weak.
📌 Outlook
• In the short term, gold is expected to consolidate within the 3630–3675 range.
• A breakout above 3675 could open the way toward 3700.
• Failure to break 3675 would likely send prices back to retest 3630, or even lower toward 3600.
🎯 Trading strategy
• Short-term SELL: around 3670–3675, SL above 3678, TP at 3640–3630.
• Speculative BUY: around 3630–3635, SL below 3627, TP at 3665–3675.
Gold fluctuations are under your control!After the gold interest rate decision, it went as we expected. Shorting near 3672, it first fell, and then going long near 3630 was bullish. The profit from this round trip was quite large.
First of all, looking at the current overall background, although the Fed has implemented an interest rate cut, the message it conveys is far from purely dovish. Powell's speech suggested that this action is not the beginning of a radical easing policy, but a prudent move to deal with economic uncertainty, especially the weakening labor market and stubborn inflation. According to data released by the U.S. Department of Labor on Thursday, the number of first-time applications for unemployment benefits in the United States in the week ending September 13 was 231,000, which was expected to be 240,000 and the previous value was 263,000. The data fell sharply from the abnormally high level of the previous week and returned to the normal range in the past four years.
From the perspective of gold technology, the 3670-3685 area can be regarded as the second top of the medium term. The bearish trend is established in the medium term first, and adjustments are made in conjunction with the overall short-term operation, with the main short position and the auxiliary long position. This rebound is regarded as a 4-hour adjustment to accumulate momentum and break through to open up more space. A weak closing can continue to be weak based on low consolidation. Missing the good position near 3670 does not mean that there is no position to participate in shorting. You can give yourself 1-2 times of tolerance in the face of the trend. As long as the direction is grasped, the final result will be profitable. This is very important.

GOLD (XAUUSD): Classic Pullback Trade
Gold may bounce from a key horizontal support.
As a confirmation, I spotted a breakout of a neckline of a double
bottom pattern after its test.
I expect a pullback to 3670.
❤️Please, support my work with like, thank you!❤️
I am part of Trade Nation's Influencer program and receive a monthly fee for using their TradingView charts in my analysis.

XAUUSDHello Traders! 👋
What are your thoughts on GOLD?
Gold pulled back after printing a fresh high and reacting to the latest FOMC meeting. It has since broken below key support and also violated its ascending trendline.
In the short term, price action is expected to remain range-bound to bearish, heading toward the next support zone.
As long as price remains below the broken trendline and resistance, the short-term bias stays bearish to sideways.
However, in the medium term, the overall outlook remains bullish, and a fresh upside wave may develop once the correction is completed.
Don’t forget to like and share your thoughts in the comments! ❤️

Gold rebounds, bears should not miss this opportunity!Did gold fall as we expected? Congratulations to those who have been paying attention. We have been emphasizing from the weekend, last weekend, until yesterday that the top of gold is just above the 3700 mark, and the extreme position is in the 3720-30 area. When the Fed cuts interest rates, gold will fall. We have been saying this over and over again. I don’t know if you have listened to us.
Gold, the release of yesterday's interest rate decision also made the market experience a shock. The large fluctuations back and forth without a bottom line also made the market abuse the bulls and bears wantonly. The trend was also quite magical, making the market defenseless and not giving the slightest chance. After a small rebound near 3694 when the news was announced, it began to dive rapidly, reaching the lowest point near 3652, and then quickly rose again to near 3707, and then continued to fall rapidly, reaching the lowest point near 3645. After the opening, it rebounded again at 3672 and continued to fall. The current lowest point was near 3634. A series of large-scale back and forth sweeps also made the market more fearful, and the daily line also closed in the form of a large negative line. The market is in a state of decline, directly breaking the support of the short-term moving average. It is currently hovering between the 5-day and 10-day moving averages. Therefore, due to the closing of yesterday's large negative line, it is relatively likely to start a pullback and repair again in the short term, and the effective support below is maintained at around 3630-3620. This area is also the key tactical defense we mentioned earlier. Once this position continues to be lost, the long and short positions may be reversed in the later period. The key pressure above is maintained at around 3675-3690. You can refer to this position to continue to short and wait. If gold rebounds to around 3675-3690 during the day, short it, and the target is around 3630-20.

Overestimate and undervalue, opportunities abound!The range operation ideas we shared have been verified to be correct again. We have perfectly grasped the market rhythm by going short first and then long. Congratulations to friends who are paying attention. After the US market, gold fell to the key support area of 3630-3620 and then rebounded quickly. At present, we continue to focus on the short pressure position of 3670-3690. This position is not only the pressure near the 5-day line, but also the upper pressure area of the hourly chart moving average band. In the short term, it may become the core area of the bull-bear game.
Although the interest rate cut has been implemented, the market focus has shifted to whether the pace and magnitude of future rate cuts will increase. The marginal benefits to bulls are weakening. Therefore, the short-term recommendation is still to sell high and buy low in the range, and not to chase highs and sell lows. If your recent operations are not ideal, or you want to make your investment more stable, you are welcome to communicate with me at any time, and I will help optimize the strategy.
From the 4-hour level, 3630-3620 is still the key defensive support level. If it falls below this area, the bullish and bearish pattern in the future market may change; and 3670-3690 is still a strong pressure. Strategically, we will continue to use this range as the core for long and short layout. In the middle position, we should watch more and do less, and wait patiently for the key points before entering the market to avoid unnecessary risks brought by frequent chasing orders.
Gold operation strategy: When it falls back to the 3630-3620 area, lightly arrange long orders, and first target 3660-3670. When it touches the upper pressure, you can gradually reduce the position and take profit to provide protection.

Gold Volatile After Fed, Rebounds to 3670📊 Market Developments:
• After the Fed’s 25 bps rate cut, gold surged sharply and hit a new all-time high at 3707.
• Strong profit-taking and a temporary USD rebound then dragged gold down to 3633 in the Asian session this morning.
• Currently, gold has rebounded to around 3670, showing buying demand returning after the sharp pullback.
📉 Technical Analysis:
• Key Resistance: $3700 – $3707 (new peak).
• Nearest Support: $3630 – $3635 (successfully tested this morning).
• EMA09 (H1): Price just bounced back above the short-term EMA, indicating a short-term recovery trend.
• Candlestick / Momentum: H1 candles printed a long lower wick around 3633 → signal of bottom-fishing demand. Momentum is recovering but resistance at 3700 remains tough, suggesting further choppiness ahead.
📌 Outlook:
Gold is in a highly volatile state following the Fed decision. Holding above 3660–3670 could trigger another test of the 3700–3707 resistance area. Conversely, a break below 3660 may drag gold back to retest 3630.
💡 Suggested Trading Strategy:
• SELL XAU/USD : $3702 – $3705
🎯 TP: 40 / 80 / 200 pips
❌ SL: $3708
• BUY XAU/USD: $3635 – $3638
🎯 TP: 40 / 80 / 200 pips
❌ SL: $3632
Gold consolidates around $3,660 after Fed’s rate cut decision🧭 Market Overview
Gold is currently trading around $3,660/oz after the Fed announced a 0.25% rate cut. Earlier, prices hit a new all-time high at $3,707/oz but quickly pulled back as the USD rebounded and profit-taking pressure increased.
📈 Technical Analysis
• Near Resistance: $3,675 – $3,700
• Key Support: $3,645 – $3,630
• EMA50 (H1): price is moving sideways around this level, indicating consolidation.
• Recent H1 candles show long upper wicks, reflecting selling pressure near $3,675.
• Trading volume has declined after the spike, suggesting the market is waiting for a new catalyst.
🧐 Outlook
• In the short term, gold is likely to consolidate – retrace within the $3,645–$3,675 range.
• The broader trend remains bullish, but a clear breakout above $3,675 on H1/H4 closes is needed to confirm further upside.
• A break below $3,630 would increase the risk of a deeper move toward $3,600.
🎯 Suggested Trading Strategy
🔺 BUY XAU/USD: $3,647 – $3,650
🎯 TP: 40 / 80 / 200 pips
🛑 SL: $3,643
🔻 SELL XAU/USD
Entry: $3,675 – $3,678
🎯 TP: 40 / 80 / 200 pips
🛑 SL: $3,681

Gold Faces Resistance – Possible Short-Term Correction📊 Market Drivers:
• Expectations that the Fed will cut interest rates have supported gold by lowering the opportunity cost of holding the metal.
• The US dollar tends to weaken amid signs of slowing economic growth, which supports safe-haven demand for gold.
• Geopolitical uncertainties and continued central bank demand also add upward pressure on gold.
📉 Technical Analysis:
• Key Resistance: ~ $3,700 – $3,720 / ounce; a strong psychological round number level drawing market focus.
• Nearest Support: ~ $3,660 – $3,645 / ounce; if this breaks, gold could test deeper support near ~$3,580.
• EMA: Gold is trading above the EMA50 in many analyses → medium-term trend remains bullish.
• Candlestick / Volume / Momentum: Signs of stalling near resistance; momentum could weaken if the USD firms up or if the Fed signals caution. Overbought RSI and momentum indicators could trigger a short-term pullback.
📌 View:
Gold may see a short-term pullback if it fails to break above the ~$3,700–3,720 resistance zone. If bearish catalysts emerge – such as a stronger USD or a hawkish Fed stance – gold could retreat towards ~$3,645–3,660 support.
On the other hand, a clear breakout above ~$3,700 could open the way towards ~$3,720 and higher.
💡 Short-Term Trading Strategy (Scalping before news):
• SELL XAU/USD at: 3688 – 3692 (near short-term resistance)
🎯 TP: 40 / 80 / 200 pips
❌ SL: 3695
• BUY XAU/USD at: 3672 – 3668 (near intraday support)
🎯 TP: 40 / 80 / 200 pips
❌ SL: 3665

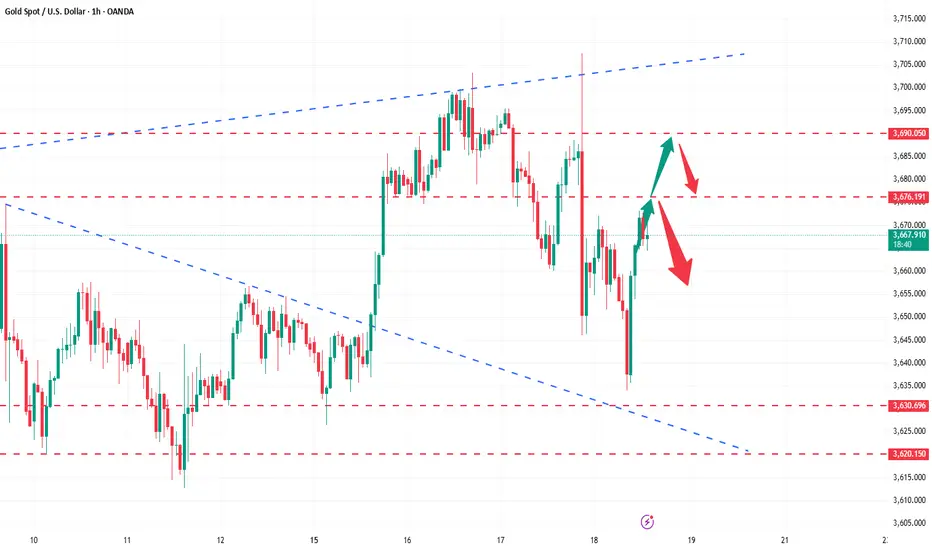
GOLD HAS DOWN TO 3.658 AFTER THE STRONG ZONE 3690 - 3700 📊Market Structure
🔤After the strong rally from 3640 → 3700, price has formed multiple BOS, confirming a bullish structure.
🔤However, upon tapping the supply zone 3690 – 3700, a bearish CHoCH appeared, pushing price back down to 3,658, signaling that sellers are currently in control in the short term.
🔤Unfilled FVGs and order blocks below remain as potential targets for price to mitigate.
💡Trade Plan
🔼Scenario 1 – Short with the short-term trend
Entry: 3680 – 3690 (Supply + FVG)
Condition: Wait for bearish reaction (CHoCH/BOS on M5–M15).
Reason: Market has shown a bearish CHoCH, and supply above is where sellers are aggressive → suitable for shorting with the short-term momentum.
🔼Scenario 2 – Long from deeper demand
Entry: 3635 – 3640 (Demand + FVG)
Condition: Look for bullish BOS on lower timeframe.
Reason: This is the main demand zone, with high probability for buyers to step back in.
🔽Scenario 3 – Break & Retest Short
If price breaks below 3650 with a strong candle → wait for a retest at 3650 – 3655 to sell again.
Reason: This shows weak buyers, and the market is targeting lower liquidity levels.
➡️ Short-term bias leans bearish, but the 3635 – 3640 zone remains the key decision point — whether price bounces back up or breaks deeper to the downside.

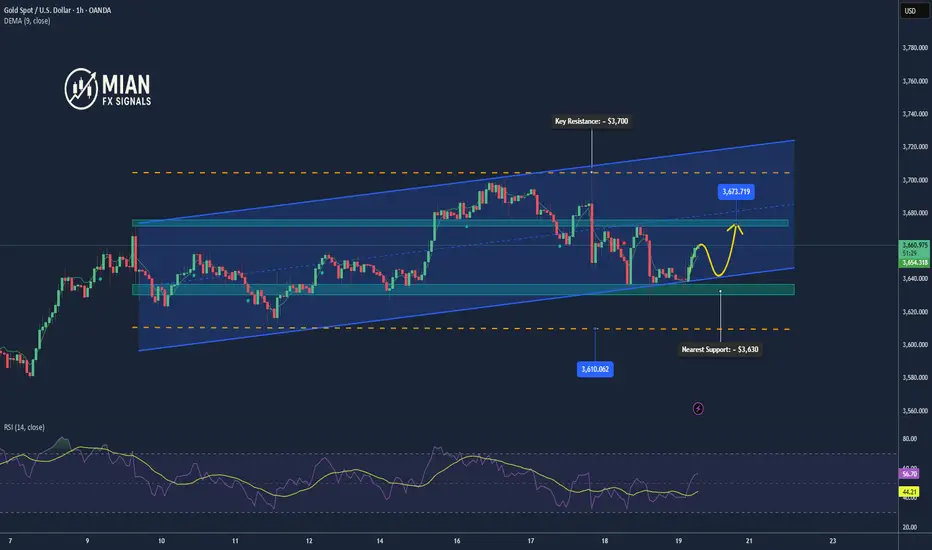
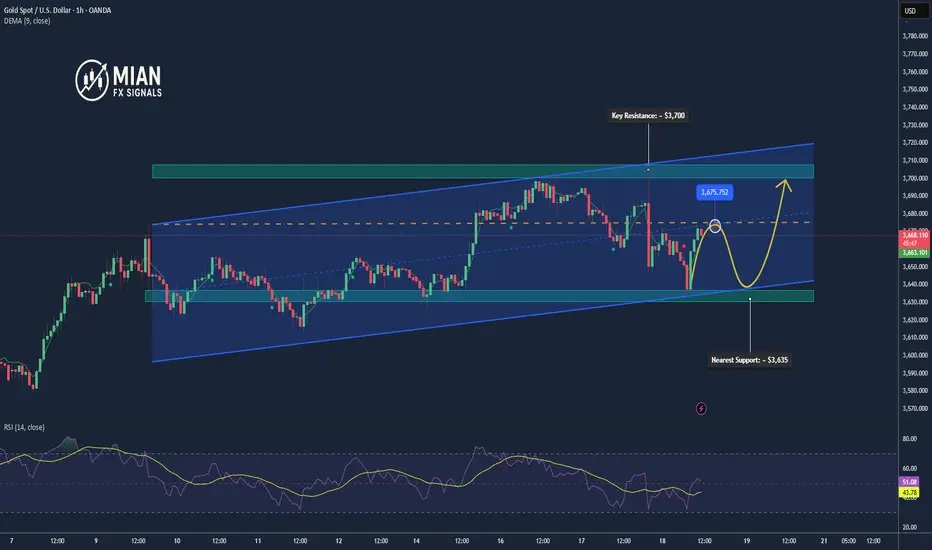
XAUUSD Analysis todayHello traders, this is a complete multiple timeframe analysis of this pair. We see could find significant trading opportunities as per analysis upon price action confirmation we may take this trade. Smash the like button if you find value in this analysis and drop a comment if you have any questions or let me know which pair to cover in my next analysis.

XAU/USD | Gold Prints New ATH at $3,685 – Rate Cut Rally Ahead?By analyzing the gold chart on the 1-hour timeframe, we can see that the price broke the key $3,657 level, just as expected, and today it even printed a new ATH at an impressive $3,685! As you know, this week is the interest rate decision week, and markets are preparing for a rate cut — either 0.25% or 0.5%. Each scenario can have a different level of impact: a 0.5% cut could easily push gold above $3,700–$3,740.
Right now, gold is trading around $3,679. As long as it does not break and close below $3,674, we can expect some sideways movement followed by more upside, with the first target at $3,700. However, there’s also an important FVG (Fair Value Gap) between $3,664 and $3,674. If the first scenario fails, gold could sharply drop to fill this gap.
I hope this analysis was helpful for you — stay tuned for more setups based on this outlook!

GOLD FALL TIME Lets Goo , Gold Selling Now
Reason SMT & BEARISH FVG
And Buy Setup Gold From OB / DEMAND ZONE
LETS GOO , HIGH PROBABILITY SETUP
FOLLOW US FOR MORE TRADES

Sinper entry on GOLD!While 0.25% rate putting pressure on dollar index, GOLD started pump since the beginning of the week which is a continuation of the longer term uptrending market strcutre.
As 4h closed with the dialy as narrow bullish doji, current session price just has broker out of the structure and potentially retesting the intraday support @3688.80 could bounce off the level expecting test again 3700 which previous daily high. Setting TP1 3692.27, TP2 3700.00

XAUUSD Analysis todayHello traders, this is a complete multiple timeframe analysis of this pair. We see could find significant trading opportunities as per analysis upon price action confirmation we may take this trade. Smash the like button if you find value in this analysis and drop a comment if you have any questions or let me know which pair to cover in my next analysis.
