Gold Pulls Back Short-Term After Hitting $3,673📊 Market Overview:
• Gold eased after touching $3,673, pressured by profit-taking and a slight rebound in the U.S. Dollar.
• Expectations of Fed rate cuts continue to support gold in the medium term, but near-term correction pressure is dominant.
• Geopolitical tensions and bullish forecasts of $3,800–$4,000 remain longer-term supportive factors.
📉 Technical Analysis:
• Key Resistance: $3,645 – $3,670
• Nearest Support: $3,600, further down $3,585
• EMA 09: Price is currently below EMA 09, signaling short-term bearish pressure.
• Candles / Momentum: After peaking at $3,673, gold formed a corrective sequence; RSI has cooled off from overbought, confirming selling pressure in the short term.
• Fibonacci Extensions: A breakout above $3,670 could open the way toward $3,697 and $3,725.
📌 Outlook:
In the short term, gold is likely to continue correcting toward $3,600 before buyers may step back in. A reclaim of EMA 09 and a breakout above $3,670 could extend the bullish move toward $3,697 – $3,725.
💡 Suggested Trading Strategy:
🔻 SELL XAU/USD : $3,670 – $3,673
🎯 TP: 40 / 80 / 200 pips
🛑 SL: $3676
🔺 BUY XAU/USD : $3,602 – $3,605
🎯 TP: 40 / 80 / 200 pips
🛑 SL: $3,599
Goldsignals

Gold swings violently after PPI data📊 Market Movement:
After the news, gold spiked to 3657 then quickly dropped to 3641. It is now recovering and trading around 3648, showing a tug-of-war between buyers and sellers.
🧭 Technical Analysis (H1):
• Resistance: 3652 – 3657
• Support: 3641 – 3638
• EMA20 is still pointing upward, but the strong wick candle shows high volatility.
• Break below 3641 → likely down to 3632 – 3628.
• Break above 3652 → likely retest 3660 – 3665.
📌 Outlook:
Gold is moving sideways in the 3641 – 3657 range.
🔻 Selling pressure is strong at the top.
🔺 Buyers are still defending around 3640.
👉 The next move depends on a breakout from this range.
Trading Strategy:
• 🔺 BUY: 3642 – 3645 | SL 3638 | TP : 40/80/200 pips
• 🔻 SELL: 3660 – 3657 | SL 3663 | TP : 40/80/200 pips
🟡 Focus on scalping within the range, wait for breakout to follow the bigger trend.

XAUUSD sell on pullbackXAUUSD has got strongly rejected from 3675.00 with one single move to level 3619.83 with break of structure, upon daily close, as with the higher timeframe it has started an uptrend. As price started pullback from the daily rejection, it is highly likely price continue to drop to daily support at 3619.83 or below. As 4h price approaching FVG we may find lower timeframe down trend with series of lower high and lower low.
Possible trade selling opportunity from 3640.00 to 3619.83

GOLD READY FOR FALL ! Ready To Fall The Gold !
It’s Enough ATH We Are Going To Drop Soon 3500 / 3400
Gold Respect The Resistance A Strong Resistance Its Now We Are Expecting Gold Bearish Momentum

Pay attention to the low-buying opportunities above 3630.Gold ultimately broke through the trendline, breaking out of its current high near 3657. During the European trading session, it fluctuated upward between 3648 and 3640. Therefore, if the price doesn't retreat below 3630 before the European session, the probability of an upward breakout will increase in this volatile upward trend. Therefore, the European session's lowest retracement near 3640 is a key bullish target for a second leg higher.
Gold operation suggestion: go long around 3640-3630, target at 3660-3675.

EUR/USD | Euro Rejected, Eyeing 1.168 & 1.166 (READ THE CAPTION)By analyzing the EUR/USD chart on the 4-hour timeframe, we can see that the price started to drop as expected, correcting down to 1.168. After that move, demand stepped in, and now the pair is trading around 1.1716.
If the price manages to stay below 1.174, we could see another bearish move. The possible downside targets are 1.168 and 1.166. Key supply zones are 1.174–1.178 and 1.179–1.1810.
Please support me with your likes and comments to motivate me to share more analysis with you and share your opinion about the possible trend of this chart with me !
Best Regards , Arman Shaban

How to correctly grasp the gold trading opportunities?Yesterday, the technical side of gold rose first and then fell. The overall gold price continued to rise strongly in the Asian and European sessions, and finally fell back in the U.S. session and fell into repeated fluctuations, and finally closed near 3628. The daily K-line closed at a high and then fell back and fluctuated in the middle. Yesterday, I kept notifying everyone that the technical side needed to retrace and not to be overly bullish on gold. Now everything is perfectly in line with expectations. Friends who follow me can see it. Today we continue to treat it with the idea of going long on retracements. After all, I believe that the trend has not reversed, and going long on retracements is still the general trend. Today, we will first focus on the short-term support at 3620-3610 below, and continue to go long if it retraces and does not break. If you encounter troubles in your current gold operations and want to make your investment journey more stable and avoid detours, please feel free to communicate with us at any time!
From the 4-hour level, today's short-term support for gold will focus on the 3620-3610 area, and the 3600 mark is the core dividing line between the strength of the bulls. If it retraces and stabilizes above this position during the day, the overall bullish thinking will remain unchanged. The main tone is still to go long on the retracement. At the daily level, as long as gold stabilizes above 3600, the low-long thinking will be sustainable. As for the counter-trend short positions, specific reminders will be given according to the pressure on the market at high levels. Brothers just need to pay attention to the bottom in time.
Gold operation strategy: Go long on gold when it retraces to around 3620-3610, target 3650-3660, and continue to hold if it breaks through.
Gold testing highs, possible pullback below $3,675📊 Market Overview:
Gold surged to an all-time high at $3,673.95/oz on September 9, 2025, driven by Fed rate-cut expectations, USD weakness, and strong central bank demand.
On September 10, gold is consolidating around $3,635/oz, with markets awaiting key US inflation data.
📉 Technical Analysis:
• Key Resistance: $3,675 – $3,700
• Nearest Support: $3,600 – $3,620
• EMA: Price remains above EMA 09 → bullish momentum intact.
• Candlestick / Volume / Momentum: Technicals still show Strong Buy signals, but overbought conditions suggest short-term pullback risk.
📌 Outlook:
Gold may pull back in the short term if sellers defend the $3,675–$3,700 zone, but a breakout above this level could trigger another rally toward $3,720–$3,750.
💡 Trading Strategy Suggestion:
🔻 SELL XAU/USD: 3697 – 3700
🎯 TP: 40 / 80 / 200 pips
🛑 SL: 3703
🔺 BUY XAU/USD: 3617 – 3620
🎯 TP: 40 / 80 / 200 pips
🛑 SL: 3614
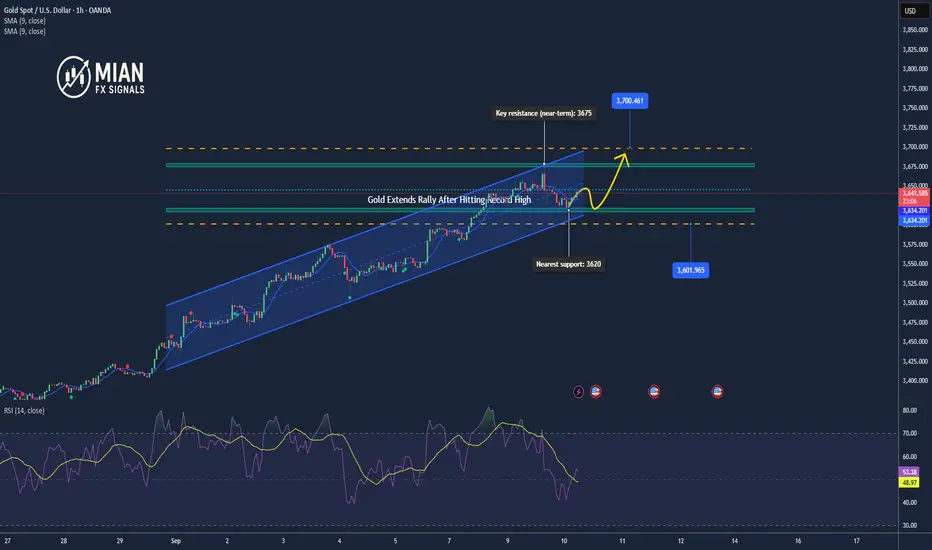
Gold Extends Rally After Hitting Record High📊 Market Overview:
Gold is holding at record highs, trading around $3,652/oz, supported by a weaker dollar, lower yields, and growing Fed rate cut expectations.
📉 Technical Analysis:
• Key resistance (near-term): 3650 – 3665
• Extended resistance (H1): 3690 – 3700
• Nearest support: 3640 – 3635
• Extended support (H1): 3615 – 3608
• EMA: Price is trading above multiple EMAs, confirming a bullish bias.
• Candles / Volume / Momentum: Momentum remains bullish; RSI on H1 is slightly overbought, suggesting potential for short pullbacks before continuation.
📌 Outlook:
Gold is likely to continue higher short-term if it holds above 3640. A breakout above 3665 could open the door to 3690 – 3700, with potential extension to 3725 – 3735. Conversely, a drop below 3635 may trigger downside pressure toward 3615 – 3585.
💡 Suggested Trading Strategy:
🔺 BUY XAU/USD: 3640 – 3643
🎯 TP: 40/80/200 pips
❌ SL: 3637
🔻 SELL XAU/USD : 3663 – 3666
🎯 TP: 40/80/200 pips
❌ SL: 3669

XAU/USD: Momentum Slows After New All-Time High, Correction LikeXAU/USD has reached a new all-time high within its established upward channel, but is now showing signs of price deceleration near the 3,660 resistance zone—a key area where bullish momentum appears to be fading.
The formation of smaller candles in this profit-taking zone signals exhaustion, and a potential rejection at this level could trigger a correction toward 3,590, with a deeper pullback toward 3,470 possible if sellers take control.
Structurally, the market appears to be completing an A-B-C correction from this extended zone, suggesting that a broader retracement phase may be unfolding before any renewed bullish continuation.

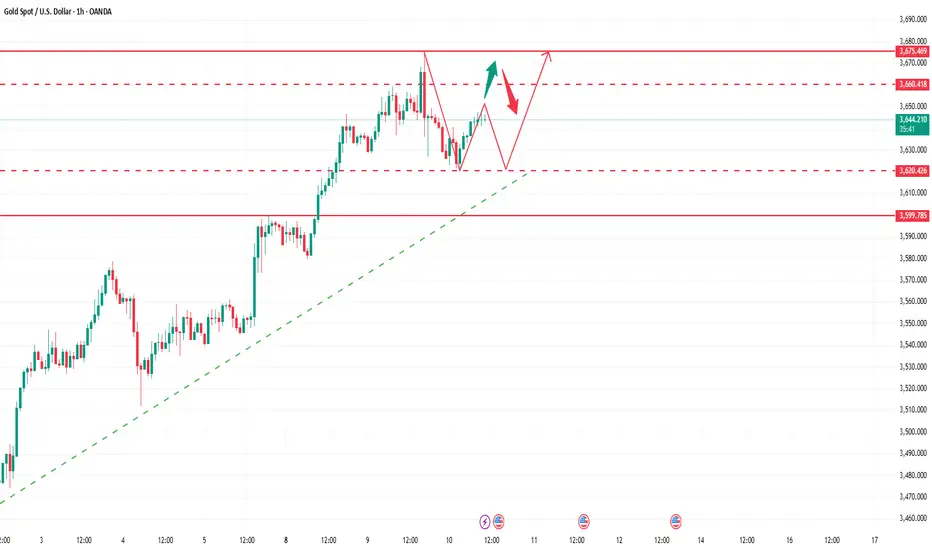
XAUUSD Stable uptrend eyes quick rise to $3695Gold (XAUUSD) has been trading within a short-term Channel Up on the 1H time-frame lately, fueled mainly by its 1H MA20 (red trend-line), with the 1H MA50 (blue trend-line) acting as the last Support.
Right now it is holding the 1H MA20 and as long as it does, we expect it to repeat at least a +1.87% Bullish Leg, similar to the last two. Our immediate Target is $3695.
-------------------------------------------------------------------------------
** Please LIKE 👍, FOLLOW ✅, SHARE 🙌 and COMMENT ✍ if you enjoy this idea! Also share your ideas and charts in the comments section below! This is best way to keep it relevant, support us, keep the content here free and allow the idea to reach as many people as possible. **
-------------------------------------------------------------------------------
💸💸💸💸💸💸
👇 👇 👇 👇 👇 👇

XAUUSD heading to 3700.00NFP week job data has fueled the long term uptrend on XAUUSD showing a possible trend continuation on GOLD. Multiple timeframe trend on XAUUSD is bullish with monthly, weekly and daily trend confirmation showing GOLD to potentially move back to the upside with a bullish channel creation.
It is a high probability that price may reject from the support level 3645.00 could be an important level for buy entry upon break of structure.

Gold hits new ATH at $3,657–Bullish momentum eyeing $3,675–3,690🟡 Market Overview
Gold extended its rally and just hit a new all-time high at $3,657/oz. The move is fueled by expectations of a Fed rate cut in September, weaker USD, and lower bond yields. Safe-haven demand remains strong as US labor data signals economic slowdown.
📉 Technical Analysis
• Resistance (near): 3670 – 3675
• Resistance (far): 3690 – 3700
• Support (near): 3640 – 3635
• Support (far): 3615 – 3605
• Price is trading above EMA20 and EMA50 on H1, confirming the bullish momentum. Strong volume at the 3650 breakout zone supports further upside.
📌 Outlook
Main trend: Bullish Gold could extend gains toward 3675 – 3690 as long as it holds above 3640. Short-term pullbacks may occur before continuation.
🎯 Suggested Trading Strategy
• BUY XAU/USD
Entry: 3645 – 3648 (after a pullback holding above 3640)
🎯 TP: 3670 / 3690
🛑 SL: 3630
• Short-term SELL (speculative, small size only)
Entry: 3672 – 3675 (near resistance)
🎯 TP: 3645
🛑 SL: 3678

GOLD outlook* Sell 📉 - 3653.6 to 3655.6 ( SL 3657.5 - low risk )
* Buy 📈 - 3632 to 3628.6 ( SL 3627 )

Xauusd Going to moonThis analysis shows Gold (XAUUSD) retesting its support trendline and forming a new support zone around 3530. As long as this level holds, the chart suggests a potential bullish move targeting 3578 and a new high zone near 3611.

Gold Holds Above $3,620 – Uptrend Strengthens📊 Market Overview:
Gold continues its rally, trading above the $3,600 psychological level, supported by strong safe-haven demand, growing expectations of a Fed rate cut, and ongoing geopolitical risks. Analysts, including Goldman Sachs, have even suggested potential upside toward $5,000/oz if confidence in Fed independence weakens.
📉 Technical Analysis:
- Resistance: $3,630 – $3,640
- Support: $3,600 (key psychological level)
- Indicators: MA, RSI, MACD, and STOCH all show strong bullish momentum, reinforcing the continuation of the uptrend.
📌 Outlook:
Gold remains in a bullish short-term trend. A clear breakout above $3,640 could open the path to $3,650+, while any pullback is likely to find strong buying interest near $3,600.
💡 Trading Strategy:
🔺 BUY XAU/USD near $3,607 – $3,610
🎯 TP: 40/80/200 pips
❌ SL: $3,604
🔻 SELL XAU/USD if price rejects $3,642 – $3,645
🎯 TP: 40/80/200 pips
❌ SL: $3,647

Gold Tests Key Reversal Zone – Bears on WatchGold ( OANDA:XAUUSD ) completed the move as I expected in my previous idea , both the down and up moves I expected.
Gold is currently moving in the Potential Reversal Zone(PRZ) .
Also, we can see the Regular Divergence(RD-) between Consecutive Peaks .
In terms of Elliott wave theory , it looks like Gold is completing the 5th microwaves of the main wave 3 .
I expect Gold to start correcting in the coming hours and drop to at least $3,593(First Target) .
Second Target: $3,583
Stop Loss(SL): $3,634
Gold Analyze (XAUUSD), 1-hour time frame.
Be sure to follow the updated ideas.
Do not forget to put a Stop loss for your positions (For every position you want to open).
Please follow your strategy; this is just my idea, and I will gladly see your ideas in this post.
Please do not forget the ✅ ' like ' ✅ button 🙏😊 & Share it with your friends; thanks, and Trade safe.

GOLD (XAUUSD): Updated Support & Resistance Analysis
As a bull run continues on Gold,
here is my updated support and resistance analysis.
Resistance 1: 3645 - 3655 area based on 3650 psychological level
Resistance 2: 3695 - 3705 are based on 3700 psychological level
Support 1: 3559 - 3580 area
Support 2: 3511 - 3520 area
Support 3: 3489 - 3500 area
The price is now heading toward Resistance 1.
It looks like it will be reached soon.
❤️Please, support my work with like, thank you!❤️
I am part of Trade Nation's Influencer program and receive a monthly fee for using their TradingView charts in my analysis.

Gold Roadmap | Short termGold ( OANDA:XAUUSD ) created a new All-Time High(ATH) almost every day this week.
How long do you think this upward trend in Gold will continue?
Reasons for Gold's upward trend this week:
Announcement of the US economic indexes.
Geopolitical issues that occurred in the world(China meeting, possible tension between Venezuela and the US, etc.)
Gold is currently moving between the Potential Reversal Zone(PRZ) and the Support zone($3,580-$3,572) .
In terms of Elliott Wave theory , Gold appears to be completing microwave 5 of the main wave 3 .
I expect Gold to start rising again from the Fibonacci levels and touch the Potential Reversal Zone(PRZ) .
Note: If Gold breaks the Support zone($3,580-$3,572) and Support lines, we can expect further declines.
Gold Analyze (XAUUSD), 15-minute time frame.
Be sure to follow the updated ideas.
Do not forget to put a Stop loss for your positions (For every position you want to open).
Please follow your strategy; this is just my idea, and I will gladly see your ideas in this post.
Please do not forget the ✅ ' like ' ✅ button 🙏😊 & Share it with your friends; thanks, and Trade safe.

XAUUSD Analysis todayHello traders, this is a complete multiple timeframe analysis of this pair. We see could find significant trading opportunities as per analysis upon price action confirmation we may take this trade. Smash the like button if you find value in this analysis and drop a comment if you have any questions or let me know which pair to cover in my next analysis.

Gold Extends Rally as Fed Rate-Cut Bets Intensify📊 Market Overview
• Spot gold is trading around $3,583–3,588/oz, close to its all-time high near $3,600.
• Main driver: Weak U.S. August jobs data boosted expectations for aggressive Fed rate cuts this month.
• A weaker USD and strong central bank purchases continue to support demand.
• Short-term outlook remains bullish, though overbought signals point to possible technical pullbacks.
📉 Technical Analysis
• Key Resistance: $3,600 (psychological), $3,620–3,625 (extended resistance).
• Nearest Support: $3,574 (Fibo 0.236), $3,560–3,580 zone.
• EMA: Price stays above EMA21 → bullish trend intact.
• Candlesticks / Momentum: Bullish flag structure; RSI >80 (overbought), suggesting possible pullback.
📌 Outlook
Gold may continue its upward momentum if Fed signals dovish policy and USD weakens further.
However, a technical correction is likely if profit-taking intensifies around $3,600–3,625.
💡 Suggested Trading Strategy
SELL XAU/USD: $3,622 – $3,625
🎯 TP: 40/80/200 pips
❌ SL: 3628
BUY XAU/USD: $3,577 – $3,580
🎯 TP: 40/80/200 pips
❌ SL: 3574

XAUUSD Analysis todayHello traders, this is a complete multiple timeframe analysis of this pair. We see could find significant trading opportunities as per analysis upon price action confirmation we may take this trade. Smash the like button if you find value in this analysis and drop a comment if you have any questions or let me know which pair to cover in my next analysis.

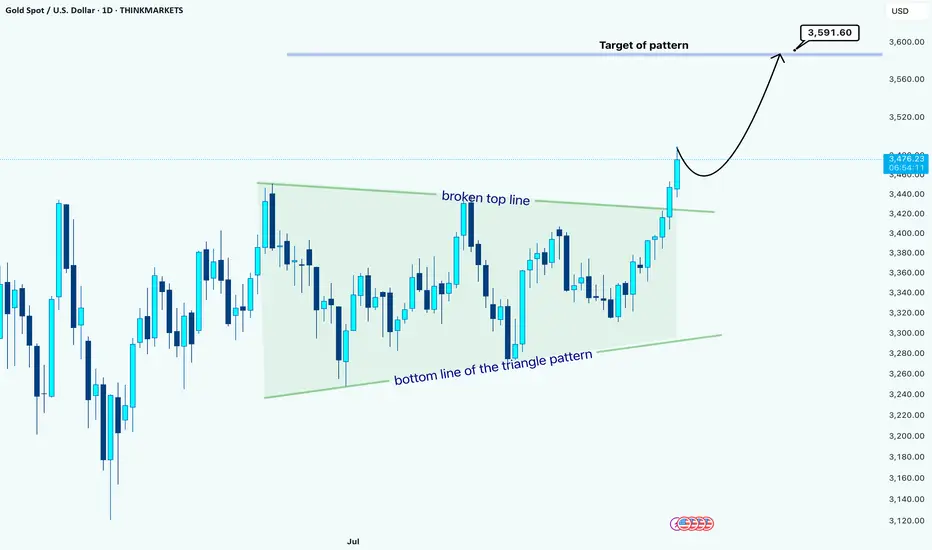
Gold Daily Chart Analysis –> Triangle BreakoutHello guys!
Gold has finally broken out of a large triangle consolidation pattern that has been building for weeks. The price action respected both the top resistance line and the bottom support line multiple times, showing clear compression before the breakout.
🚀 Recently, the price broke above the top line of the triangle, confirming a bullish breakout. This kind of move usually signals the start of a continuation phase with momentum in the direction of the breakout.
Based on the measured move from the triangle formation, the projected target sits around 3,591.60 USD. Price is currently trading near 3,476 USD, which still leaves room for further upside.
💡 Typically, after such a breakout, the market may retest the broken resistance line (now turned support) before resuming its move higher. (but the pullback is not certain now)
Summary:
Pattern: Symmetrical Triangle
Breakout Direction: Bullish
Current Price: 3,476 USD
Target: 3,591.60 USD
As long as Gold holds above the broken triangle resistance, the bias remains bullish toward the projected target.
Disclaimer: As part of ThinkMarkets’ Influencer Program, I am sponsored to share and publish their charts in my analysis.