XAUUSD Analysis todayHello traders, this is a complete multiple timeframe analysis of this pair. We see could find significant trading opportunities as per analysis upon price action confirmation we may take this trade. Smash the like button if you find value in this analysis and drop a comment if you have any questions or let me know which pair to cover in my next analysis.
Goldsignals

XAUUSD GOLD ANALYSIS What’s Moving the Market Today? 21NovemberOANDA:XAUUSD GOLD ANALYSIS What’s Moving the Market Today? (November 21, 2025)
Welcome back to Trade with DECRYPTERS, where we turn complex charts into clean buy & sell zones.
Keep it simple let levels guide your decisions.
*📰 Market Overview*
Gold is consolidating after failing to extend above the intraday reaction zone, hovering near $4,070–4,080 as the Dollar Index holds firm around 99.0.
A steady dollar, fading rate-cut expectations and slow macro flows all limit immediate upside.
Volatility remains muted as markets wait for PMI data and fresh signals from the Fed.
Buyers continue defending dips, but sellers are active in the higher scalp zones.
*Key fundamentals driving today’s move:*
📈 DXY steady near 99.0 → caps bullish momentum
🏦 Fed pause confirmed; December cut odds drop to ~22%
🌍 Geopolitical risks + tariffs continue supporting safe-haven demand
🏛 Central bank demand strong: +634t YTD, up 28% YoY
📊 ETF flows: Q3 +222t inflows, but November shows light outflows as investors book profits
*📆 What’s Ahead Key Events to Watch*
🔸 PMI – Nov 21
Manufacturing expected ~49 & Services ~51.
Weak PMI = increased cut bets → gold bullish.
Strong PMI = DXY bounce → gold dips toward lower zones.
🔸 FOMC Meeting – Dec 16
Markets price a clear pause (78%) but a dovish surprise could unlock upside toward 4,150+.
Hawkish language may trigger a sweep into deeper demand (3,978–3,962).
🔸 Geopolitical Risk Premium
Tensions in US–China, Mideast and Eastern Europe continue to keep gold supported.
Any escalation = instant safe-haven spike; calmness = DXY strength → gold softens.
*🟩 GOLD TECHNICAL LEVELS*
Price continues to respect the mid-range structure with buyers defending the lower band and sellers reacting strongly at intraday supply.
After testing 4032–4049 demand, gold pushed back toward 4070–4080, confirming buyers still active.
*🎯 EQUILIBRIUM (EQ): 4,065.00*
Hold above EQ = bullish intraday momentum toward 4,094 → 4,105 → 4,123
Stay below EQ = re-test lower supports 4,050 → 4,032 with possible deeper sweep later
*🟩 📌 SCALP BUY AREA: 4,032 – 4,050*
Strong demand zone lining up with CB/ETF accumulation areas.
Ideal for intraday dip-buys during low volatility windows.
First reaction zone for bullish setups, especially inside the astrology short window.
If this breaks cleanly, expect a fast move toward 3,978–3,962.
*🟥 📌 SCALP SELL AREA: 4,094 – 4,105*
Repeated rejection zone — sellers remain active here.
Perfect for fading rallies with tight stops above 4,110.
If volume breaks above it, momentum quickly shifts to 4,123+.
This zone forms the short-term ceiling of current consolidation.
*🔺 📌 BULLISH BREAKOUT LEVEL: 4,123+*
A confirmed breakout above this level flips structure bullish.
Targets extend toward 4,148 → 4,165.
Usually triggered by macro catalysts (PMI/FOMC/geo shocks).
Watch for fakeouts if volume is weak.
*🔻 📌 SMART MONEY BUY ORDERS: 3,962 – 3,978*
Deep liquidity pocket where institutions are loading positions.
Expect sharp V-shaped reversals if this zone is tapped.
Only comes into play on deeper corrections or heavy data surprises.
Reclaim above 4,000 from here = strong upward momentum.
*📌 CONCLUSION*
Gold remains locked in a tight range, respecting both demand and supply zones as the EQ at 4,065 continues to act as the true pivot for direction. Holding below it opens the path for a controlled dip into deeper demand, while any strong break above EQ can trigger a clean push toward 4,123+. With macro data and geopolitical risk still guiding sentiment, patience and level-to-level execution remain the winning edge. Stay focused, let price come to your zones.
Please support me with your likes & comments to motivate deeper daily analysis!
Share your charts and thoughts let’s grow together.
Best Regards,
M. MOIZ KHATTAK | Founder, TRADE WITH DECRYPTERS

XAUUSD set to retest weekly low?NFP positive data, has boosted DXY to existing bullish trend, as mirror effect on GOLD is continuing it's shorter term downtrend.
with back to back 2 daily doji at the weekly level, XAUUSD with today's Sydney session 4h closed with bearish engulfing candle with crossover of 10ema and 20ema signaling possible further drop.
Due to extended FVG below 4055.00 level, is price coming to retest weekly low?
Keep eye for more updates !

NFP positive data may push gold down?Hello traders, this is a complete multiple timeframe analysis of this pair. We see could find significant trading opportunities as per analysis upon price action confirmation we may take this trade. Smash the like button if you find value in this analysis and drop a comment if you have any questions or let me know which pair to cover in my next analysis.

XAU/USD | Gold Approaching Key Intraday Supply Zone! (READ)By analyzing the #Gold chart on the 4H timeframe, we can see that after dropping to 3998 dollars, price found strong demand and has now climbed back up to around 4050 dollars.
Keep an eye on the 4056–4064 zone for a potential SELL reaction, as this is a key supply area.
This analysis will be updated soon, and all important supply and demand zones are already marked on the chart.
Please support me with your likes and comments to motivate me to share more analysis with you and share your opinion about the possible trend of this chart with me !
Best Regards , Arman Shaban

GOLD ANALYSIS What’s Moving the Market Today? November 20, 2025OANDA:XAUUSD GOLD ANALYSIS What’s Moving the Market Today? (November 20, 2025)
Welcome back to Trade with DECRYPTERS, where we turn complex charts into clean, practical buy & sell zones that anyone can understand.
Our goal is simple: react to levels, not emotions.
Follow the zones, follow the structure the market will guide you.
*📰 Market Overview*
Gold slipped after failing to hold above $4,100, drifting back into the mid-range as the Dollar Index (DXY) pushes toward 100.15.
December rate-cut expectations have cooled to around 50%, reducing bullish momentum for metals.
Markets remain fragile with data uncertainty, Fed division, and global tensions all contributing to volatility.
*Key Drivers Behind Today’s Move:*
📈 DXY Strength → A stronger dollar limits upside for gold.
🏦 Fed Minutes Split → Policymakers prefer a “wait & watch” stance, keeping gold range-bound.
📉 Shutdown Data Gaps → Missing CPI/NFP prints create unpredictable volatility bursts.
🌍 Geopolitical Tensions → US–China, Mideast and Ukraine-Russia keep safe-haven flows alive.
🏛 Central Bank Demand → Q3 +220 tonnes; Poland & Kazakhstan leading accumulation.
📊 ETF Flow Behavior → After a record +222t Q3 build, November shows slight outflows but AUM stays near all-time highs — meaning investors are still holding heavy gold exposure.
*📆 What’s Ahead — Key Events to Watch*
🔸 FOMC Meeting – Dec 9–10
Rate cuts remain a coin toss. A surprise hawkish stance could pressure gold quickly, while a dovish tone fuels moves toward upper ranges.
🔸 CPI / NFP Drop After Shutdown Delay
With imputed CPI around ~3.0% core expected, any surprise deviation triggers instant volatility.
Clustered data releases = strong intraday whipsaws.
🔸 Geopolitical Risk Premium
Escalations boost gold instantly.
Calm periods = USD strength and pressure on metal prices.
*🟩 GOLD TECHNICAL LEVELS*
Gold pulled back toward $4,050, but buyers are still active above the $4,000 handle.
The chart currently shows a controlled range with liquidity on both sides — a perfect environment for level-based trading.
*🟩 📌 BUY AREA: 4,005 – 4,028*
Strong accumulation zone where previous demand stepped in.
If price taps into this region, expect sharp rejections and bullish reaction candles.
This zone remains valid as long as gold does not break below $4,000.
Best area for swing & intraday long setups.
*🟥 📌 SELL AREA: 4,107 – 4,121*
This is your first reaction zone previous rejections, wick prints, and liquidity sweeps occurred here.
Expect immediate resistance on first touch.
Ideal short-term scalp sell region unless a clean breakout occurs.
Break above → opens room toward 4,150.
*📝 CONCLUSION*
Gold is playing a tight game between demand at 4,005–4,028 and selling pressure at 4,107–4,121, with EQ hovering near the mid-range.
Holding below EQ favors a deeper pullback into the buy zone, while a clean reclaim above EQ shifts momentum toward 4,148–4,165.
Until CPI/FOMC hits, gold remains range-bound with controlled volatility.
If gold close above 4100 we can see it to 4180
Stay patient.
Follow the levels.
Let the market hit your zones not your emotions.
🙌 Your Support Matters
Please support this analysis with your likes & comments it helps motivate me to share more detailed insights with you.
Feel free to drop your charts & views in the comments. I always reply!
Best Regards,
M. MOIZ KHATTAK | Founder – TRADE WITH DECRYPTERS

Gold Resistance Rejection: Is the Next Leg Down Starting?Gold ( OANDA:XAUUSD ) has touched its upside targets as I expected in my previous idea .
Gold is currently trading near the Resistance zone($4,192 – $4,133) .
In terms of Elliott Wave theory, it appears that Gold is completing a Double Three Correction(WXY) .
I expect Gold to drop to at least $4,049 after breaking the Support lines .
First Target: $4,049
Second Target: $4,009
Stop Loss(SL): $4,192
Points may shift as the market evolves
Please respect each other's ideas and express them politely if you agree or disagree.
Gold Analyze (XAUUSD), 1-hour time frame.
Be sure to follow the updated ideas.
Do not forget to put a Stop loss for your positions (For every position you want to open).
Please follow your strategy; this is just my idea, and I will gladly see your ideas in this post.
Please do not forget the ✅ ' like ' ✅ button 🙏😊 & Share it with your friends; thanks, and Trade safe.

The Arena of XAUUSD-GOLD: New Round BeginsMy friends, Good Morning,
I have prepared a gold analysis for you in a swing trading structure.
The timeframe of this analysis is 4 hours.
In my XAUUSD-GOLD analysis, I will open sell positions between 4124.0 and 4176.0.
My targets are: TP1 - 3995.0 and TP2 - 3969.0.📊
This analysis is purely for your information.
To my friends who support each of my analyses with their likes,
I share these analyses thanks to your likes, because every single like from you is my greatest source of motivation to keep posting.
I sincerely thank all my friends who leave a like. 🙏
With respect and love.❤️

4161 OR 3928 ?By examining the gold chart on the 4-hour timeframe, you can see that the price touched the 4112 range exactly according to our previous analysis, and even advanced to 4132, and in the same range, it faced heavy selling pressure and fell to 4055. Currently, gold is trading at channel 4072. If it can consolidate itself above the important range of 4046 until the last working hours of the day, we can expect another growth to 4132 and even 4161. Scenario 2 = If it can break the resistance of 4046 and its bottom is consolidated, we can expect a fall to 4002 and even 3928.
با بررسی چارت طلا در تایم فریم 4 ساعته مشاهده میکنید که قیمت دقیقا طبق تحلیل قبلی ما محدوده 4112 رو لمس کرد و حتی تا 4132 پیش رفت و در همان محدوده با فشار فروش سنگینی مواجه شد و تا 4055 ریزش کرد .
درحال حاضر طلا در کانال 4072 درحال معامله می باشد.
اگه بتونه خودشو تا آخرین ساعات کاری روز بالای محدوده مهم 4046 تثبیت کنه میتونیم انتظار رشد دوباره تا 4132 و حتی 4161 داشته باشیم.
سناریو دوم = اگه بتونه مقاومت 4046 رو بشکنه و زیره اون تثبیت بشه انتظار ریزش تا 4002 وحتی 3928 ام میتونیم ازش داشته باشیم.
ریسک فری فراموش نشه دوستان.

Gold NY Session Strategy 11/19: Will up to 4162 Gold Daily Plan – SMC Outlook (Nov 20)
Framework: CHoCH – BOS – FVG – POI – Premium/Discount Model
1. Market Context
Gold continues to recover after the sharp drop earlier this week. Price is now approaching the Premium zone of the current bullish swing and tapping into H1 supply. The market shows:
Buyers still in short-term control
Momentum weakening as price reaches resistance
A corrective pullback into Discount is likely before any further expansion
2. Structural Overview (SMC Logic)
🔻 Overall Market Structure
A key BOS formed around 4090–4100 → confirms short-term bullish structure
Follow-up CHoCH signals continuation of the intraday uptrend
Price is moving toward the upper FVG + Supply Zone (4160–4162)
🔸 Orderflow Notes
Strong reaction at the 4140 area → clear presence of passive Sell Limit absorption
Demand POI at 4091–4089 held exceptionally well → main bullish mitigation zone
3. Trading Zones (POI)
✅ BUY Zone (Discount Area)
4091 – 4089
Demand + previous CHoCH + fib 1.272 confluence
Ideal low-risk long setup within Discount
Suggested SL: 4087
BUY Scenario:
Price retraces to POI → shows bullish reaction → long toward Premium.
❗️ SELL Zones (Premium Area)
Aggressive Sell Zone:
4143 – 4145
SL: 4147
Optimal Sell Zone:
4160 – 4162
Major supply + imbalance + fib 2.618 extension
Highest probability for reversal
SL: 4165
4. Trade Scenarios
📌 Primary Scenario (High Probability)
Price retraces into 4091–4089 Demand
Look for CHoCH/BOS confirmation on lower timeframe
Enter BUY → target 4143 → 4160
→ Classic SMC model: Buy from Discount → Sell from Premium.
📌 Alternative Scenario
If price rallies straight into 4143–4162 without retracement:
ONLY enter SELL when a clear bearish CHoCH or strong rejection forms
Target: 4100 → 4090
5. Intraday Bias
→ Bullish in Discount zones – Bearish in Premium zones.
Trade based on orderflow → Do not chase price in the middle range.
6. Summary
BUY: 4091–4089 (SL 4087) → TP: 4140 – 4160
SELL:
• 4143–4145 (SL 4147)
• 4160–4162 (SL 4165)
Wait for confirmation at each POI; avoid mid-range entries.

Gold Breaks Higher to 4,105 – New Bullish Momentum Confirmed📊 Market Overview
Gold has surged strongly from the 4,084 zone and decisively broke through the 4,102–4,104 resistance area, now trading around 4,105 USD/oz. The rally is supported by a slightly weaker USD, steady U.S. yields, and strong technical buying after the breakout. Buyers are clearly in control.
📉 Technical Analysis
• Nearest Resistance: ~ 4,110 USD/oz
• Additional Resistance: ~ 4,120 USD/oz
• Extended Resistance: ~ 4,135 USD/oz — target if bullish momentum continues.
• Nearest Support: ~ 4,102 USD/oz — fresh breakout zone.
• Additional Support: ~ 4,095 USD/oz — safe pullback level.
• Extended Support: ~ 4,084 USD/oz — key pivot before the rally.
• EMA09: Price is trading well above EMA09, confirming a short-term uptrend.
• Candles & Momentum:
• Strong bullish candles with solid volume → momentum remains strong.
• No significant rejection candles yet → trend remains intact.
📌 Outlook
Gold shows clear bullish momentum after the breakout.
• Holding above 4,102 may lead price toward 4,110 → 4,120, and potentially 4,135 next.
• Only a drop below 4,095 would signal risk of a deeper pullback toward 4,084.
💡 Trade Strategy Suggestions
🔺 BUY XAU/USD
Entry: 4,102 – 4,105 (post-breakout pullback)
🎯 TP: 40 / 80 / 200 pips
❌ SL: 4,098
🔻 SELL XAU/USD (Only with clear rejection)
Entry: 4,118 – 4,121
🎯 TP: 40 / 80 / 200 pips
❌ SL: 4,125

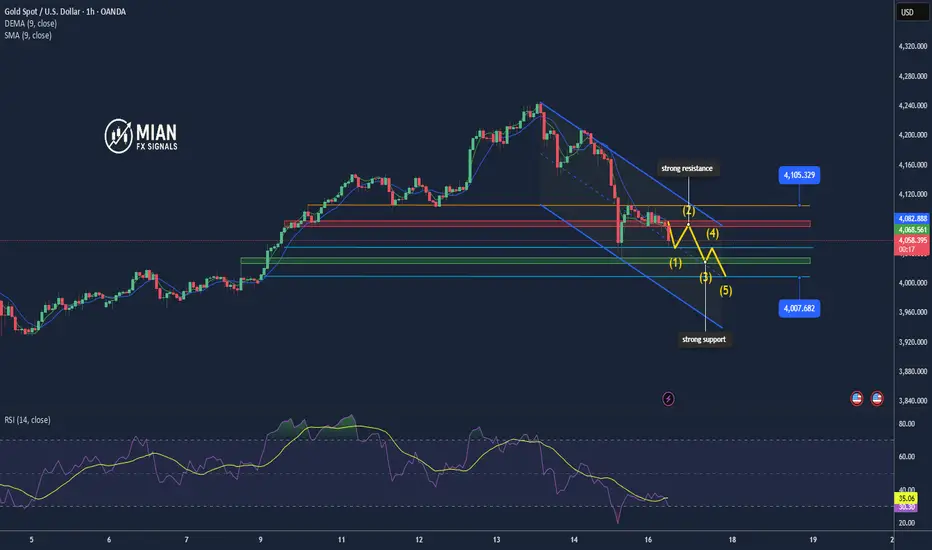
Gold Roadmap => Short-termGold ( OANDA:XAUUSD ) is currently moving below the Support zone($4,053 – $4,025) , but given the cluster of supports ahead , we can consider this beak is a fake break .
From an Elliott Wave perspective, it seems that gold has completed its wave 5 near the support lines , and we can anticipate a corrective upward movement .
Also, we can observe positive Regular Divergence (RD+) in consecutive valleys.
I expect Gold to rise to the Resistance zone($4,125 – $4,097) in the next step after breaking the Resistance lines and confronting the $4,073 level .
First Target: $4,091
Second Target: $4,113
Stop Loss(SL): $3,987
Please respect each other's ideas and express them politely if you agree or disagree.
Gold Analyze (XAUUSD), 1-hour time frame.
Be sure to follow the updated ideas.
Do not forget to put a Stop loss for your positions (For every position you want to open).
Please follow your strategy; this is just my idea, and I will gladly see your ideas in this post.
Please do not forget the ✅ ' like ' ✅ button 🙏😊 & Share it with your friends; thanks, and Trade safe.

Gold may face short-term pullback📊 Market Movement
Gold is currently trading around USD 4,067/oz. The U.S. dollar is stabilizing while Treasury yields remain firm, which continues to pressure gold. Safe-haven demand is recovering slightly, but the trend is still unclear and lacks strong momentum.
📉 Technical Analysis
• Key Resistance: ~ USD 4,090/oz — area where sellers previously stepped in strongly.
• Additional Resistance: ~ USD 4,110/oz — secondary level if the main resistance breaks.
• Nearest Support: ~ USD 4,030/oz — strong technical reaction zone.
• Additional Support: ~ USD 4,000/oz — psychological level and broader support range.
• EMA09: Price is currently below the EMA09 on short-term charts → indicating a bearish short-term bias.
• Candlestick / Volume / Momentum:
• Recent candles show longer upper wicks → selling pressure appears at higher levels.
• Momentum indicators (MACD, short-term oscillators) are weakening.
• Probability of an immediate strong upward breakout is low; correction risk remains elevated.
📌 Outlook
Gold may decline in the short term if the resistance around USD 4,090 holds and the U.S. dollar continues to strengthen.
If the support at USD 4,030 holds and new buyers step in, a rebound is still possible.
💡 Trade Strategy Suggestions
🔻 SELL XAU/USD at: 4,087 – 4,090
🎯 TP: 40 / 80 / 200 pips
❌ SL: 4,094
🔺 BUY XAU/USD at: 4,026 – 4,029
🎯 TP: 40 / 80 / 200 pips
❌ SL: 4,022

XAUUSD analysis todayHello traders, this is a complete multiple timeframe analysis of this pair. We see could find significant trading opportunities as per analysis upon price action confirmation we may take this trade. Smash the like button if you find value in this analysis and drop a comment if you have any questions or let me know which pair to cover in my next analysis.

Gold Holds the 4020 Support – Market Awaits the Next Breakout🔸 Market Overview
Gold trades around $4029/oz, slightly down. Daily range 4019–4055 shows strong volatility as traders await upcoming US data.
📊 Technical Analysis
• Short-term trend: mild bearish correction
• Resistance: 4042 – 4055
• Support: 4020 – 4012
• EMA20–50: price below → bearish momentum
• H1 Candle: long upper wick → sellers active
💡 Outlook
Above 4019–4020 → chance for a bounce to 4038–4045.
Below 4019 → drop toward 4010–4005.
No clear reversal yet — wait for confirmation.
🎯 Trade Setups
🔻 SELL XAU/USD: 4042 – 4045
🎯 TP: 40 / 80 / 200 pips
🛑 SL: 4049
🔺 BUY XAU/USD: 4019 – 4022
🎯 TP: 40 / 80 / 200 pips
🛑 SL: 4012

Gold Near Channel Support – Bulls Preparing for Another Leg Up?Gold ( OANDA:XAUUSD ) is approaching the Support zone($4,193 – $4,137) and the lower line of the ascending channel .
In terms of Elliott Wave theory , it looks like Gold is completing the main wave 4 .
I expect Gold increase from the Support zone($4,193 – $4,137) to Potential Reversal Zone(PRZ) and Resistance zone($4,316 – $4,270) .
First Target: $4,253
Second Target: $4,297
Stop Loss(SL): $4,133
Please respect each other's ideas and express them politely if you agree or disagree.
Gold Analyze (XAUUSD), 1-hour time frame.
Be sure to follow the updated ideas.
Do not forget to put a Stop loss for your positions (For every position you want to open).
Please follow your strategy; this is just my idea, and I will gladly see your ideas in this post.
Please do not forget the ✅ ' like ' ✅ button 🙏😊 & Share it with your friends; thanks, and Trade safe.

XAUUSD Far from signaling a BUY yet.Gold (XAUUSD) has been trading within a +1 year Channel Up and has found itself on a correction (Bearish Leg) since it's All Time High (ATH), which was a Higher High for the pattern, 1 month ago.
Despite this -11% Bearish Leg so far, it hasn't even broken yet below its 1D MA50 (blue trend-line), which is something it has done on both previous Bearish Legs. As you can see those have been fairly similar to the current one (-10.92% and -9.32% respectively). All started after roughly +40% Bullish Legs led to those.
Notice also that both Bullish Legs had to test the 1D MA100 (green trend-line) before the started. At the same time the 1W RSI hit its Buy Zone.
As a result, Gold hasn't waved a buy signal yet.
---
** Please LIKE 👍, FOLLOW ✅, SHARE 🙌 and COMMENT ✍ if you enjoy this idea! Also share your ideas and charts in the comments section below! This is best way to keep it relevant, support us, keep the content here free and allow the idea to reach as many people as possible. **
---
💸💸💸💸💸💸
👇 👇 👇 👇 👇 👇

4002 or 4161?By examining the gold chart on the 4-hour timeframe, you can see that the price has returned to the top of that important level after not breaking the resistance of 4161 and is currently trading in the range of 4071. If the price consolidates above the 4046 range, we can expect the price to rise to 4105 and 4161. The second scenario is that if gold can reach the bottom of 4046 in the last hours of the working day, we can have a fall to the important level of 4002. This analysis will be updated.
با بررسی چارت طلا در تایم فریم 4 ساعته مشاهده میکنید که قیمت پس از آن که مقاومت 4161 رو شکست نتونست دیگه به بالای اون سطح مهم برگرده و الان در حال حاضر در محدوده 4071 درحال معامله میباشد .
در صورت تثبیت قیمت بالای محدوده ی 4046 میتونیم انتظار رشد ثیمت را تا 4105 و 4161 رو داشته باشیم.
سناریو دوم هم این است که اگر طلا در آخرین ساعات روز کاری بتواند خودشو به پایین 4046 برساند میتونیم ریزش را تا سطح مهم 4002 داشته باشیم.
این تحلیل به روز رسانی خواهد شد

Gold jumps sharply from 4060 to 4083 📊 Market Developments:
• After a strong selloff, gold formed a bottom at 4060 and rebounded aggressively — a clear sign of strong buying pressure returning.
• Price broke back above 4068–4072, invalidating the entire bearish pullback zone.
• The zone 4080–4083 is now acting as a short-term resistance to watch.
________________________________________
📉 Technical Analysis:
• Immediate Resistance: 4085 – 4090
• Extended Resistance: 4096 – 4102
• Immediate Support: 4072 – 4075
• Extended Support: 4060 – 4054
• EMA 09: Price has moved back above the EMA → bullish momentum is returning.
Current candlestick behavior: strong-bodied H1 candles showing solid bullish momentum.
________________________________________
📌 Outlook:
If gold holds above 4075, it may continue rising toward 4088 → 4095.
However, if a strong rejection occurs at 4085–4088, price may retrace back to 4075 before choosing the next direction.
________________________________________
💡 Suggested Trading Strategies:
🔺 BUY if price holds above 4075
• Entry: 4075–4078
• SL: 4070
• TP: 4088 / 4095 / 4102
________________________________________
🔻 SELL at strong resistance
• Entry: 4088–4090
• SL: 4094
• TP: 4080 / 4075 / 4068
________________________________________
🔺 BUY Breakout (only if an H1 candle closes above 4090)
• Entry: 4090–4093
• SL: 4085
• TP: 4102 / 4110 / 4120

XAU/USD | Gold Holding Strong – More Upside If Support Holds!By analyzing the #Gold chart on the 4H timeframe, we can see that after a pullback, the price climbed again to $4112 before making a small correction. It’s now trading around $4078.
If gold can hold above $4048, we can expect another move to the upside.
The next potential targets are $4106, $4112, $4133, and $4159.
Please support me with your likes and comments to motivate me to share more analysis with you and share your opinion about the possible trend of this chart with me !
Best Regards , Arman Shaban

XAUUSD - Time to buy gold...XAUUSD was recently in a short term downtrend for a few weeks but has now shown some clear bullish movements ahead. XAUUSD (Gold) has broken out of a downward trend channel that was acting as strong resistance, The price is very likely to head to the next strong resistance level which is marked as the take profit zone (green line). Time to buy!

Gold Weakens Further After Breaking 4055 – Downside Risk Expands📊 Market Overview
Gold has dropped to 4050 as buying pressure weakens, with the market awaiting fresh catalysts from the European session. Cautious sentiment dominates, preventing buyers from regaining momentum after the earlier rise.
📉 Technical Analysis
Key Resistance Levels
• R1: 4060 – 4068 (near-term resistance)
• R2: 4078 – 4085 (strong resistance during EU–US sessions)
• R3: 4098 – 4105 (major rejection zone; a breakout would confirm a larger bullish trend)
Key Support Levels
• S1: 4050 – 4042 (nearest support)
• S2: 4035 – 4028 (strong support with high probability of rebound)
• S3: 4015 – 4008 (deep support; breaking below may form a medium-term downtrend)
EMA & Momentum
• Price is trading below the EMA 09, confirming short-term bearish momentum.
• Bearish momentum remains strong with weak pullbacks and no reversal patterns.
Candle Structure
• M5–M15 candles show sellers actively suppressing price around 4055.
• A break below 4048 may trigger stronger selling pressure.
📌 Outlook
Gold may continue to decline in the short term if it breaks clearly below 4048, targeting 4042 → 4035.
Conversely, if price closes above 4058, short-term bullish momentum may return, aiming for 4068 → 4078.
💡 Trade Ideas
🔻 SELL XAU/USD : 4082 – 4085
🎯 TP: 40 / 80 / 200 pips
❌ SL: 4088
🟢 BUY XAU/USD: 4011– 4008
🎯 TP: 40 / 80 / 200 pips
❌ SL: 4005
XAUUSD Analysis todayHello traders, this is a complete multiple timeframe analysis of this pair. We see could find significant trading opportunities as per analysis upon price action confirmation we may take this trade. Smash the like button if you find value in this analysis and drop a comment if you have any questions or let me know which pair to cover in my next analysis.
