Gold: Bullish Setup Builds Above $3,352.0FenzoFx—Gold has taken out the previous day's high, currently testing this level as support. The immediate support is at $3,352.0, below the bullish candle that broke the resistance.
From a technical perspective, the uptrend will likely resume if the support holds. In this scenario, the next bullish target will likely be the order block with the highest resistance price at $3,380.
Goldsignals

Gold Poised for Mild Rebound amid Tariff Relief📊 Market Movement:
Gold eased after President Trump announced tariff exclusions on imported gold bars, easing prior market uncertainty. Safe-haven demand stays supported by macroeconomic and Fed policy concerns.
📉 Technical Analysis:
• Key Resistance: $3,385 – $3,410 – $3,460
• Nearest Support: $3,330 – $3,332
• EMA: Price fluctuates around medium-term EMA.
• Candlestick / Momentum: Ascending triangle, neutral RSI, rising volume → mild accumulation signs.
📌 Outlook:
Gold may see a mild rebound in the short term if trade policy remains stable and the Fed keeps rates unchanged. Strong US economic data could pressure prices downward.
________________________________________
💡 Suggested Trading Plan
🔻 SELL XAU/USD: $3,410–$3,413
🎯 TP: 40/80/200 pips
❌ SL: $3,416
🔺 BUY XAU/USD: $3,330–$3,333
🎯 TP: 40/80/200 pips
❌ SL: $3,327

XAUUSD on the verge of price explosion to $3800.Gold (XAUUSD) has been trading within nearly a 2-year Channel Up. Despite the red start to this week, we have had a strong bullish confirmation signal prior, as the price hit and rebounded on its 1D MA100 (red trend-line).
The 1W MA50 (blue trend-line) may be the Channel's natural Support throughout all this time but its the 1D MA100 that every time it's been touched, it initiated the pattern's technical Bullish Legs.
As you can see this always takes place after an Accumulation/ Consolidation period and the minimum rise it has produced was +18.53%.
If we repeat this bear minimum, we are looking at a $3800 Target before the end of the year.
-------------------------------------------------------------------------------
** Please LIKE 👍, FOLLOW ✅, SHARE 🙌 and COMMENT ✍ if you enjoy this idea! Also share your ideas and charts in the comments section below! This is best way to keep it relevant, support us, keep the content here free and allow the idea to reach as many people as possible. **
-------------------------------------------------------------------------------
Disclosure: I am part of Trade Nation's Influencer program and receive a monthly fee for using their TradingView charts in my analysis.
💸💸💸💸💸💸
👇 👇 👇 👇 👇 👇

XAUUSD Analysis todayHello traders, this is a complete multiple timeframe analysis of this pair. We see could find significant trading opportunities as per analysis upon price action confirmation we may take this trade. Smash the like button if you find value in this analysis and drop a comment if you have any questions or let me know which pair to cover in my next analysis.

Gold Retesting Support 3,350–3,345-Short-Term Buying Opportunity📊 Market Overview
Gold is currently trading around 3,350 USD/oz, slightly higher than the previous session thanks to expectations that the Fed will cut interest rates amid a weakening USD. The market remains cautious ahead of upcoming U.S. inflation data, which could provide new momentum for gold prices. Additionally, President Trump’s confirmation that gold imports will not face tariffs has helped stabilize investor sentiment.
📉 Technical Analysis
• Key Resistance: 3,400 – 3,410 USD/oz
• Nearest Support: 3,345 – 3,350 USD/oz
• EMA09: Price is currently below the EMA09 on the H1 timeframe → short-term downward pressure still persists.
• Candlestick / Volume / Momentum: After a sharp drop on August 11, price is sideways around the support zone; RSI on H1 is about 56, not yet overbought, indicating potential for a rebound if support holds.
📌 Outlook
Gold could rebound short term from the 3,350–3,345 zone if U.S. inflation data comes in lower than expected and the USD continues to weaken. However, if price breaks below 3,345 with strong selling pressure, the downtrend may extend to 3,335 or 3,330.
💡 Suggested Trading Strategy
BUY XAU/USD: 3,346 – 3,343 USD/oz
🎯 TP: 40/80/200 pips
❌ SL: 3,339 USD
SELL XAU/USD: 3,407 – 3,410 USD/oz
🎯 TP: 40/80/200 pips
❌ SL: 3,413 USD

Gold Breaks $3,352 Support – Further Downside Risk📊 Market Overview:
• Spot gold is now trading at $3,352–3,356/oz, sliding sharply on profit-taking and uncertainty over potential U.S. import tariffs on gold.
• Weak buying interest at support pushed the price below the 200-hour MA, opening the door for deeper declines.
📉 Technical Analysis:
• Key resistance: $3,360–$3,365
• Nearest support: $3,345; next at $3,330
• EMA 09: Price remains below EMA09 → short-term trend is bearish
• Momentum: RSI below 45, sellers maintain control
📌 Outlook:
• Gold may continue to decline toward $3,345 or $3,330 if the H1 candle closes below $3,350.
• Only a break back above $3,365 with strong volume could trigger a short-term reversal.
💡 Suggested Trading Strategy:
SELL XAU/USD: $3,362–3,365
🎯 TP: 40/80/200 pips
❌ SL: $3,368
BUY XAU/USD: $3,345–$3,348 (only if clear bullish reversal candlestick forms)
🎯 TP: 40/80/200 pips
❌ SL: $3,342

Gold Sideways, Awaiting Breakout Confirmation📊 Market Overview:
Gold on the H1 chart is consolidating between $3,375 and $3,404, with buying and selling pressure balanced ahead of U.S. CPI data. Narrow H1 candles suggest imminent volatility.
📉 Technical Analysis:
• Key Resistance: $3.400–$3.410
• Nearest Support: $3.358–$3.351
• EMA: Price hovering around EMA 50, with EMA 9 crossing below EMA 21 → short-term bias slightly bearish.
• Pattern / Momentum: MACD losing bullish momentum, RSI neutral at 48–50, Inside Bar pattern forming on H1.
📌 Outlook:
• A break below $3.351 could drive gold toward $3.333–$3.321.
• Holding above $3.370 and breaking $3.400 could target $3.410–$3.420.
💡 Suggested Trading Strategy:
🔻 SELL XAU/USD : $3.397–$3.400
🎯 TP: 40/80/200 pips
❌ SL: $3.403
🔺 BUY XAU/USD : $3.352–$3.355
🎯 TP: 40/80/200 pips
❌ SL: $3.349

Gold (xauusd): still bullishHello guys!
Price is moving inside an ascending channel.
Recently bounced from mid-channel support (“last kiss”) and heading toward channel resistance.
Potential upside target: $3,435 zone.
As long as the price stays above mid-line support, bullish momentum remains intact.

XAUUSD Analysis todayHello traders, this is a complete multiple timeframe analysis of this pair. We see could find significant trading opportunities as per analysis upon price action confirmation we may take this trade. Smash the like button if you find value in this analysis and drop a comment if you have any questions or let me know which pair to cover in my next analysis.

GOLD (XAUUSD): Support & Resistance Analysis For Next Week
Here is my latest support & resistance analysis for Gold
Support 1: 3380 - 3390 area
Support 2: 3327 - 3358 area
Support 3: 3246 - 3275 area
Resistance 1: 3431 - 3450 area
With a high probability, the market will continue rising to Resistance 1.
❤️Please, support my work with like, thank you!❤️
I am part of Trade Nation's Influencer program and receive a monthly fee for using their TradingView charts in my analysis.

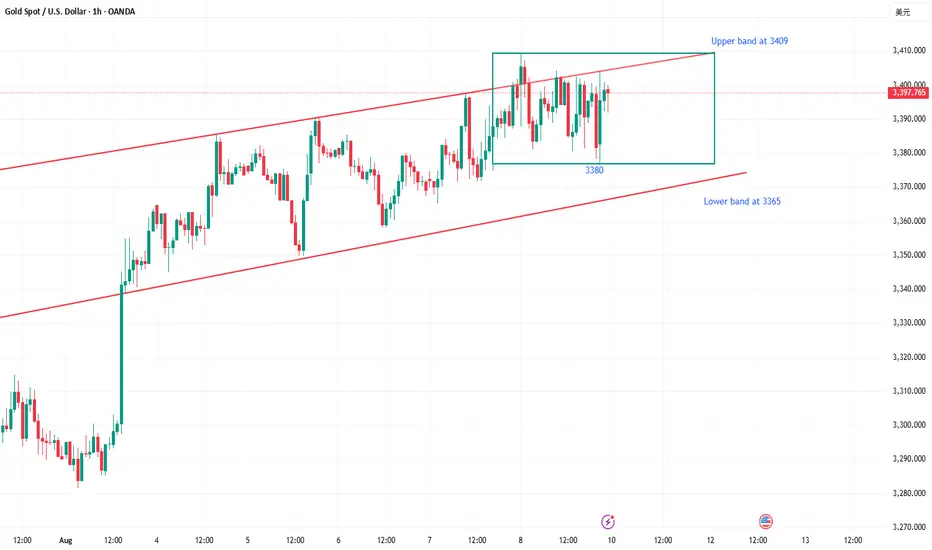
It’s that simple to catch the golden trend.On Friday, gold did not break through the highs or the bottoms, and maintained the range of 3400 to 3380, which was in line with our expectations. In the analysis layout on Friday, I made it clear that I would short at the pressure of 3400 during the day, and go long at the support near 3380 before and after the US market, with an overall gain of 580pips. The points were accurate and there was no error. It was proven by strength that in this market, as long as you don’t chase orders, it is relatively easy to make some profits. Don’t always think about betting on the breakout of the market. Wait for the breakout before doing anything. Just do well in the present. It's better to miss than to do it wrong. The key is how you choose. Stability comes first.
Gold continued to close positively on the weekly chart this week, and after hitting the bottom at 3368 and rebounding, it rebounded with large volume. It is in the process of gradually touching the upper track of the range. Normally, there is still room above, and the range pressure is at 3450. Therefore, we will continue to maintain a bullish mindset next week. In the daily cycle, it fluctuated and washed out repeatedly on Friday, and finally closed with a negative cross star. In the short term, it will maintain operation in the small range of 3409-3380. In terms of operation, continue to go high and buy low before the range is broken, and follow the trend after the breakthrough; an upward breakthrough can be seen at 3425 and 3450, and a downward breakthrough can be seen at 3365 and 3345. For the specific operation rhythm, pay attention to the real-time notification at the bottom.
Gold May Continue Its Short-Term Uptrend📊 Market Snapshot:
• Gold is holding above the $3,383–3,385 zone, reflecting strong buying pressure and slightly higher liquidity.
• Weaker-than-expected U.S. economic data, along with expectations of Fed rate cuts, are supporting gold’s upward momentum.
📉 Technical Analysis:
• Key Resistance: ~$3,408 (intraday high)
• Nearest Support: ~$3,383–3,385
• EMA: Price is currently above EMA 20, 50, and 100, indicating a clear bullish trend.
• Candlestick / Volume / Momentum: The $3,408 resistance zone could trigger a short-term pullback; momentum is showing signs of slowing near this level.
📌 Outlook:
Gold may continue rising in the short term if it holds above the $3,383–3,385 support zone and breaks through $3,408 with strong liquidity.
However, watch volume and price action at resistance — if momentum weakens, a pullback could occur.
💡 Suggested Trades:
SELL XAU/USD : $3,406–3,409
🎯 TP: 40/80/200 pips
❌ SL: ~$3,412
BUY XAU/USD : $3,381–3,384
🎯 TP: 40/80/200 pips
❌ SL: ~$3,378

Gold Poised to Continue Rising If Supports Hold📊 Market Overview:
Gold remains on the rise amid expectations of further Fed rate cuts, a weakening U.S. dollar, and persistent tariff-related uncertainty. Citi has raised its 3-month forecast to $3,500–3,600/oz
📉 Technical Analysis:
• Current Resistance Levels:
o Near-term: $3,408–3,412
o Extended: $3,421 and $3,442
• Key Support Levels:
o Immediate: $3,375, then $3,355 and $3,343
o Deeper: $3,312–3,300 demand zone on TradingView, and April low at $3,170
• Technical Trend:
Gold continues to receive strong bullish signals across multiple moving averages, and FXEmpire indicators show “Strong Buy” across most timeframes
📌 Outlook:
The short-term bias is clearly bullish. As long as gold holds above the $3,375 support and breaks through the $3,408 resistance, it is likely to rally toward the $3,420–3,440 area.
💡 Suggested Trading Strategy:
BUY XAU/USD : $3,375–3,378
🎯 TP: 40/80/200 pips
❌ SL: $3,370

XAUUSD GOLD BUYS Gold hit all take profits and now will be taking more trades into the correct direction for the rest of the trend , keep the trading simple and straightforward

GOLD (XAUUSD): Road to 3430
Quick update for my yesterday's analysis for Gold.
The price broke through the trend line with a local Break of Structre BoS,
updating an intraday-high.
The road to 3430 is now empty, and the market will most likely
continue rising steadily to that.
❤️Please, support my work with like, thank you!❤️
I am part of Trade Nation's Influencer program and receive a monthly fee for using their TradingView charts in my analysis.

Gold Continues to Attract Safe-Haven Flows📊 Market Brief
Gold prices remain firm above the 20-day EMA and 50-day MA, reflecting increased safe-haven demand amid ongoing trade tensions and growing expectations of a Fed rate cut.
The price is currently testing the resistance area around $3,400/oz, while immediate support lies in the $3,320–$3,330/oz range.
📉 Technical Analysis
• Key Resistance:
- $3,400
- Followed by: $3,420–$3,435
• Nearest Support:
$3,320–$3,330
- If broken, next levels are $3,300–$3,268
• EMA Position:
- Gold remains above both the 20-day EMA and 50-day MA, indicating a short-term uptrend
• Patterns & Momentum:
- RSI ~54 (neutral), MACD positive – indicating underlying bullish momentum
- EMA 8/21 crossover is turning upward, signaling short-term bullish reversal potential
📌 Outlook
Gold may continue rising modestly if it holds above the $3,320–$3,330 support zone and successfully breaches the $3,400 resistance. However, a break below $3,320 could lead to a test of $3,300 or even $3,268.
💡 Suggested Trading Strategy
SELL XAU/USD : $3,395–$3,3400
o 🎯 TP: 40/80/200 pips
o ❌ SL: ~$3,405
BUY XAU/USD :$3,325–$3,330
o 🎯 TP: 40/80/200 pips
o ❌ SL: ~$3,320

XAUUSD Potential buy and sell zone!XAUUSD Potentially coming for a dipper pullback as upon crossing the daily high we can see XAUUSD started reject from higher price and continue to drop to this daily and weekly support and may continue to drop.
It is possible for the market to potentially bounce off the weekly support as the market is moving up with a stronger momentum

GOLD (XAUUSD): Technical Analysis Ahead of Trump
One of the important news for today is Trump speech during
the late New York session.
Here is my brief technical outlook for Gold ahead of that.
As we discussed on the yesterday's live stream, the price
is now coiling on a recently broken rising trend line that serves
as a vertical resistance now.
A bullish breakout of that and a daily candle close above
will provide a strong bullish confirmation and push the prices to 3430.
Alternatively, very bearish news today may trigger a retracement
to an underlined horizontal support.
Let's see how the market is going to react tonight.
❤️Please, support my work with like, thank you!❤️
I am part of Trade Nation's Influencer program and receive a monthly fee for using their TradingView charts in my analysis.

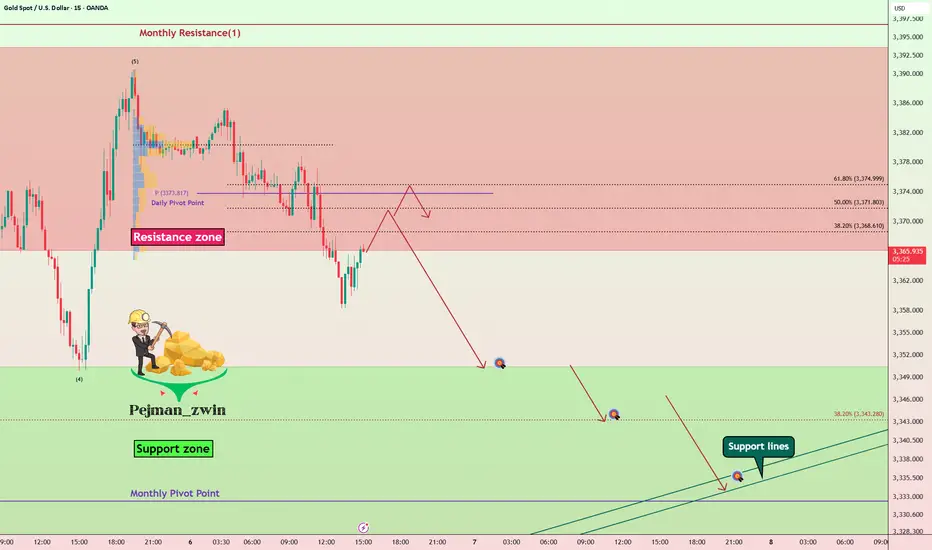
Gold Roadmap — Short termGold ( OANDA:XAUUSD ) rose to $3,383 as I expected in yesterday's idea .
Gold is currently moving in the Resistance zone($3,393-$3,366) .
In terms of Elliott Wave theory , it seems that Gold has completed 5 impulse waves , and we should wait for corrective waves on the 15-minute time frame .
I expect Gold to start declining from one of the Fibonacci levels and fall to at least $3,351 .
Second Target: $3,344
Third Target: Monthly Pivot Point/Support lines
Note: Stop Loss (SL) = $3,392
Gold Analyze (XAUUSD), 15-minute time frame.
Be sure to follow the updated ideas.
Do not forget to put a Stop loss for your positions (For every position you want to open).
Please follow your strategy; this is just my idea, and I will gladly see your ideas in this post.
Please do not forget the ✅ ' like ' ✅ button 🙏😊 & Share it with your friends; thanks, and Trade safe.
Gold May Pull Back Ahead of Fed Decision📊 Market Dynamics:
Spot gold is trading around $3,376.69/oz, down approximately 0.1%, as the US dollar strengthens and investors await Federal Reserve appointments, with continued rate-cut expectations for September
📉 Technical Analysis
• Key Resistance: ~$3,400 (analysts expect a test around this level)
• Nearest Support: ~$3,370 (near current trading range)
• EMA 09 (assumed): Price below EMA 09 → suggests short term bearish or consolidating momentum.
• Candlestick / Volume / Momentum: Mild selling pressure as USD gains, creating short term resistance for gold.
📌 Outlook:
Gold may experience a mild pullback or trade sideways in the short term if the dollar remains firm and no new catalysts strengthen rate cut expectations.
💡 Suggested Trading Strategy:
SELL XAU/USD : ~$3,395–3,398
o TP: 40/80/200 PIPS
o SL: ~$3,401
BUY XAU/USD : ~$3,365–3,370
o TP: 40/80/200 PIPS
o SL: ~$3,360

Gold May Correct Short-TermMarket Overview:
• Gold trading around $3,366–3,371 USD/oz, easing from two-week highs.
• Pressure from firmer US yields and USD recovery.
• Weak US jobs data boosted Fed rate cut expectations to ~90%.
• Still supported by global economic/political uncertainties and safe haven demand.
Technical Analysis:
• Resistance: ~$3,385–3,390, near psychological $3,400.
• Support: ~$3,345–3,350; break could target ~$3,310.
• Trading above EMA50, EMA9 direction still bullish short-term.
• RSI and MACD momentum fading; July monthly candle formed bearish “shooting star” near $3,431—invalidated only if price closes above that level.
Outlook
Gold may dip if USD and yields recover; but may rally if macro data deteriorate further. The $3,385–3,390 zone is pivotal.
Trading Strategy:
• Sell 3,392–3,395
TP ~40/80/200 pips
SL ~3,397
• Buy 3,345–3,348
TP ~40/80/200 pips
SL ~3,342

The bullish outlook remains unchanged, go long with the trend!Yesterday, the gold bulls refreshed the high point, and the daily line closed in the form of a medium-sized Yang line with a long lower shadow. The idea of continuing to be bullish in the short term remains unchanged, and what needs to be paid attention to is the strength of the retracement, which is similar to yesterday. The current support below is maintained at the 3355-3350 line of yesterday's rise. This position is also today's key support level, and the key suppression point above is maintained at the integer level of 3390-3400. This position may not be the end point. It was also mentioned yesterday that under the range of the previous large range of fluctuations, if either side does not break through, it will likely continue to fall into fluctuations. The current bullish trend is still relatively obvious, so we still maintain the idea of low-long operations. If your current operation is not ideal, I hope I can help your investment avoid detours. Welcome to communicate!
From the 4-hour analysis, the important support below is the 3355-3350 line. If the daily level stabilizes above this position, the bullish rhythm of falling back to lows and buying on the trend will remain unchanged. Before the daily level falls below the 3350 mark, you need to be cautious about shorting against the trend. I will provide you with the specific operation strategies at the bottom, please pay attention to them in time.
Gold operation strategy: Go long on gold when it retraces to around 3360-3350, target 3375-3385 area, and continue to hold if it breaks through.

The shot at the critical moment is the real trading opportunityGold bottomed out and rebounded yesterday, breaking the high slightly to touch 3390 before falling back. The daily line closed with a small bullish cross overnight, and the upward momentum has slowed down. Today it tends to fluctuate at a high level. In the 4H cycle, the Bollinger band is closing, and the overall bulls continue to run upward. The big positive line directly pulls up, which is relatively strong. The overall market is resistant to declines. Therefore, the big cycle does not expect a big drop for the time being, but the short-term trend fails to continue further. It is safe to maintain a pullback and go long. Pay attention to the support below 3365-3350. Go long after it stabilizes. First look at yesterday's high of 3390. If it breaks, there is a probability of going to 3400 or even around 3415, but be careful of a high rush and fall.
