Gold shows signs of slowing down, are the bears ready?This wave of bullish pull-up is a complete rebound. With the help of the timeliness of fundamentals, the highest rebound only reached around 3330 and then began to fall. At this time, many people probably think that the short-term trend has begun to change. I still stick to my bearish thinking. The important target pressure is definitely around 3330. As long as this position is under pressure and falls back to 3280 again, it will be shaky. At present, the stop loss is based on the break of 3335. If it really breaks, it will be similar to the break of 3280. Even if 3340-3345 is short, it is also a short-term bull correction. If the falling channel is broken, I can't convince myself to continue to be short and stick to it. Once 3335 breaks, I can really confirm the reversal of the short-term trend. Then 3280 will also be the bottom of the medium term. In short, since I am shorting near 3320-3330 in the direction of the band and the short-term negative, I think that the stop loss will be given to 3335. The stop profit target is uncertain. The channel has not been broken. Now the short-term long and short conversions are frequent. It is definitely the best choice in my own trading system. No one will win all the time. It is too fake to win all the time. Make your moves according to your own ideas without regrets. If this wave of strategy verification fails, everyone is welcome to supervise. We dare to take responsibility and review every judgment.
Goldsignals

XAUUSD Analysis todayHello traders, this is a complete multiple timeframe analysis of this pair. We see could find significant trading opportunities as per analysis upon price action confirmation we may take this trade. Smash the like button if you find value in this analysis and drop a comment if you have any questions or let me know which pair to cover in my next analysis.

GOLD (XAUUSD): Important Decision Ahead
As I predicted, Gold went up from a trend line yesterday.
The price is now testing another trend line - a falling resistance
of a bullish flag pattern.
The next reliable bullish signal that you can look for is its
bullish breakout and a daily candle close above that.
A bullish move is going to follow then.
❤️Please, support my work with like, thank you!❤️
I am part of Trade Nation's Influencer program and receive a monthly fee for using their TradingView charts in my analysis.

Gold Rebounds from 3283, Eyes 3315 Resistance📊 Market Overview:
• Gold dropped sharply to a low of $3283 earlier today before rebounding strongly back to around $3312, supported by renewed buying interest.
• The recovery is fueled by risk-off sentiment amid ongoing trade negotiation uncertainty and a mild pullback in the U.S. Dollar Index.
• Central bank buying continues to underpin gold’s base, despite mild pressure from rising U.S. bond yields.
________________________________________
📉 Technical Analysis:
• Key Resistance: $3315 – $3335
• Nearest Support: $3280
• EMA 09: Price is trading above the 9-period EMA, signaling a short-term bullish trend.
• Candle pattern / Momentum: A strong bullish engulfing candle formed after bouncing from $3283 on the H1 chart. MACD is crossing upward, and RSI is approaching the 60 level, suggesting bullish momentum.
________________________________________
📌 Outlook:
Gold may continue to recover in the short term if it holds above the $3300 level and successfully breaks through $3315 resistance. However, failure to break above this resistance could lead to a short-term pullback toward $3290–$3280.
________________________________________
💡 Suggested Trading Strategy:
🔻 SELL XAU/USD at: $3315–3325
🎯 TP: $3295
❌ SL: $3330
🔺 BUY XAU/USD at: $3285–3295
🎯 TP: $3315
❌ SL: $3280

The risks of shorting at low levels have been informed!Today, I have reminded you many times not to chase short positions at low levels. Now you can see that gold has bottomed out and rebounded. We also bought gold in batches at 3285-3295, and the long positions also made perfect profits. I believe that friends who follow my articles can see that I have always emphasized not to short at low levels. It is also obvious to everyone that we bought long positions near 3295-3285. In the future, we will continue to pay attention to the suppression of the upper 3318-3325 line. If the rebound does not break, we will look for opportunities to short. I hope everyone can grasp the entry position and hold the profit. The rebound will first look at the previous break point of the 3325 line, and then short when the rebound is suppressed! If your current gold operation is not ideal, I hope I can help you avoid detours in your investment. Welcome to communicate with me!
From the current analysis of gold trend, today's upper short-term resistance focuses on the hourly top and bottom conversion position of 3318-3325. The intraday rebound relies on this position to go short once and look down. The lower short-term support focuses on 3280. The overall support relies on the 3280-3325 area to maintain the main tone of high-altitude low-multiple cycles. In the mid-line position, keep watching and do less, be cautious in chasing orders, and wait for the opportunity to enter the market after the key points are in place.
Gold operation strategy: short gold rebounds near 3318-3325, target 3305-3295.

Gold Drops to 3,284 – Short-Term Support at Risk📊 Market Overview
Gold fell sharply this morning to $3,284/oz amid a modest USD rebound and profit-taking pressure following several range-bound sessions. The lack of fresh catalysts also contributed to weaker momentum.
📉 Technical Analysis
• Key Resistance: 3,315 – 3,330
• Nearest Support: 3,280 – 3,275
• EMA 09: Price is currently trading below the EMA 09 on both the H1 and H4 timeframes → short-term bearish signal
• Candle Patterns & Momentum:
– H1 candle shows a bearish engulfing pattern near the 3,305 area → confirms downward pressure
– RSI is below 45, MACD has crossed below its signal line → bearish momentum dominant
– If the 3,275 level is breached, gold could continue to fall toward 3,260
📌 Outlook
Gold is leaning toward further downside unless it can hold above the 3,280 support level during today’s session.
💡 Trade Strategy
🔻 SELL XAU/USD at: 3,295 – 3,398
🎯 TP: 40/80/200 PIPS
❌ SL: 3,305
🔺 BUY XAU/USD at: 3,275 – 3,278
🎯 TP: 40/80/200 PIPS
❌ SL: 3,269

GOLD (XAUUSD): Time to Recover?!
Gold reached an important rising trend line on a daily.
I see 2 nice intraday bullish reactions to that on a 4H time frame
and a double bottom pattern formation.
Its neckline breakout and a 4H candle close above 3309
will confirm a start of a bullish correctional movement.
Goal will be 3327.
Alternatively, a bearish breakout of the trend line will push
the prices lower.
❤️Please, support my work with like, thank you!❤️
I am part of Trade Nation's Influencer program and receive a monthly fee for using their TradingView charts in my analysis.

Gold lures shorts, mainly depending on the rebound.On Monday, the gold market rebounded. The root cause was that Trump sent tariff letters to 14 countries at one time. Even allies such as Japan and South Korea were not spared and were subject to high tariffs of 25% to 40%. This "extreme pressure" trade method instantly ignited the market's risk aversion sentiment. Funds poured into gold, pushing up gold prices. The market quickly saw through the "routine". On Tuesday, Trump extended the tariff deadline from July 9 to August 1. This delay was seen as a signal of "surrendering" under trade pressure, and trade tensions were eased. The safe-haven demand dissipated like a receding tide, and gold was sold off violently, plummeting by $35 in a single day, a drop of more than 1%, and the lowest fell to $3,287.2 per ounce.
On Tuesday, the price of gold showed a trend of rising and falling. It reached a high of 3245 in the morning and then gradually fell. It fell to 3287 and then stopped falling and rebounded. As it failed to break through the key resistance level of 3345 and the price continued to be unable to stand firm on the middle track, the bulls' rebound momentum was insufficient. Yesterday's daily line closed with a large Yin line in the engulfing pattern. This K-line combination indicates that the gold price may continue to fall today. The focus below is on the support strength near the lower track 3280. The upper resistance level needs to pay attention to the 3320-3330 range. Today's daily closing is crucial. If the real big Yin line continues to close, it may drive the Bollinger Band to open downward and further open up the downward space; if the closing can stand above 3330, the short-term downward trend may end and the market is expected to restart the rise. From the weekly perspective, the gold price showed an obvious oscillation pattern this week. After rising on Monday, it fell back on Tuesday. The bulls and bears fought fiercely but failed to gain a decisive advantage. Although the current market is weak, the price is close to the important support area. In terms of operations, it is recommended that under the premise of controlling risks, you can now pay attention to the opportunities to buy on dips in the 3295-3285 area.

GOLD - at resistance ? Holds or not??#GOLD.. .market perfect dropped below our area that was around 3320
Now market bounced back and just near to his resistance area 3295 96
That will be market final area and only holdings of that region means another drop expected.
Note: we will plan for cut n reverse above that region.
Good luck
Trade wisely
XAUUSD Analysis todayHello traders, this is a complete multiple timeframe analysis of this pair. We see could find significant trading opportunities as per analysis upon price action confirmation we may take this trade. Smash the like button if you find value in this analysis and drop a comment if you have any questions or let me know which pair to cover in my next analysis.

Gold (XAU/USD): Playbook in ActionHello guys!
We’ve seen a textbook QML (Quasimodo Level) setup play out beautifully on gold. Price pushed into a key supply zone and formed a QML structure, followed by a clean engulfing of the previous demand. confirming smart money involvement. As expected, the target of that QML has now been hit, tapping into the major demand zone below.
After the deep sweep and reaction from demand, price retraced upward into a potential lower high area. Based on structure and liquidity dynamics, two potential scenarios are in play:
We’re executing a two-step plan here:
Step 1: Short position from the QML + supply area, aiming for the next blue demand zone. Liquidity has been taken above the high, confirming the setup.
If we get a clean reaction near the blue area, that’s our signal to flip long. We expect a pullback toward $3310 area.

(XAU/USD) 3H Chart – Bearish Reversal Setup from Resistance Zon1. Entry Point (Sell):
Marked at 3,335.03
This is a key resistance level where price is expected to reverse downward.
2. Stop Loss:
Placed above at 3,354.88
This acts as a protection level in case the trade goes against the direction.
3. Take Profit Targets (EA Target Points):
TP1 (Downside): 3,245.65
TP2 (Upside - if Stop Loss is hit): 3,455.76 (in case of reversal or long position)
4. Price Action Observation:
Price is currently around 3,320.56, climbing back toward the entry zone.
The red 50-period moving average (EMA) and blue 200-period MA show convergence, often preceding volatility.
---
📉 Bearish Scenario (Main Setup)
Sell Bias is expected from the 3,335 region.
If price respects the resistance zone and breaks down again, the target is 3,245.65, yielding approximately 90-point move.
This is a risk-reward favorable setup, with:
Risk: ~20 points
Reward: ~90 points
RRR ≈ 1:4.5
---
⚠️ Bullish Invalidity (Stop Loss Hit)
If the price breaks and closes above 3,354.88, it invalidates the bearish setup.
Then, the market may shift towards targeting 3,455.76 — about 100 points to the upside.
---
🔧 Technical Factors Supporting the Setup
Supply zone marked by the purple box around the entry.
Trend previously bearish — recent upward move may just be a retracement.
Confluence with MAs: Price is testing MAs — rejection here would add bearish confirmation.
---
✅ Summary of Trade Setup
Element Value
Entry 3,335.03
Stop Loss 3,354.88
Take Profit 3,245.65
Alt Target 3,455.76 (if SL hit)
Risk-Reward ~1:4.5
Bias Bearish (Sell Setup)

Hold more than 3320 gold orders and wait patiently for the riseWe arranged a long order at 3320. Obviously, the market has given us an opportunity. After entering the long order, we should set a stop loss and wait patiently for the profit to be released. This is what we have to do, so there is no other idea and we are still bullish.
The current market has a clear rhythm, and the support is effective. In the short term, it is still a bullish structure. The structure is not broken and the direction remains unchanged. We will continue to advance the trading rhythm as planned.
🔸 Hold long orders near 3320, and the stop profit is 3335-3345 unchanged.
🔸 Strictly implement the trading plan, keep a stable rhythm, and wait for the market to realize the space.
Trade within the plan, rhythm first, keep an eye on the key points, and leave the rest to the market.
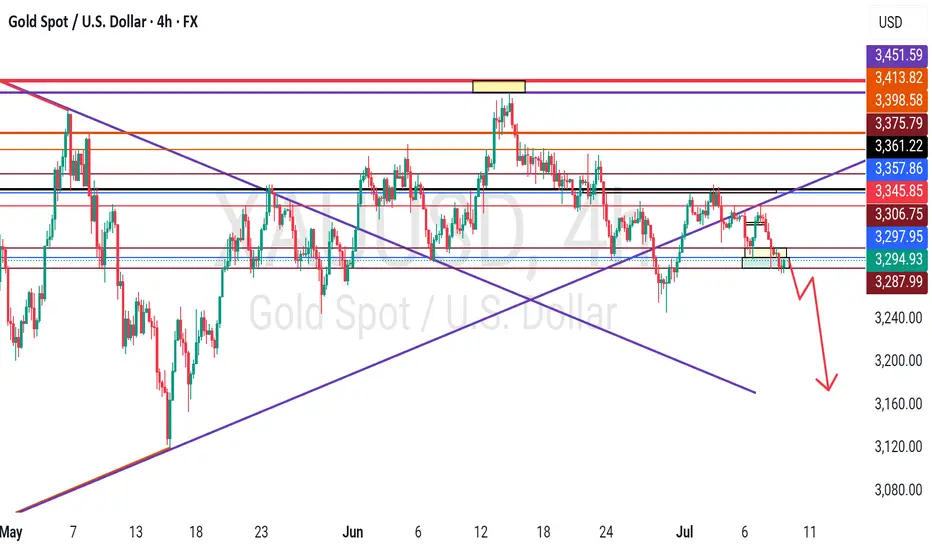
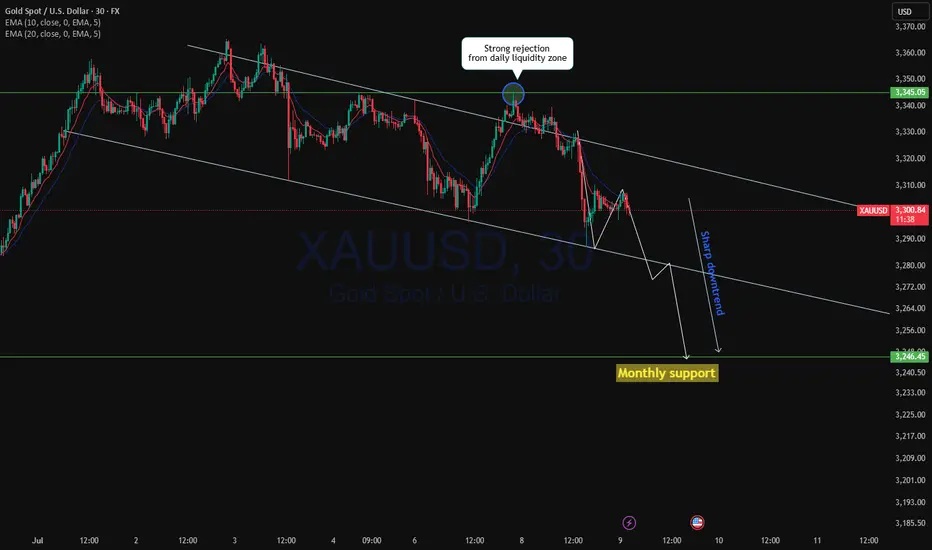
XAUUSD Continue to drop?XAUUSD from daily resistance of 3345.00 after strong liquidity grab price started to fall with strong momentum to the daily support level. Yesterday we have seen a long daily doji formed with a long wick at the bottom followed by wick fill as expected with long bearish engulfer with both cross over of 10ema and 20ema.
Currently price in sharp downtrend and possibility to drop to monthly support below 3250.00
A bearish trade is high probable.
XAUUSD h4 buying target levelsGOLD (XAU/USD) - 4H Analysis
Price is currently reacting from a well-defined support zone (demand area) near $3,250–3,270, which previously acted as strong resistance and now flipped to support.
🔍 I'm watching for bullish confirmation from this zone for a potential upward move toward the next resistance levels.
🎯 Targets:
Target 1: $3,400 (First key resistance)
Target 2: $3,460 (Major resistance & previous high)
📉 If price fails to hold above the support area, this setup will be invalidated. Risk management is key.
This idea is based on structure breakout and price respecting previous resistance turned support zone.
📊 Levels:
Support (Entry Area): $3,250 – $3,270
Target 1: $3,400
Target 2: $3,460
Invalidation Below: $3,240
#GOLD #XAUUSD #PriceAction #TradingSetup #BuySetup #4HChart #ForYou #BreakoutTrade #SmartMoney #ForexAnalysis #LiquidityGrab
CAPITALCOM:GOLD

Gold Ranges at $3,330–$3,335 – Ready for the Next Move📊 Market Overview:
Gold is currently trading around $3,330–$3,335/oz, supported by a softer US Dollar and cautious sentiment ahead of key US labor data. According to TradingView, gold is consolidating in a tight range, reflecting market indecision while awaiting a clear breakout signal.
📉 Technical Analysis:
• Key resistance: $3,345–3,350 – a strong supply zone that recently rejected price.
• Nearest support: $3,320–3,330 – multiple bounce points observed here.
• EMA09: Price is hovering around the 09 EMA on both 1h–4h timeframes → neutral/slightly ranging.
• Candlestick / Volume / Momentum:
o A “bearish flag” pattern appears to be forming, suggesting potential for a downside breakout.
o Weak buying volume during upward moves signals limited bullish strength.
📌 Outlook:
• Gold may continue to consolidate between $3,330–$3,345.
• A break above $3,345 with strong volume could open the path to $3,360–$3,380.
• A break below $3,330 could lead to further correction toward $3,300–$3,320.
💡 Suggested Trading Strategy:
SELL XAU/USD at: 3,343 – 3,345
🎯 TP: 40/80/200 pips
❌ SL: 3,355
BUY XAU/USD at: 3,330 – 3,327
🎯 TP: 40/80/200 pips
❌ SL: 3,320

XAU/USD : Gold is falling , When it Stops? (READ THE CAPTION)By analyzing the gold chart on the 4-hour timeframe, we can see that, in line with our latest analysis, the bearish momentum has continued—and even more strongly than expected. Gold has broken below the key $3300 level and is currently trading around $3294.
Given the strong momentum, further downside is likely. The next bearish targets are $3289, $3276, $3262, and $3254.
All key supply and demand zones are clearly marked on the chart.
(And if you're looking for more precise trading levels, just drop a comment and I'll guide you.)

After repeated tug-of-war, where will gold go?At present, the gold market is divided between long and short positions. The Federal Reserve may maintain high interest rates, which weakens the investment appeal of gold; however, trade frictions and geopolitical risks provide safe-haven support for gold. Overall, market sentiment is mixed, with bulls lacking confidence, but bears have not been able to fully control the situation. Last week's strong non-farm data reduced market expectations for a rate cut in July, pushing up U.S. bond yields and the dollar, putting pressure on gold, which does not generate interest. In addition, Trump said on social media that he would impose a 10% tariff on countries that "support anti-U.S. policies." The market is waiting for the release of the minutes of the Fed's June meeting, which will more clearly show policymakers' views on the current economic situation and future policies, and may determine the direction of interest rates. If the minutes show that the Fed is inclined to maintain high interest rates for a longer period of time, gold prices may continue to face downward pressure.
From a technical perspective, gold was under pressure at a high level at the opening, so gold is expected to fall today. Today's key pressure level is 3345. Before the price effectively breaks through and stabilizes at 3345, any rebound is a short-selling opportunity; once it stabilizes at 3345, the bottom pattern is confirmed to be established, and the bulls will start an upward market. At this time, the short-selling idea should be abandoned. From a technical point of view, the 1-hour chart has shown a trend from weak to strong, and the Bollinger Bands are opening and diverging upward, indicating that the market may accelerate upward. Today's operation suggestion is to focus on low-long and high-short as a supplement. In terms of specific points, the lower support is 3327-3320, and the upper resistance is 3355-3360.
Operation strategy:
1. It is recommended to buy gold when it rebounds to around 3327-3320, with the target at 3340-3350.
2. It is recommended to sell gold when it rebounds to around 3345-3355, with the target at 3330-3320.

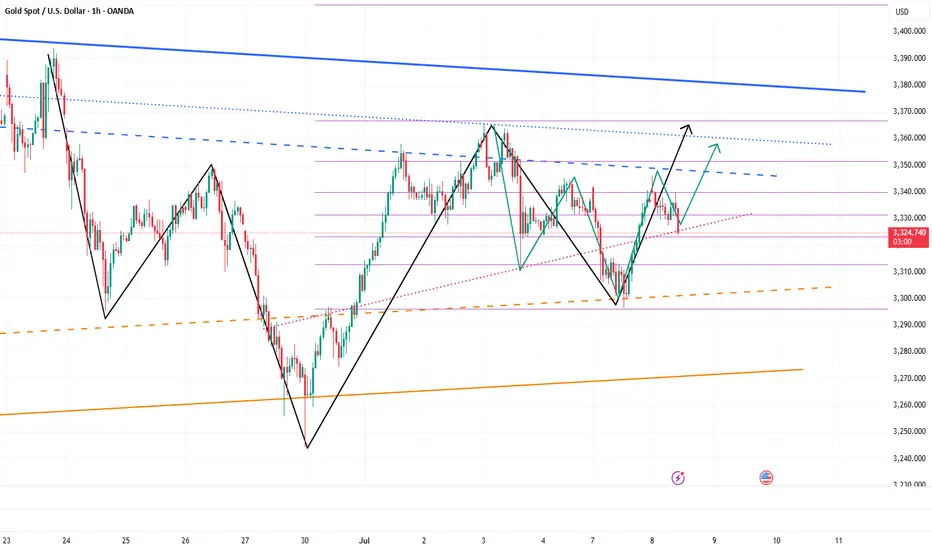
Gold is expected to regain bullish momentum and continue to 3360Yesterday, gold rebounded from 3296 and was able to reach around 3345. Although the process was rather painful, we have to admit that gold bulls still have the energy to wrestle with bears, and the gold market is not one-sidedly dominated by bears. As gold gradually tested and confirmed the effectiveness of support during the retracement process and then rebounded effectively, the short-term structure of gold gradually changed and began to favor bulls.
After gold hit bottom and rebounded yesterday, we can clearly see from the short-term structure that gold has successfully constructed a head and shoulders bottom structure in the three areas of 3295-3244-3296 in the short term, thus playing an absolute supporting role in the structure; and in the process of repeated testing of gold, there are signs of constructing a head and shoulders bottom structure in the three areas of 3310-3296-3325 locally again. Under the effect of the structural support resonance of the head and shoulders bottom, gold may not go below 3320 again, and may even regain the bullish trend and continue to the 3345-3355 area.
So I think there is a lot of profit potential in going long on gold. We can go long on gold with the 3330-3320 area as support and look towards the target area: 3340-3350-3360
XAUUSD Analysis todayHello traders, this is a complete multiple timeframe analysis of this pair. We see could find significant trading opportunities as per analysis upon price action confirmation we may take this trade. Smash the like button if you find value in this analysis and drop a comment if you have any questions or let me know which pair to cover in my next analysis.

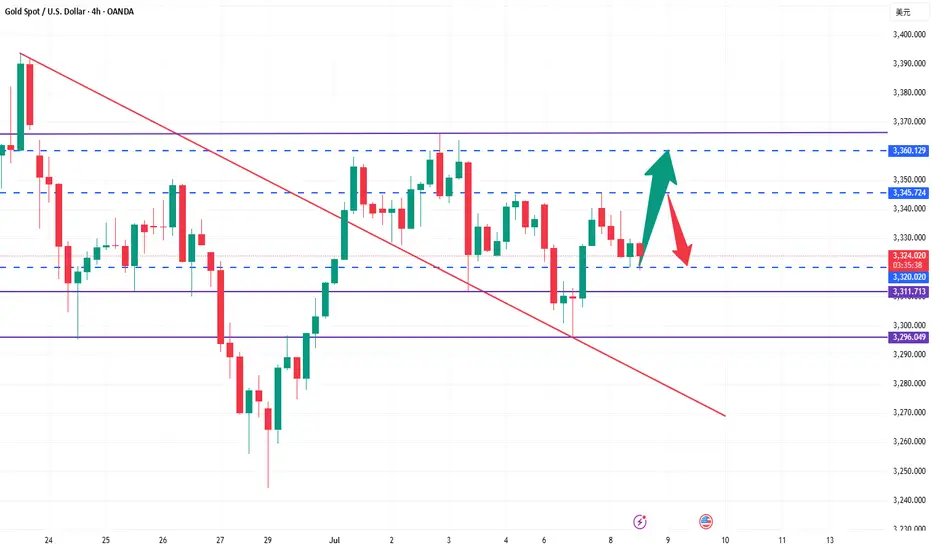
Gold price analysis July 8In the previous US session, strong buying pressure pushed gold prices up and formed a bullish hammer candlestick pattern on the D1 chart - a potential sign for an uptrend recovery.
🔄 Today's scenario: The correction in the early session is considered a good opportunity to buy, expecting the price to continue the uptrend.
📍 Nearest resistance zone:
The price is currently facing the resistance zone of 3344 in the European session. If gold breaks 3344, the next target will be 3365 - the gap zone that has not been filled.
However, according to the wave structure, it would be more optimal if the price has a retest to the 3320 zone, accumulates more buying momentum and then breaks out strongly through 3344.
📉 Bearish scenario:
If 3320 is broken, especially with a trendline and support zone breakout signal, a sell strategy can be activated with a lower target.
🔸 Support: 3320 – 3297
🔸 Resistance: 3345 – 3352 – 3365
🔸 Sell is triggered if: Price breaks 3320, confirms breaking trendline & support zone.
💬 Do you have any comments on this trading plan? Leave a comment!

Seize the correction: It’s the right time to short goldThe current rebound is only a technical adjustment rather than a trend reversal. The rebound in the falling market is a good opportunity to arrange short orders. The hourly chart shows that the moving average pressure continues to move down to around 3340-3345. This position also serves as the long-short watershed in the previous intensive trading area, forming a key resistance barrier. If the gold price rebounds and approaches the area below 3345 and a stagflation signal appears or a top structure is formed, it can be regarded as a clear short signal. It is recommended to enter the market to seize the downward space. The current market direction is clear, and the exhaustion of the rebound is the best time to enter the market. Relying on the technical pressure level, the short position can be accurately arranged.

XAUUSD is getting ready to explode to $4000Gold (XAUUSD) is trading around its 1D MA50 (blue trend-line) having practically been accumulating since the April 22 High. Ever since the 1D MA100 (green trend-line) turned into a long-term Support (2023), Gold has experienced similar Accumulation Phases another 3 times.
On all of those occasions, the price broke out to the upside in the form of a Channel Up, reaching at least the 2.5 Fibonacci extension.
With the 1D MACD close to forming a Bullish Cross around the 0.0 mark, which is the level that always started the Channel Up during those 3 previous Accumulation Phases, we expect the market to start breaking upwards and towards the end of the year hit at least $4000.
-------------------------------------------------------------------------------
** Please LIKE 👍, FOLLOW ✅, SHARE 🙌 and COMMENT ✍ if you enjoy this idea! Also share your ideas and charts in the comments section below! This is best way to keep it relevant, support us, keep the content here free and allow the idea to reach as many people as possible. **
-------------------------------------------------------------------------------
💸💸💸💸💸💸
👇 👇 👇 👇 👇 👇
