GOLD (XAUUSD): Your Trading Plan for Monday
Gold went strongly rejected from a key daily support on Friday.
Your confirmation signal for a pullback trade from that will
be a bullish breakout and an hourly candle close above
3283 intraday resistance.
After that the price will likely reach 3292 level.
❤️Please, support my work with like, thank you!❤️
I am part of Trade Nation's Influencer program and receive a monthly fee for using their TradingView charts in my analysis.
Goldsignals

Gold (XAU/USD) Bearish Trade Setup – June 27, 2025Entry Point: Around 3,300.98 USD
Stop Loss (SL): ~3,312.20 USD
Take Profit (TP): 3,229.33 USD
Current Price: 3,286.15 USD
Risk-Reward Ratio: ~1:6.3
(Potential reward ≈ 71.65 pts; risk ≈ 11.22 pts)
Technical Breakdown:
Trend:
The price is in a short-term downtrend, supported by:
Lower highs and lower lows.
Price trading below both 50 EMA (red) and 200 EMA (blue), confirming bearish momentum.
Bearish Breakout:
Price broke below a key support-turned-resistance zone near 3,300–3,302, triggering sell pressure.
Resistance Area:
Strong rejection at 3,302–3,312 zone, which is now acting as resistance.
SL is placed just above this zone to protect against false breakouts.
Target Zone:
TP set at 3,229.33, aligning with a previous support zone — a logical area for price to react.
Strategy Notes:
Bias: Bearish
Entry confirmation: Already triggered.
Risk Management: SL placement is tight and strategic; RR ratio is highly favorable.
Next support below TP: If 3,229 breaks, further downside could follow.
Summary:
This setup shows a well-defined bearish continuation with a clean break of support, a controlled SL above resistance, and a strong RR ratio. A suitable trade for trend-following strategies, but price must not retrace above 3,312 for this idea to remain valid.

Gold Drops Sharply – Breaks Below the $3,300 Support📊 Market Overview:
Gold has plunged to $3,290/oz, breaking the key psychological level of $3,300 as the US dollar strengthened and Treasury yields ticked higher. Market sentiment has turned defensive ahead of Friday’s US PCE inflation data, with expectations that the Fed may maintain its hawkish stance for longer.
📉 Technical Analysis:
• Key Resistance: $3,310 – $3,325
• Nearest Support: $3,285 – $3,272
• EMA09: Price is currently below the 9-period EMA, confirming short-term bearish momentum.
• Candlestick / Volume / Momentum:
o H1/H4 charts show a series of long bearish candles, with rising volume → strong selling signal.
o RSI is approaching oversold levels (~28), MACD remains in a widening bearish divergence → downward pressure is still dominant.
📌 Outlook:
Gold is in a clear downtrend and may extend its decline toward $3,285 – $3,272 unless a reversal is triggered by weaker-than-expected PCE data or renewed geopolitical tensions. In the near term, any technical rebound is likely to offer sell opportunities rather than a trend reversal.
💡 Suggested Trade Setup:
🔻 SELL XAU/USD
• Entry: $3,300 – $3,305 (on technical retracement)
• 🎯 TP: $3,285 – $3,272
• 🛑 SL: $3,315
🔺 BUY XAU/USD (high risk)
• Entry: $3,272 – $3,277 (short-term bottom catching)
• 🎯 TP: $3,295 – $3,305
• 🛑 SL: $3,262

Gold Breakdown Confirmed — Bearish Pennant Targets UnfoldingGold ( OANDA:XAUUSD ) started to decline as I expected in my previous idea after the lower lines of the Ending Diagonal broke .
Gold is moving near the Resistance zone ($3,349-$3,325) . And Gold seems to be crossing the 50_SMA(Daily) .
From a Classical Technical Analysis perspective , the Bearish Pennant Pattern seems to indicate a continuation of the downtrend in Gold .
From an Elliott wave theory perspective , it seems that Gold has completed the Zigzag Correction(ABC) , and we can expect the next 5 downwaves .
I expect Gold to continue to decline at least to the Support zone($3,281-$3,243) and Monthly Pivot Point .
Note: Stop Loss (SL) = $3,360
Gold Analyze (XAUUSD), 1-hour time frame.
Be sure to follow the updated ideas.
Do not forget to put a Stop loss for your positions (For every position you want to open).
Please follow your strategy; this is just my idea, and I will gladly see your ideas in this post.
Please do not forget the ✅ ' like ' ✅ button 🙏😊 & Share it with your friends; thanks, and Trade safe.

Gold Falls After Rejection at 3350 – Eyes on Short-Term Pullback📊 Market Drivers:
• Gold spiked to $3,350/oz early in the day but later dropped to $3,310/oz as profit-taking kicked in and U.S. yields recovered slightly.
• Market is in a wait-and-see mode ahead of PCE inflation data on Friday, limiting upside momentum late in the session.
📉 Technical Analysis:
• Key resistance: $3,345–3,350 (daily high)
• Nearest support: $3,310 – session low; then $3,290
• EMA09: Price trading above EMA09, but below EMA21, signaling a neutral bias
• Candle/momentum: Formed shooting star reversal near $3,348 on H1 with declining volume → short-term weakness ahead
📌 Outlook:
Gold may pull back toward $3,300–3,290 short-term if USD rebounds and selling persists. But medium-term bullish bias remains if inflation data disappoints and USD continues weakening.
💡 Trade Ideas:
🔻 SELL XAU/USD at: 3,335–3,345
🎯 TP: 3,315
❌ SL: 3,352
🔺 BUY XAU/USD at: 3,295–3,305
🎯 TP: 3,315
❌ SL: 3,285

Gold May Slightly Pull Back Around 3,350 USD📊 Market Overview
• Gold is currently trading around 3,340–3,345 USD/oz, supported by a weaker USD and lower U.S. yields, with 60 bps Fed rate cut expected by year-end, starting in September
• The Israel–Iran ceasefire has eased safe-haven demand, triggering a mild pullback, while support remains near 3,300 USD
📉 Technical Analysis
• Key resistance:
3,370 USD (short-term peak)
3,380–3,400 USD (prior highs)
• Nearest support:
3,300 (technical bounce zone)
Next at 3,275 (momentum weak)
• EMA:
Price trading below the 9-period EMA on H4, indicating a mild bearish/choppy short-term trend
• Candles/volume/momentum:
RSI & Stochastics near neutral suggest consolidation or minor retracement .
📌 Outlook
Gold may pull back to 3,300–3,320 if the USD rebounds or geopolitical tensions ease further. However, a Fed rate cut in September or renewed Middle East instability could drive prices back up to 3,370–3,400.
💡 Suggested Trade Plan
• SELL XAU/USD: at 3,365–3,370
o 🎯 TP: 3,345–3,340
o ❌ SL: 3,380
• BUY XAU/USD: at 3,300–3,310
o 🎯 TP: 3,320–3,330
o ❌ SL: 3,290

Gold (XAUUSD) – Pullback Setup Before Breakout? – JUNE 26, 2025🟡 GOLD PRICE OUTLOOK – June 26, 2025
Bias: Bullish | Looking for long entry on pullback
📊 Technical Overview :
OANDA:XAUUSD Gold continues to build a bullish market structure, forming consistent Higher Highs (HH) and Higher Lows (HL). Price is currently moving within a rising wedge, approaching a short-term resistance zone.
🔴 Sell Zone (Resistance) : 3359 – 3373
– Rising wedge top + upper trendline
– Fakeout trap possible near 3379.26
🟢 Buy Zone (Support) : 3294 – 3300
– Strong confluence zone
– Matches previous structure support + trendline
– Ideal for HL formation and long setup
🌍 Fundamentals & Macro Drivers :
💵 USD Weakness:
• DXY near 3.5-year low after Powell replacement rumors
• Boosting gold's upside momentum
☢ Geopolitical Risk:
• Iran–Israel ceasefire in place, but fragile
• Safe-haven demand still supportive
🏦 Central Bank Demand:
• 20% of global gold demand from central banks
• China 🇨🇳 & India 🇮🇳 are major buyers
📅 Upcoming Catalysts:
• US PCE Inflation & GDP due tomorrow
→ Weak data = Potential breakout above 3370+
📌 Trade Plan :
✔ Watch for rejection at 3359–3373
✔ Long setup if price retests 3294–3300
🎯 Target = 3370+
❌ Invalidation = Daily close below 3280
📈 Summary :
Gold remains structurally bullish, supported by weak USD, central bank demand, and macro risks.
Waiting for a healthy pullback into demand for long continuation setups.

XAUUSD and GBPJPY Analysis todayHello traders, this is a complete multiple timeframe analysis of this pair. We see could find significant trading opportunities as per analysis upon price action confirmation we may take this trade. Smash the like button if you find value in this analysis and drop a comment if you have any questions or let me know which pair to cover in my next analysis.

GOLD (XAUUSD): Updated Support & Resistance Analysis
Here is my latest support and resistance analysis for Gold.
Horizontal Structures
Support 1: 3294 - 3312 area
Support 2: 3231 - 3287 area
Support 3: 3121 - 3176 area
Resistance 1: 3338 - 3368 area
Resistance 2: 3441 - 3451 area
Resistance 3: 3493 - 3500 area
Vertical Structures
Vertical Support 1: Falling trend line
Consider these structures for pullback/breakout trading.
❤️Please, support my work with like, thank you!❤️
I am part of Trade Nation's Influencer program and receive a monthly fee for using their TradingView charts in my analysis.

XAUUSD Analysis todayHello traders, this is a complete multiple timeframe analysis of this pair. We see could find significant trading opportunities as per analysis upon price action confirmation we may take this trade. Smash the like button if you find value in this analysis and drop a comment if you have any questions or let me know which pair to cover in my next analysis.

XAUUSD Ready bounce back?XAUUSD 3295.00 is an important weekly and daily key level price has just bounced back from the key level with double bottom formation. It is possible for the price to continue to bounce back to daily resistance level?
While was in down trend price has left significant imbalance in the market showing possible uptrend with the filling of FVG.
A buy trade with strong liquidity grab is high probable.

Gold Holding Strong – Eyes on $3400 and Beyond! (READ)By analyzing the gold chart on the 4-hour timeframe, we can see that after our last analysis, the price corrected down to $3341, then rallied back up to $3399. Currently, gold is trading around $3373, and if it manages to hold above $3355, we can expect further upside movement.
Potential bullish targets are $3400, $3417, $3450, and $3468.

Gold Pulls Back to 3332 Before Mild Rebound📊 Market Overview:
This morning, gold dropped sharply to $3,332/oz, marking the lowest level in recent sessions, due to profit-taking after the early-week rally and a slight recovery in the USD.
However, dip-buying interest returned near key support, pushing the price back up to around $3,350/oz.
The market remains sensitive to Middle East geopolitical headlines and comments from Fed officials scheduled throughout the week.
📉 Technical Analysis:
• Resistance: $3,360 – $3,370
• Support: $3,332 – $3,340 (tested this morning)
• EMA 09: Price is currently below EMA09 ($3,355) → short-term trend remains slightly bearish
• Momentum / Volume / Candlesticks:
o H1 candle shows a bullish hammer formation at $3,332 → signal of potential short-term rebound.
o RSI recovered from oversold (<30) to ~42 → mildly positive signal.
o StochRSI indicates short-term buying pressure, but a break above $3,355 is needed to confirm a reversal.
📌 Outlook:
Gold may see a mild recovery toward the $3,360–3,370 area if buying interest holds near the $3,330 support. However, failure to break above $3,370 could lead to a pullback during the US session.
💡 Suggested Trading Plan:
🔻 SELL XAU/USD at: $3,365–3,370
🎯 TP: $3,345 (~20)
❌ SL: $3,375
🔺 BUY XAU/USD at: $3,332–3,340
🎯 TP: $3,355 (~20)
❌ SL: $3,325

Gold Short Term OutlookYesterday’s chart idea is playing out as analysed.
Gold failed to break above the $3,395 resistance and has now pulled back, currently testing the first support zone — aligned with the 4H 200MA and Daily 50MA.
If this area fails to hold, price is likely to head toward the next key support zone, where we expect a potential reaction.
To resume bullish momentum, we need to see a strong close above $3,346. Key bullish zones remain $3,375 and $3,395.
📌 Key Levels to Watch:
Resistance:
$3,375 • $3,395 • $3,418 • $3,439
Support:
$3,361 • $3,346 • $3,330 / $3,306
$3,287 – Critical demand zone
🧠 Fundamental Focus:
All eyes are on Fed Chair Powell’s testimony today, which may offer clues about the Fed’s rate outlook and inflation stance. Any hint of continued hawkishness could weigh on gold, while dovish commentary may trigger renewed upside interest.
Expect heightened intraday volatility around his remarks — stay cautious.

XAU/USD Double Bottom Breakout Bullish Momentum Incoming!XAU/USD Double Bottom Breakout 💥 | 🚀 Bullish Momentum Incoming!
Analysis:
🟡 Double Bottom Pattern: Two clear lows have formed around the $3,340 support, signaling a potential reversal.
🟦 Accumulation Zone: The price consolidated in a range, indicating strong buying interest before the breakout.
🟣 Bullish Momentum: Recent aggressive bullish candles show strong buying pressure.
📈 Breakout & Retest Zone: If the price holds above $3,370, a bullish continuation toward $3,409 and possibly $3,445 is expected.
🧭 Target Area: Marked with a blue box, the upside potential is clearly projected.
Conclusion:
A successful retest of the breakout level may lead to a strong bullish run. Keep an eye on $3,370 as the pivot zone. 🎯

XAUUSD Analysis todayHello traders, this is a complete multiple timeframe analysis of this pair. We see could find significant trading opportunities as per analysis upon price action confirmation we may take this trade. Smash the like button if you find value in this analysis and drop a comment if you have any questions or let me know which pair to cover in my next analysis.

XAUUSD Channel Up bottomed, giving a strong buy signal.Gold (XAUUSD) has been trading within a 1-month Channel Up since the May 20 low and right now it is consolidating within and just outside the 4H MA50 (blue trend-line) and 4H MA100 (green trend-line) zone. At the same time, it has touched the bottom of the Channel Up.
This is exactly the kind of price action the pattern had during its previous bottom formation following a Higher Low (June 9-11). With the 4H RSI having also formed a Higher Low pattern consistent with all previous 3 Lows, we expect the price to start its new Bullish Leg now. Our Target is 3495 (+4.75% from the bottom).
-------------------------------------------------------------------------------
** Please LIKE 👍, FOLLOW ✅, SHARE 🙌 and COMMENT ✍ if you enjoy this idea! Also share your ideas and charts in the comments section below! This is best way to keep it relevant, support us, keep the content here free and allow the idea to reach as many people as possible. **
-------------------------------------------------------------------------------
Disclosure: I am part of Trade Nation's Influencer program and receive a monthly fee for using their TradingView charts in my analysis.
💸💸💸💸💸💸
👇 👇 👇 👇 👇 👇

Gold XAU/USD Bullish Reversal Setup – Targeting $3,454.65Price: $3,384.41
Strategy: Buy/Long
🟦 Key Levels:
Entry Zone: Around $3,345.76
This level aligns with a previously tested support zone marked in purple.
Stop Loss: $3,331.56
Below the support zone, providing downside protection if the setup fails.
Target (TP): $3,454.65
Marked as EA TARGET POINT, suggesting a potential upside of 3.16% (~$105.83 gain).
📊 Technical Indicators:
Moving Averages:
200 EMA (blue): Near the entry level, adds strength to the support zone.
50 EMA (red): Recently crossed below price, indicating early bullish momentum.
Price Action:
Sharp bounce from support suggests buying interest.
Potential inverse head and shoulders pattern forming, which is a bullish reversal pattern.
🧠 Trade Idea:
Buy near $3,345.76,
Stop Loss at $3,331.56,
Take Profit at $3,454.65
Risk/Reward Ratio ≈ 1:3.3 — favorable setup for long positions.

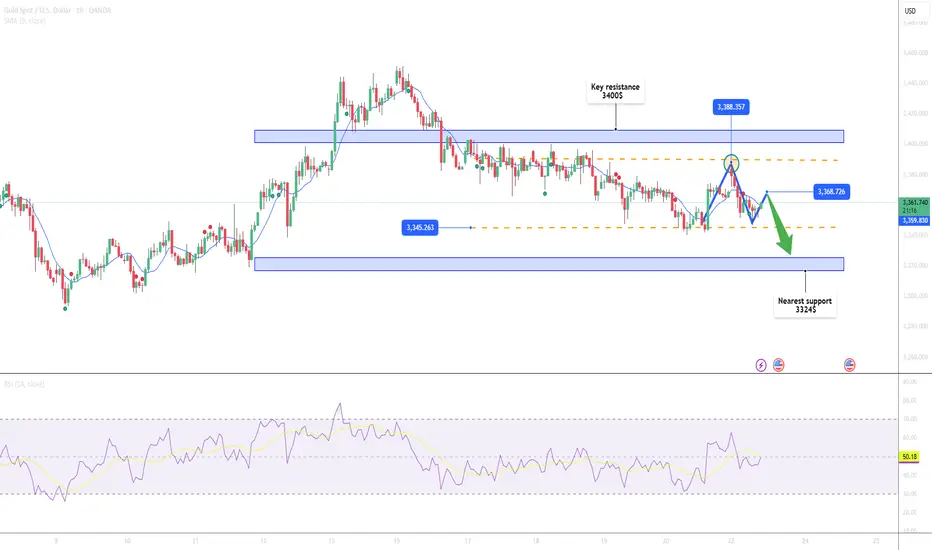
Gold Falling Toward 3345 Support📊 Market Overview
After failing to break the 3,389 resistance zone this morning, gold remains under pressure from profit-taking and a stronger USD. The price has dropped to around $3,360/oz, reflecting defensive sentiment amid ongoing geopolitical tensions in the Middle East.
📉 Technical Analysis
• Key Resistance: 3,389 – 3,400
• Nearest Support: 3,345 – 3,324
• EMA-09: Price is below the EMA-09 on the H1 chart → short-term bearish trend
• Candle Patterns / Volume / Momentum:
o M15 & H1 candles remain bearish
o RSI hovers around 45 → indicating continued correction
o No clear reversal signals yet
📌 Outlook
Gold may continue to decline slightly in the short term if the USD stays strong and no geopolitical surprises arise. However, the 3345 support zone could attract dip buyers.
________________________________________
💡 Suggested Trading Strategy
🔻 SELL XAU/USD at: 3,360 – 3,365
🎯 TP: 3,335 – 3,325
❌ SL: 3,372
🔺 BUY XAU/USD at: 3,320 – 3,324
🎯 TP: 3,340 – 3,344
❌ SL: 3,310
GOLD (XAUUSD): Intraday Bullish Confirmation
Gold is retesting a recently broken trend line of a bullish flag
pattern that I shared with you earlier.
A double bottom pattern on that and a violation of its neckline
provide a strong intraday confirmation.
I think that the price may rise to 3392 level.
❤️Please, support my work with like, thank you!❤️

Gold Set to Rise If U.S.–Iran Tensions Escalate📊 Market Overview:
Gold traded within a volatile range this past week, hovering between $3,360 and $3,385/oz. The U.S. dollar weakened on expectations that the Fed will maintain current interest rates in July, while persistent inflation concerns globally have kept gold supported. However, a geopolitical shock emerged late in the week: President Donald Trump announced readiness to deploy troops to the Middle East if Iran continues provocation, raising the possibility of serious military escalation.
📉 Technical Analysis:
•Key Resistance Levels: $3,387 – $3,403 (weekly highs), $3,450, and extended targets at $3,500–$3,520.
•Nearest Support: $3,358 – $3,365 (lower bound of the bullish channel), then $3,344 and $3,320.
•EMA09: Price remains above EMA 09, confirming a short-term uptrend on both 4H and daily charts.
•Chart Pattern: On the H4 chart, a Bullish Flag/Wedge Breakout is forming. A solid hold above $3,360 and breakout above $3,387 may trigger a strong upward move.
📌 Outlook:
Gold is likely to break higher next week if U.S.–Iran tensions escalate into direct conflict. Safe-haven demand could surge, driving gold toward $3,450 or even $3,500/oz.
On the other hand, if tensions ease and the U.S. dollar recovers on strong economic data, gold may pull back to $3,344–$3,320 before resuming any uptrend.
💡 Suggested Trading Strategy
🔺 BUY XAU/USD
Entry: $3,358–3,365
🎯 TP: $3,387 / $3,403 / $3,450
🛑 SL: $3,344
🟡 Enter on pullback to support — preferably if geopolitical tensions rise.
🔻 SELL XAU/USD
Entry: $3,400–3,410 (if price becomes overbought, RSI > 70)
🎯 TP: $3,380 / $3,365
🛑 SL: $3,420
🟡 Only apply this if tensions de-escalate and the U.S. dollar strengthens.

XAUUSD Analysis todayHello traders, this is a complete multiple timeframe analysis of this pair. We see could find significant trading opportunities as per analysis upon price action confirmation we may take this trade. Smash the like button if you find value in this analysis and drop a comment if you have any questions or let me know which pair to cover in my next analysis.

Precise short orders in 3370-3375 area are launched!Gold has been volatile recently, with intraday fluctuations ranging from 1 to 200 US dollars, which greatly increases the difficulty of operation for retail investors. On the surface, there are many opportunities, but there are only a few real big market opportunities. If you miss the rhythm, you can only watch your funds shrink. Remember that risk management is crucial.
From the 4-hour analysis of gold, there are repeated resistances from bulls before the downward break; once it breaks down, the market will go further down, and the focus below is 3340. The upper short-term is 3370-3380, and the important resistance is 3400. Only by breaking through the bulls can the rebound continue. In terms of operation, sell high and buy low, and pay attention to the breakthrough!
There are too many long orders accumulated at the current high level of gold, and the market will not rise sharply easily. The current international situation is so tense, and gold is still slowly declining. In this situation, it is difficult to rebound sharply.
Operational suggestions: For short orders above, focus on the layout of the 3370-3375 area, strictly set a stop loss, target more than 20 points, control risks, and follow the trend.
