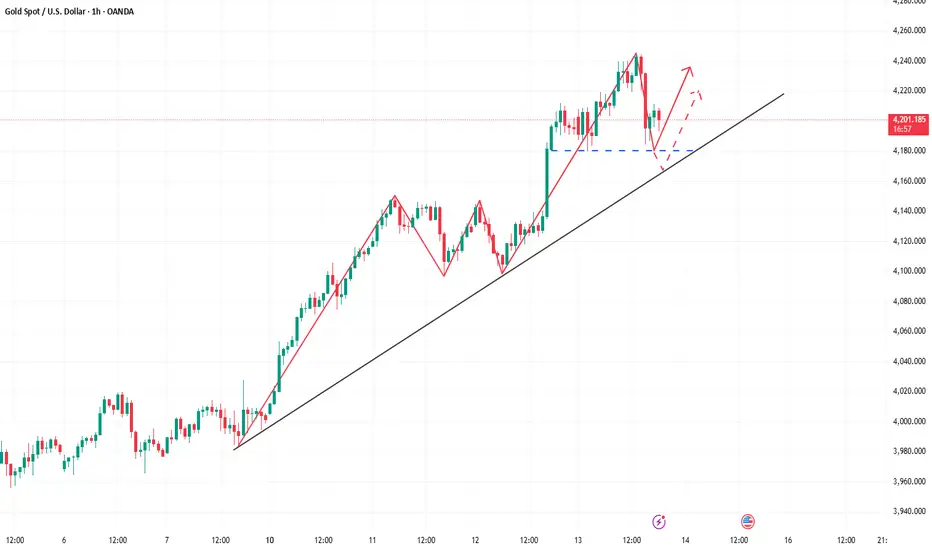
XAU/USD | Gold Faces Pullback After Breaking $4200, What’s Next?By analyzing the #Gold chart on the 4-hour timeframe, we can see that after breaking above the $4200 resistance, the price continued to rise and reached $4244 before reacting negatively from the OTE zone, correcting down to $4184.
Gold is currently trading around $4195, with an FVG zone between $4141–$4181 that might get filled soon. There’s also a key demand area between $4098–$4125 to watch closely.
If gold manages to hold above $4181 without breaking below, we could see another strong bullish move toward $4269. Monitor price reactions carefully at all mentioned levels!
Please support me with your likes and comments to motivate me to share more analysis with you and share your opinion about the possible trend of this chart with me !
Best Regards , Arman Shaban
Goldsignals

GOLD (XAUUSD): Important Demand Zone Ahead
Gold dropped strongly today, starting a correctional movement
that I predicted earlier this week on a live stream.
I see a test of a major demand cluster based on a rising trend line
and a horizontal support.
With a high probability, the price will rise from that.
Look for a confirmation on lower time frames for safer entries.
❤️Please, support my work with like, thank you!❤️
I am part of Trade Nation's Influencer program and receive a monthly fee for using their TradingView charts in my analysis.

Gold Maintains Uptrend – Waiting for a Pullback for a Safe Buy📌 Market Overview
Gold (XAU/USD) is currently trading around $4200/oz, maintaining strong bullish momentum supported by:
• A weaker USD
• Soft U.S. labor data
• Rising expectations of Fed rate cuts
• Continued safe-haven demand
However, bullish momentum is beginning to slow, suggesting a possible short-term pullback before the next upward move.
📈 Technical Analysis
• Gold remains above key EMAs (EMA20 – EMA100 – EMA200).
• EMA20 at $4176 is acting as dynamic support.
• Strong resistance: $4245 — a breakout could target $4300.
• RSI around 50 → buying pressure still present but not very strong.
• Volume & momentum are weakening → signals a healthy pullback.
🧭 Outlook
The short-term trend remains bullish as long as price stays above $4176 – $4150.
Gold is likely to:
• 🔄 Pull back slightly → then bounce toward resistance at $4245, and potentially $4300.
🎯 Trading Strategy
🔺 BUY XAU/USD
Entry: $4175 – $4172
🎯 TP: 40 / 80 / 200 pips
🛑 SL: $4169
🔻 SELL XAU/USD
Entry: $4243 – $4246
🎯 TP: 40 / 80 / 200 pips
🛑 SL: $4249

How to seize the real turning point for gold?Due to recent complex news, the operations of major gold trading funds have become more covert and unpredictable. The market may reverse at any time, breaking the current upward trend. Even if a technical pullback occurs, its magnitude could be significant, and the potential risks cannot be ignored. Therefore, a cautious approach should be taken in trading. Avoid blindly chasing the rally and patiently wait for stabilization signals after a pullback before establishing long positions. This is currently a more prudent and cost-effective choice. Following the market rhythm and acting in accordance with the trend is the core principle of future investment. From the current structure, the support level to watch is the 4190-4170 area. The performance of this range will be an important basis for judging the market direction and formulating trading strategies. By steadily grasping the rhythm and responding to fluctuations in accordance with the trend, one can achieve greater stability and go further in the gold market.
Gold Pulls Back to 4200 – Awaiting Direction Confirmation📊 Market Overview
Gold (XAU/USD) has just dropped from the resistance zone $4218–$4219 down to $4203.
The market is currently reacting near the support zone $4200–$4205, with buying pressure starting to appear, but short-term bullish momentum is weakening.
The H1 trend remains slightly bullish, with EMA20 & EMA50 pointing upward, providing support around $4205–$4210.
📉 Technical Analysis
• Main Trend: Slightly bullish (bullish bias).
• EMA20 & EMA50 H1: Upward sloping, support at $4205–$4210.
• Resistance: $4218 – $4222, further $4230 – $4235
• Support: $4205 – $4200, further $4195 – $4190
• RSI H1: Dropping from overbought → warning of a short-term pullback.
📌 Outlook
• The $4205–$4207 zone is a key support; if price holds, a rebound toward $4212–$4215 is likely.
• If price breaks below $4205, a deeper drop toward $4195–$4190 may occur.
• H1/H4 candle signals will determine the next breakout direction; priority is to BUY on support bounces and SELL on clear rejection at resistance.
________________________________________
💡 Trading Strategy
🔺 BUY XAU/USD: $4190 – $4193
• TP: 40 / 80 / 200 pips
• SL: $4186
🔻 SELL XAU/USD: $4233 – $4236
• TP: 40 / 80 / 200 pips
• SL: $4239

Gold Confirmed Bullish BiasFenzoFx—Gold is bullish again, confirmed by engulfing above the $4,175.00 resistance. As of this writing, XAU/USD trades inside the bearish fair value gap, testing the $4,230.00 resistance.
Last day, Gold did not dip below $4,103.00 (the bullish FVG) for liquidity. This indicates a strong bullish market. However, going long at the current price is risky because the price has surged already. The ideal level for joining the bull market would be around $4,146.00, which is in conjunction with daily highs and the October 23 and 24 close. This area should provide decent support for Gold.
In the bullish scenario, we expect Gold to form a double top at all-time highs by targeting $4,398.00.

XAUUSD TRADES AND RESULTS
The provided 15-minute Gold Spot / U.S. Dollar (XAUUSD) chart from November 12, 2025, shows notable short-term volatility. The price action initially moved higher, peaking near 4,157.00, before entering a consolidation phase overnight. Several significant downward movements followed, marked by large black (bearish) candles. The chart highlights three successful short trades, yielding profits of "125+ Pips (Partial)," "70+ Pips (Partial)," and a final drop capturing "140+ Pips." A substantial bearish move occurred around 10:00, pushing the price sharply lower. The gold price is currently trading around 4,114.535 after forming a temporary low and attempting a minor recovery. The overall momentum is currently bearish on this timeframe

XAU/USD | Watch Gold at $4100 – Pullback or Continuation Ahead?By analyzing the Gold chart on the 2-hour timeframe, we can see that after the last analysis, the price dropped from $3997 to $3984, then quickly found strong demand and started a powerful rally, breaking the $4040 resistance.
At the moment, Gold has reached the $4100 zone. A short-term pullback from this level is likely, but after a brief correction, I expect the uptrend to continue. The next bullish targets are $4140, $4156, and $4162.
Please support me with your likes and comments to motivate me to share more analysis with you and share your opinion about the possible trend of this chart with me !
Best Regards , Arman Shaban

Gold near 4,150 resistance — sell reaction, buy the dip at 4,095📊 Market Overview:
Gold (XAU/USD) is trading near $4,130/oz, pausing its recent rally at $4,135–$4,150 resistance.
Traders are waiting for the U.S. CPI data and Fed speeches, while the weaker USD supports short-term bullish sentiment.
🧭 Technical Analysis:
• Resistance: $4,135 – $4,150 / $4,180 – $4,200
• Support: $4,095 – $4,080 / $4,050 – $4,020
• EMA50 (H1): Rising around $4,110, maintaining bullish bias.
• H1 candles show long lower wicks near $4,100 — buyers still defending.
• RSI (H1) near 60, suggesting room for a pullback before continuation.
💬 Outlook:
Gold is consolidating between $4,095–$4,150, signaling indecision.
Best approach: Sell the resistance reaction and Buy the dip at support, waiting for confirmation candles.
A confirmed close above $4,150 opens the path to $4,180–$4,200, while rejection may trigger a short-term pullback.
________________________________________
🎯 Trading Strategy:
🔻 SELL XAU/USD
Entry: $4,145 – $4,148
🎯 TP: 40 / 80 / 200 pips
🛑 SL: $4,151
🔺 BUY XAU/USD
Entry: $4,095 – $4,098
🎯 TP: 40 / 80 / 200 pips
🛑 SL: $4,092

Gold's Accumulation Pays Off: $4,200 in SightFenzoFx—Gold bounced from $3,886.00 and accumulated around this range for 8 trading sessions. This was a bullish accumulation which resulted in Gold's price breaking out from the range in yesterday's session.
Support is at $4,050.00. If this level holds, we expect Gold to target the liquidity void with resistance at $4,200.00 for profit taking. Furthermore, if the price breaks above $4,200.00, it will likely aim for the all-time high, the $4,379.00 mark. This level has equal lows, meaning stops are resting above it.

XAUUSDHello Traders! 👋
What are your thoughts on Gold?
The $3,900 level continues to act as a key support zone for gold, preventing further downside pressure for now.
Currently, the price is consolidating between the highlighted support and resistance levels, showing range-bound behavior in the short term.
We expect gold to form a short-term upward correction toward the resistance zone, followed by a bearish rejection from that level.
If price fails to hold above $3,900 zone and breaks below the support, a deeper decline toward lower levels could follow.
As long as the $3,900 support holds, gold is likely to remain in a sideways structure, but a confirmed breakdown would signal the start of a new bearish leg.
Don’t forget to like and share your thoughts in the comments! ❤️

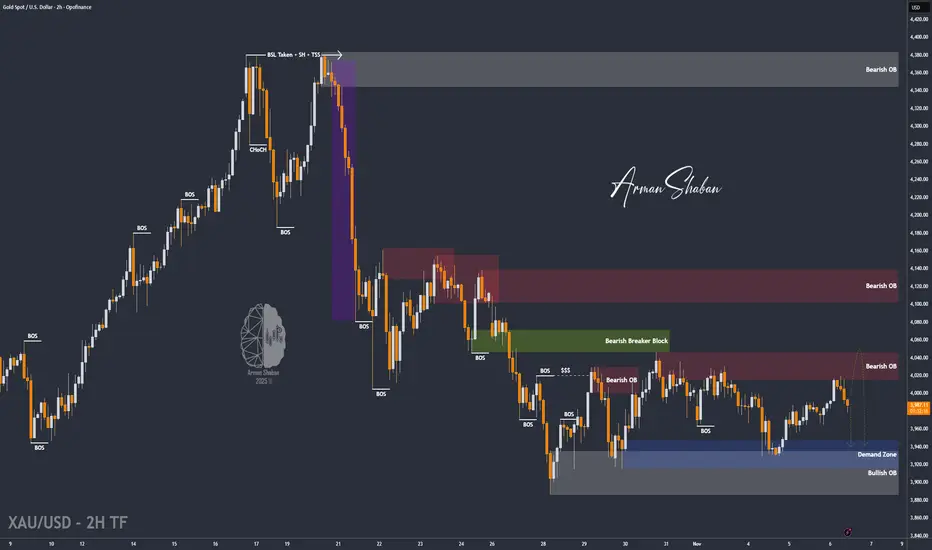
XAUUSD Has it started a Bear Cycle according to the Dollar??Gold (XAUUSD) may be rising early into the week on news of a potential U.S. government opening but remains heavily rejected from the Highs of the past 3 weeks.
At the same time, the U.S. Dollar Index (DXY illustrated by the black trend-line) has been staging its first legitimate bottom since December 2020 and is rebounding. That DXY's bottom came a few months after Gold's top for that Cycle. The result was the start of Gold's new 2-year Bear Cycle.
In fact that DXY bottoming pattern was also present in 2011, right before Gold topped this time. This suggests that the current DXY bottom has the potential to start a new multi-year rally, hence a new Bear Cycle for Gold.
This pattern is further strengthened by the fact that Gold has formed a Quadruple Top on its 1W RSI Resistance Zone, similar to both of its previous Cycle Top patterns since 2011.
Is the Dollar signaling a Bear Cycle on Gold?
-------------------------------------------------------------------------------
** Please LIKE 👍, FOLLOW ✅, SHARE 🙌 and COMMENT ✍ if you enjoy this idea! Also share your ideas and charts in the comments section below! This is best way to keep it relevant, support us, keep the content here free and allow the idea to reach as many people as possible. **
-------------------------------------------------------------------------------
💸💸💸💸💸💸
👇 👇 👇 👇 👇 👇

Gold’s Calm Before the Storm – Triangle Ending Soon!Over the past 10 days , many traders—especially those working on 15-minute and higher timeframes—might have found Gold a bit tedious as it's been somewhat range-bound.
Right now, Gold ( OANDA:XAUUSD ) is sitting in a Support zone($4,004 – $3,895) and is also relatively close to a Resistance zone($4,046 – $4,004) .
From a Classical Technical Analysis standpoint on the 1-hour timeframe, it looks like gold has formed a Symmetrical Triangle and it's currently moving near the upper line of this triangle. Additionally, there's a small ascending channel that has formed over the last couple of days, which is something to keep in mind.
In terms of Elliott Wave theory, Gold might be forming a Contracting Triangle that could be completed by the time it finishes wave E.
I expect that Gold may decline at least to the lower line of the symmetrical triangle in the coming hours. If it breaks that lower line , we might see further downside and a clearer direction for gold’s main movement. Otherwise, it could bounce again.
Second Target: $3,913
Stop Loss(SL): $4,04(Worst)
Please respect each other's ideas and express them politely if you agree or disagree.
Gold Analyze (XAUUSD), 1-hour time frame.
Be sure to follow the updated ideas.
Do not forget to put a Stop loss for your positions (For every position you want to open).
Please follow your strategy; this is just my idea, and I will gladly see your ideas in this post.
Please do not forget the ✅ ' like ' ✅ button 🙏😊 & Share it with your friends; thanks, and Trade safe.

XAUUSD Shutdown end has given momentum?Hello traders, this is a complete multiple timeframe analysis of this pair. We see could find significant trading opportunities as per analysis upon price action confirmation we may take this trade. Smash the like button if you find value in this analysis and drop a comment if you have any questions or let me know which pair to cover in my next analysis.

Gold holds above 4050 — market consolidating before next moveMarket Overview
Gold (XAU/USD) is trading around $4056/oz, holding firm above the $4050 psychological level after strong Asian session gains. Safe-haven demand and dovish Fed expectations continue to support sentiment, though momentum is slowing near resistance.
📊Technical Analysis
• Resistance: $4062 – $4075
• Support: $4042 – $4030
• EMA50 (H1): price stays above EMA, confirming short-term bullish bias
• Pattern: consolidation above $4050; breakout above $4062 may target $4080
• Momentum: RSI near 65, still bullish but weakening slightly
💡Outlook
Bias remains bullish, but minor pullback likely before confirmation. A drop below $4042 would limit upside momentum.
🎯Trade Idea
🔺 BUY XAU/USD
Entry: $4042 – $4045
🎯 TP: 40 / 80 / 200 pips
🛑 SL: $4036

Ending US G. shutdown could bring GOLD to daily support?US government shutdown has slowed longer term trend on XAUUSD with 2 weeks of bearish move finally formed an weekly inside bar which is the lowest volatity in the last 12 weeks! however, as there is bearish rejection, with potential ending of shut down could lead GOLD to drop again to the daily support to 3885.00 or lower?
as 3 weeks price action is showing a continued bearish move, any break from the weekly high, price may bring the price back below the weekly low which potentailly create a lowertimeframe bearish trend.
Therefore, weekly high is to watch for possible rejection, once price rejects, once down trend coinfirms, we will be looking for sell set up to daily support level.

GOLD (XAUUSD): Support & Resistance Analysis for Next Week
Here is my structure analysis for Gold for next week.
Support 1: 3868 - 3927 area
Support 2: 3766 - 3830 area
Support 3: 3690 - 3736 area
Resistance 1: 4023 - 4109 area
Resistance 2: 4187 - 4245 area
Resistance 3: 4357 - 4383 area
As we discussed earlier, the price is stuck within a range now
and we see a consolidation.
With the absence of high impact fundamentals, a sideways price action
will likely continue.
❤️Please, support my work with like, thank you!❤️
I am part of Trade Nation's Influencer program and receive a monthly fee for using their TradingView charts in my analysis.

Will gold's rebound be followed by another decline?It's hard to explain in a few words. By Friday, the market was still fluctuating and oscillating. Gold had just reached a very critical juncture. Is there anything strange about the current position? No, not really. We've seen 4000 points multiple times since Monday, but the candlestick patterns and their arrangement have gradually turned 4000 into a significant resistance level. Two trend lines are evidence of this. First, there's the downtrend line at the top, which is right around 4000. I know it broke down, but does breaking down mean it has stabilized? We definitely shouldn't rush to make a decision.
Moreover, the upward trend line at the bottom is clearly over, and the expected resistance level is exactly the same as yesterday's level around 4020. If you look at it this way, it's a perfect double top pattern. I don't need to say what this pattern should do, it's definitely bearish. You can also put the stop loss above 4030, a loss of only about 10 US dollars, which is quite cost-effective. If it can break through 4030, then there's no need to trade anymore, just in case gold goes crazy. It's quite comfortable like it is now.
Finally, there's the issue of targets. I'm actually struggling with this too. Today is the last trading day of the week, and holding positions over the weekend isn't ideal. However, assuming 4018 really did top out and the price actually fell, exiting midway would be a huge loss, and it might be difficult to find a good entry point later. Regardless of how much it could fall, at least after this double top pattern formed, gold breaking below 3960 shouldn't be a major problem. Conservatively speaking, I'd suggest aiming for 3980, depending on whether you're a short-term trader.
Since the price of 3960 has encountered support and rebounded multiple times this week, there's no need to set a target at 3960. In other words, if it really drops to 3960, it might go down, resulting in a profit of about $40. Let's just see if it reaches 3980. As for whether to go long again later, I still suggest avoiding unnecessary trading. Everyone keeps saying they want to see the US government reopen, but it's been two days since Trump suggested ending the lengthy debates, and there's been no new information, not even news of a vote.
After such a long closure, and the second time the non-farm payrolls report was missed, even inflation statistics are being compiled, so why isn't employment data being collected? If I were to speculate maliciously, I'd say it's because employment is simply unsustainable. Just think about how long the closure lasted in October; aside from everything else, how much of the workforce has been lost officially? Not to mention the current situation where businesses have low demand. Previously, layoffs were slow and hiring was gradual, but now layoffs are being accelerated and hiring is being reduced. I really don't know how shocking the non-farm payrolls report will be. This is why I expect the market to fall at the open and then rise. The data is too uncertain, and it doesn't look like good news no matter how you look at it. Let's wait and see. I'm actually hoping that the market will break through this level starting from the opening.

Gold consolidates near 4000 as market awaits breakout1️⃣ Market Overview:
Gold (XAU/USD) climbed to $4008 earlier but was quickly sold off back to $3990, showing a strong tug-of-war between buyers and sellers.
Currently trading around $3998–$4002, the market remains in a tight consolidation phase ahead of potential volatility in the U.S. session.
The USD remains steady, while U.S. bond yields stay elevated — both limiting gold’s short-term upside momentum.
2️⃣ Technical Analysis:
• Resistance: $4008 – $4015 – $4025
• Support: $3990 – $3985 – $3972
• EMA50 (H1): around $3996 → acting as short-term dynamic support.
• RSI (H1): neutral near 50 → market still awaiting a decisive signal.
• Multiple spinning top candles on H1 indicate accumulation and indecision.
3️⃣ Outlook:
Gold continues to move sideways between $3990–$4010, showing price compression before a breakout.
If H1 closes above $4015, the bullish momentum could extend toward $4025–$4040.
However, a drop below $3988 could trigger another correction toward $3975.
4️⃣ Trading Strategy:
🔻 SELL XAU/USD
Entry: $4008 – $4012
🎯 TP: 40 / 80 / 200 pips
🛑 SL: $4016
🔺 BUY XAU/USD
Entry: $3975 – $3977
🎯 TP: 40 / 80 / 200 pips
🛑 SL: $3971

XAU/USD | Gold Rejected Again! Mid-Term Target Could Reach $3550By analyzing the Gold chart on the 2-hour timeframe, we can see that after the previous analysis, price started to rise but faced strong selling pressure when it entered the supply zone between $4016 and $4020.
Recently, Gold dropped to around $3978 and is now trading near $3990. The previous analysis remains valid — as long as Gold doesn’t break above $4040, the main scenario is still bearish, and we could even see a deeper correction toward $3550 in the mid-term.
This analysis will be updated soon — stay tuned for some powerful trade setups!
Please support me with your likes and comments to motivate me to share more analysis with you and share your opinion about the possible trend of this chart with me !
Best Regards , Arman Shaban
Gold sideway around $4000 — waiting for a decisive breakout1️⃣ Market Overview:
Gold (XAU/USD) is currently fluctuating between $3994–$3998, maintaining a narrow range of $3990–$4000 for several hours.
The market is lacking fresh momentum as investors await upcoming U.S. economic data.
Both the USD and Treasury yields are moving sideways, keeping gold in consolidation mode without a clear breakout.
2️⃣ Technical Analysis:
• Resistance: $4005 – $4012
• Support: $3985 – $3975
• EMA50 (H1): holding near $3989 → short-term dynamic support.
• Consecutive small-bodied H1 candles with balanced wicks indicate a strong tug-of-war between buyers and sellers.
• RSI (H1) remains neutral around 50 → market is waiting for a breakout signal.
3️⃣ Market Outlook:
• This is a consolidation phase before a potential breakout, likely to occur within the next few hours.
• If H1 closes above $4005, gold could extend its rally toward $4025–$4040.
• Conversely, if price breaks below $3985, a short-term correction could be triggered toward $3970–$3955.
4️⃣ Trading Strategy:
🔺 BUY XAU/USD
Entry: $3985 – $3982
🎯 TP: 40 / 80 / 200 pips
🛑 SL: $3979
🔻 SELL XAU/USD
Entry: $4012 – $4015
🎯 TP: 40 / 80 / 200 pips
🛑 SL: $4019

The bears' rhythm is clear, and their direction remains firm!Gold's early morning dip yesterday did not continue, and it even broke through the important resistance level of 3990 during the European session. Today, it broke through the 4000 mark, reaching a high of around 4020, which is the resistance level we predicted earlier. The price has accurately reached the 4020-4030 rebound range, and then quickly fell back to around 3978 and fluctuated. I believe that those who followed the plan have made a steady profit. Judging from the current trend structure, gold is likely to continue its oscillating rebound, but the short-term rebound space is limited. The key resistance area to watch is still 4020-4030. If the rebound fails to break through the resistance, it will still be a good opportunity for short sellers to position themselves. In terms of strategy, we will continue to focus on shorting on rallies, entering positions in batches with small positions, controlling risks, and moving forward steadily. If you've been struggling with your recent trading and want to avoid pitfalls in complex market conditions, feel free to contact me. I'll do my best to help you clarify your thinking and master your own trading rhythm.

GOLD (XAUUSD): Deep Consolidation
This week is very slow for Gold.
The market is stuck within a wide horizontal range on a daily time frame.
With the absence of high impact US fundamentals, I think that probabilities will be high that the market will keep consolidating.
The best strategy to follow for now is to look for trading opportunities from the boundaries of the underlined parallel channel: selling from the resistance and buying from the support after a confirmation.
As the price is closer and closer to the resistance, wait for its test and then look for selling.
That is the plan so far.
❤️Please, support my work with like, thank you!❤️
I am part of Trade Nation's Influencer program and receive a monthly fee for using their TradingView charts in my analysis.
