Gold holds gains but faces strong resistance at $3975📊 Market Overview:
Gold prices remain steady around $3960–$3965, sustaining upside momentum after breaking above the key $3950 resistance. The market is supported by expectations that the Fed may cut rates sooner, while a weaker USD continues to bolster gold. However, profit-taking pressure around $3970–$3975 is slowing the rally ahead of the U.S. session.
📉 Technical Analysis:
• Key Resistance: $3975 – $3985 – $4000
• Nearest Support: $3955 – $3948 – $3935
• EMA: Price is above EMA 09 & EMA 20 (H1) → short-term trend remains bullish.
• Candlestick & Momentum: H1 candles are holding above the $3950 breakout zone, confirming ongoing buying strength, though RSI nearing overbought may trigger a minor correction.
📌 Outlook:
Gold remains in a short-term uptrend above $3955. A clear break above $3975 could open the door to $3985–$4000, while a drop below $3955 may trigger a pullback toward $3948–$3935 before any rebound.
💡 Trading Strategy Suggestion:
🔺 BUY XAU/USD at: $3935 – $3932
🎯 TP: 40 / 80 / 200 pips
❌ SL: $3929
🔻 SELL XAU/USD at: $3975 – $3978
🎯 TP: 40 / 80 / 200 pips
❌ SL: $3981
Goldsignals

technical analysis of your provided XAU/USD (GoldTimeframe: 15 minutes
Current Price: $3,963.81
Trend Structure: Price recently broke out from a descending channel.
Key Levels:
Support Zone: $3,920 – $3,940
Immediate Resistance: $3,980
Target Zone: $4,142
📉 Technical Breakdown
Descending Channel Breakout
The chart shows gold had been moving in a clear downward channel.
The recent candles show attempts to break above the upper trendline, suggesting potential bullish momentum building up.
Support Level
A strong demand zone is visible around $3,920 – $3,940.
This zone has been marked as a possible retest area before continuation to the upside.
Price Projection
The chart projects a bullish scenario, where price may retrace slightly to support before targeting the $4,142.60 level.
This suggests a swing-buy setup, with confirmation depending on a strong bounce from the support level.
Market Structure
The formation of higher lows near the lower boundary of the channel signals momentum reversal.
A confirmed breakout with volume above $3,980 will lik TVC:GR10Y TVC:GR02Y EURONEXT:PSI1! EURONEXT:EV6X2025 EURONEXT:GE8Z2025 EURONEXT:PO6X2025 ely validate the bullish continuation.
🎯 Trading Plan Suggestion (Analytical View)
Buy Zone: $3,940 – $3,950 (after confirmation candle)
Take Profit Target: $4,142
Stop Loss: Below $3,915 (to protect against false breakout)
⚠️ Notes
Watch for price rejection near $3,980, as it could form temporary consolidation. EURONEXT:PO6X2025 EURONEXT:SNAX2025 EURONEXT:EV8Z2025 EURONEXT:PSI1! EURONEXT:XA8Z2025 EURONEXT:XA6X2025 EURONEXT:PO8Z2025
If price closes below $3,920, bearish momentum may resume.

XAU/USD : Gold Breaks $4,000 Support – Can Bulls Hold the Line?By analyzing the Gold (XAUUSD) chart on the 2-hour timeframe, we can see that after rising to $4,138 and entering the marked supply zone, gold faced strong selling pressure and continued to drop, finally breaking below the $4,000 support and reaching $3,971.
As shown on the chart, this area is a key demand zone, and we expected a reaction here.
If gold manages to hold above the current level, we could see a short-term bounce toward $4,015. This analysis will be updated soon!
Please support me with your likes and comments to motivate me to share more analysis with you and share your opinion about the possible trend of this chart with me !
Best Regards , Arman Shaban

GOLD (XAU/USD) – 15-Minute Chart AnalysisCurrent Price: 4006.53
Trend: Short-term bearish
🔍 Chart Breakdown
The price is moving within a descending channel, indicating a continuation of the bearish momentum.
There is a key resistance zone around 4035–4060, highlighted in the shaded area. This zone aligns with previous structure and upper trendline resistance.
The market is currently making a minor pullback toward this resistance area after touching the lower boundary of the descending channel.
📉 Expected Move
The purple projection suggests a pullback to the resistance zone, followed by a strong rejection downward.
The target level is set around 3920.72, which corresponds to a previous swing low and a possible completion of the bearish wave.
⚙️ Trading Outlook
Direction Entry Zone Stop Loss Take Profit Confirmation
Sell 4035–4060 4075 3920 Rejection candle or bearish engulfing at resistance
📊 Summary
Gold remains in a short-term downtrend, and the best opportunity is to wait for price to test resistance (4035–4060) before considering short positions targeting 3920.
A breakout above 4075 would invalidate this bearish setup and could signal a potential trend reversal. LME:CA1! LME:MC1! LME:SN1! LME:LH1! LME:SC1! LME:AH1! LME:CO1! LME:ZS1! LME:PB1! LME:HC1! LME:AA1! LME:EA1! LME:ST1! LME:AN1! LME:AW1!

XAUUSDHello Traders! 👋
What are your thoughts on Gold?
Gold experienced a sharp decline last week, but found support around the $4,000 zone, leading to a modest rebound.
Since then, the price has entered a range-bound phase, oscillating between key support and resistance levels.
Current Outlook:
The next directional move depends on a breakout from this consolidation range:
A break above the resistance zone could trigger a move toward the previous high.
Conversely, a break below the support zone would likely signal a deeper bearish continuation and formation of new lows.
For now, gold remains in a neutral range, and it’s best to wait for a confirmed breakout before taking new positions.
Don’t forget to like and share your thoughts in the comments! ❤️

Gold breaks below $4000 – Downtrend extends toward $3950📊 Market Overview
Gold prices continued to drop sharply today, falling to around $3970/oz after breaking the key psychological level of $4000. Profit-taking pressure and a stronger USD weighed on the metal. Rising U.S. Treasury yields and expectations that the Federal Reserve may delay rate cuts further weakened investors’ appetite for gold.
🧭 Technical Analysis
• Trend: Strongly bearish; H1–H4 charts show an extended downward wave.
• Resistance (near): $3988 – $4005
• Resistance (upper): $4025 – $4040
• Support (near): $3950 – $3938
• EMA 50 & 200 (H1): EMA50 crossing below EMA200 confirms bearish bias.
• Candlestick pattern: Series of long-bodied bearish candles showing strong selling momentum.
• RSI (H1): 28 – oversold zone; possible short-term technical rebound.
💡 Outlook
Gold remains in a deep correction phase after several weeks of strong gains. The area between $3950–$3938 may trigger technical buying or short covering. If prices fail to break above $4005, the downtrend could extend toward $3920–$3900.
⚙️ 4. Trading Strategy
🔻 SELL XAU/USD : $4000 – $4003
🎯 TP: 40 / 80 / 200 pips
🛑 SL: $4007
🔺 BUY XAU/USD : $3938 – $3941
🎯 TP: 40 / 80 / 200 pips
🛑 SL: $3934

gold analysis 30/9/2025 ( The Gold Map )Based on gold analysis using My own strategy that I use digital analysis combined with mathematics and physics :
Selling Zones :
3869 - 3881
3901 - 3922
3936 - 3951
3976 - 3994
4008 - 4020
4033 - 4056
4101 - 4118
4137 - 4157
4187 - 4202
4264 - 4285
4346 - 4362
buying zones
3778 - 3764
3751 - 3761
3717 - 3738
3693 - 3710
3670 - 3688
3654 - 3668
3636 - 3648
3612 - 3628
3596 - 3607
3561 - 3579
3503 - 3523

XAUUSD Best level to sell is this.Gold (XAUUSD) has turned bearish, at least on the short-term, as it broke below its 4H MA50 (blue trend-line) for the first time in a month and is headed for its 4H MA200 (orange trend-line).
Having made a Double Top at the start of the downtrend, the pattern that seems to be emerging is a Channel Down, with the last such formation seen in April - May.
So far the 4H RSI sequences between the two patterns are identical, so we expect a rebound now, which can give us the most optimal level to short again near the top of the Channel Down.
A break above 0.786 invalidates this, but as long as it holds, our Target will be the -0.236 Fibonacci extension at 3920 just like on May 15, which also hit its 1D MA50 (red trend-line).
-------------------------------------------------------------------------------
** Please LIKE 👍, FOLLOW ✅, SHARE 🙌 and COMMENT ✍ if you enjoy this idea! Also share your ideas and charts in the comments section below! This is best way to keep it relevant, support us, keep the content here free and allow the idea to reach as many people as possible. **
-------------------------------------------------------------------------------
💸💸💸💸💸💸
👇 👇 👇 👇 👇 👇

Gold Pullback or Reversal? Key Zone Ahead!As I expected , Gold ( OANDA:XAUUSD ) started to drop thanks to the Double Top Pattern and reached its target at the Support zone($4,011 – $3,981) .
Now, do you think Gold will start dropping again, or will it resume its recent weeks’ uptrend?
Today, I’m going to do a short-term 15-minute analysis of Gold , so stay tuned.
At the moment, Gold is approaching a Resistance zone($4,192 – $4,137) —also a Potential Reversal Zone (PRZ) —and moving within an ascending channel . Overall, the recent moves in Gold over the past couple of days look like a pullback to the previous Support zone($4,192 – $4,137) .
From an Elliott Wave perspective , it seems that Gold , given the momentum of its recent drop, is completing corrective waves, and we should expect another decline .
I expect Gold to start dropping again from the Resistance zone($4,192 – $4,137) and PRZ , and AFTER breaking the lower line of the ascending channel , it could fall at least down to around $4,039(First Target) .
Second Target: Support zone($4,011 – $3,981)
Stop Loss(SL): $4,222
Please respect each other's ideas and express them politely if you agree or disagree.
Gold Analyze (XAUUSD), 15-minute time frame.
Be sure to follow the updated ideas.
Do not forget to put a Stop loss for your positions (For every position you want to open).
Please follow your strategy; this is just my idea, and I will gladly see your ideas in this post.
Please do not forget the ✅ ' like ' ✅ button 🙏😊 & Share it with your friends; thanks, and Trade safe.

Gold rebounds from lows – key levels to watch: 4100 & 40081. Market Overview
Gold (XAU/USD) recovered from an early drop to $4054, now trading around $4069–$4070 as technical buying emerges near support. The market is consolidating after last week’s decline, with short-term momentum turning neutral.
2. Technical Analysis
• Resistance 1: $4100 – short-term top with EMA50 (H4) confluence.
• Resistance 2: $4135 – strong medium-term barrier.
• Support 1: $4045 – key intraday base.
• Support 2: $4008 – major medium-term floor.
• EMA20 (H1): $4078 acting as dynamic resistance.
• RSI (H1): recovering to 50 → neutral zone.
The overall structure remains slightly bearish, but candles show buyers defending the $4050 area effectively.
3.Outlook
Gold is in a technical recovery within a broader downtrend. A confirmed breakout above $4085–$4100 could target $4118–$4135.
Failure to hold above $4045 may reopen a path toward $4022–$4008.
4.Trading Plan
🔻 SELL XAU/USD : $4102–$4105
🎯 TP: 40 / 80 / 200 pips
🛑 SL: $4109
🔺 BUY XAU/USD: $4045–$4048
🎯 TP: 40 / 80 / 200 pips
🛑 SL: $4041

DXY Weekly Outlook - Impact on XAU/USD & EUR/USD📊DXY Weekly Outlook - Impact on XAU/USD & EUR/USD
On the weekly timeframe, the U.S. Dollar Index (DXY) has shown a clear Market Structure Shift (MSS) after retesting a key support zone, identified as a weekly breaker block.
This technical setup suggests a bullish outlook for the upcoming week. 📈
A strengthening dollar typically translates into a weaker Euro and potential downward pressure on Gold (XAU/USD) due to their negative correlation with the USD.
In addition, there is engineered draw on liquidity to the upside, supported by an unfilled imbalance (weekly Fair Value Gap) , providing a strong indication that price may continue to seek higher levels in order to rebalance this inefficiency.
Also, we have identified a Smart Money Technique (SMT) divergence on the weekly timeframe between DXY and EUR/USD, adding strong confluence to our outlook.
Specifically, DXY has formed a lower low, while EUR/USD has created a higher high ,an indication of underlying dollar strength and bearish momentum building for EUR/USD.
On the EUR/USD weekly chart, a liquidity grab followed by a Market Structure Shift further supports our bearish bias for the pair in the coming week.
In summary:
DXY: Bullish bias 🐂
EUR/USD: Bearish bias 🐻
XAU/USD: Bearish bias 🐻
Overall, based on current structure, SMT divergence, and prior technical analysis, I expect the U.S. Dollar to strengthen in the week ahead, with EUR/USD and Gold likely to experience downward movement.

XAUUSD Analysis todayHello traders, this is a complete multiple timeframe analysis of this pair. We see could find significant trading opportunities as per analysis upon price action confirmation we may take this trade. Smash the like button if you find value in this analysis and drop a comment if you have any questions or let me know which pair to cover in my next analysis.

GOLD (XAUUSD): Support & Resistance Analysis For Next Week
Here is my latest support & resistance analysis for Gold.
Horizontal Structures
Resistance 1: 4186 - 4244 area
Resistance 2: 4358 - 4381 area
Support 1: 4040 - 4060 area
Support 2: 3942 - 3959 area
Support 3: 3870 - 3897 area
Support 4: 3766 - 3831 area
Support 5: 3691 - 3735 area
Vertical Structures
Vertical Support 1: Rising trend line
Consider these structures for pullback/breakout trading next week.
❤️Please, support my work with like, thank you!❤️
I am part of Trade Nation's Influencer program and receive a monthly fee for using their TradingView charts in my analysis.

XAU/USD | Gold’s Historic Dump – Will $4,000 Hold or Break?By analyzing the Gold chart on the 2-hour timeframe , we can see that gold experienced an extremely sharp sell-off — the biggest single-day drop in over 12 years — falling nearly $400 in less than 24 hours!
After dropping from $4,381 to $4,003 , price rebounded to $4,162, but then corrected again and is now trading around $4,051.
Given the current volatility, it’s important to watch key levels closely. As long as gold holds above $4,000, there’s potential for a recovery toward the FVG zone between $4,100 and $4,128 .
The main supply levels to monitor are $4,101, $4,114, $4,128, and $4,155 — watch how price reacts at these points!
Please support me with your likes and comments to motivate me to share more analysis with you and share your opinion about the possible trend of this chart with me !
Best Regards , Arman Shaban

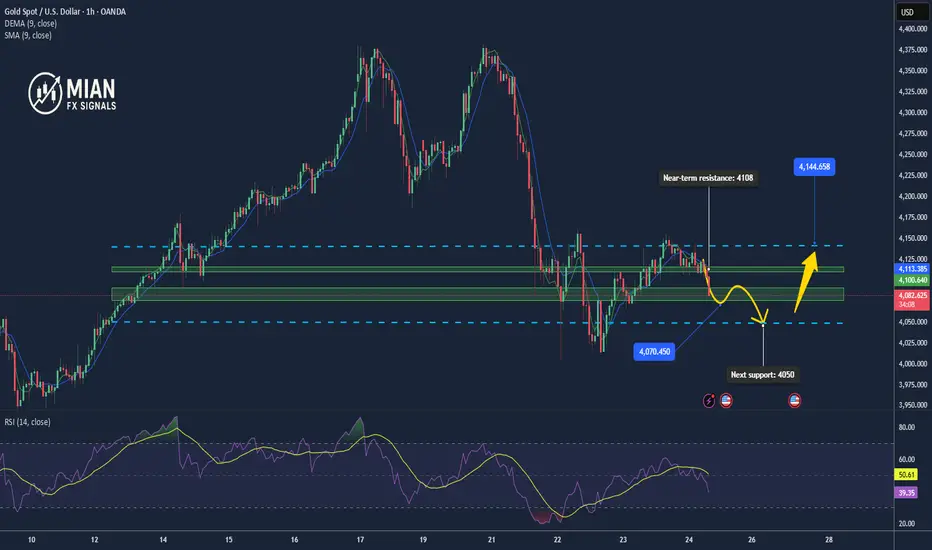
Gold weakens, retesting key 4080 supportMarket Overview
After failing to hold above the 4115–4120 zone, gold (XAU/USD) has turned lower toward 4085, signaling the loss of short-term recovery momentum.
Profit-taking pressure increased as U.S. bond yields rose again and traders turned cautious ahead of the upcoming U.S. PCE data.
Buyers are now defending the 4080–4078 support area, which will be crucial in determining the next market direction.
📊 Technical Analysis
• EMA50 (H1): 4107 → price now trading below EMA50, indicating a clear correction phase.
• EMA200 (H1): 4126 → remains the main resistance until a firm close above it.
• RSI (H1): dropped to 40, showing bearish momentum dominance.
• Near-term resistance: 4108 – 4115
• Upper resistance: 4130 – 4142
• Immediate support: 4080 – 4075
• Next support: 4062 – 4050
On the H1 timeframe, a bearish engulfing pattern is forming — a signal that deeper downside could follow if 4080 is broken.
💡 Outlook
The short-term trend has shifted back to neutral-to-bearish.
If price closes below 4078 (H1), gold could extend losses toward 4062 – 4050.
Conversely, a bullish reversal candle around 4080–4078 may trigger a rebound toward 4108–4115.
🎯 Trading Strategy
🔺 BUY XAU/USD: 4053 – 4050
🎯 TP: 40 / 80 / 200 pips
🛑 SL: 4047
🔻 SELL XAU/USD : 4108 – 4112
🎯 TP: 40 / 80 / 200 pips
🛑 SL: 4116
XAUUSD: The return of CPI and PPI newsAfter a series of absences from news, in today's trading session two CPI (Consumer Price Index) and PPI (Producer Price Index) will be announced. Therefore, OANDA:XAUUSD can be very volatile and we should be cautious in the last trading session of the week.
The CPI is forecast to be favorable for the dollar and the PPI is forecast to be slightly lower than the previous period , but we still need clearer confirmation to assess the trend of gold in the near future.
Some key levels that we need to pay attention to in today's trading session:
Resistance: , ,
Support:
Support:
Strong support:
Always be patient and wait for the price to reach the support and resistance zones above and get confirmation. Do not place limit orders or enter orders when the price is increasing or decreasing sharply.
Take advantage of the above support and resistance zones and trade short-term when the price reacts at these support and resistance zones.
Take profit when the price moves from 10 to 20 prices since entering the order at the support and resistance areas.
Wait for reactions such as Engulfing candles, Doji,... at the support and resistance zones.
Always set stop loss when trading and manage risks closely.
Note : Price may spike through support or resistance levels and then reverse. Therefore, it is crucial to patiently wait for the candle to close before entering a trade.
Victor Dan @ ZuperView

XAUUSD Geoplolitical move?Hello traders, this is a complete multiple timeframe analysis of this pair. We see could find significant trading opportunities as per analysis upon price action confirmation we may take this trade. Smash the like button if you find value in this analysis and drop a comment if you have any questions or let me know which pair to cover in my next analysis.

Gold Spot | H4 Countertrend Recovery Toward Daily Breakdown Zone
The Market Flow | Oct 23, 2025
Technical Overview
H4:
• Pivot zone active at 4073–4097 ; structure turned upward.
• Price is correcting within the broader daily downtrend phase.
• As long as this pivot zone holds, short-term bias remains constructive toward upper resistance.
• Next resistance lies at 4220–4246 (H4 supply + daily breakdown area).
• Expansion level aligns at 4360 , marking the limit of the countertrend reach.
Daily:
• The daily structure remains in correction following the prior impulsive decline.
• Current advance reflects a correction within that corrective phase — effectively, a secondary retracement.
• Breakdown pivot sits at 4040 ; reclaim above that would signal early reaccumulation.
Trade Structure & Levels
• Bias: Long above 4073
• Trigger = 4097
• Invalidation = 4073
• Path → 4220 → 4246
• Phase: Correction of a corrective wave (short-term recovery within broader downtrend)
Risk & Event Context
• No imminent macro catalyst; gold volatility subdued after recent impulse.
• Next reaction likely around the 4240–4260 region — alignment of structural resistance.
Conclusion
H4 bias remains long while holding above the 4073–4097 pivot zone. The market is retracing within a corrective context, targeting the daily breakdown and upper H4 resistance. A close below the active pivot would invalidate this recovery structure.
Disclaimer
This analysis is for informational purposes only and does not constitute investment advice, an offer, or a recommendation. Market conditions and price behavior may change without notice. Past performance is not indicative of future results. Always conduct your own research or consult a licensed financial advisor before making investment decisions.

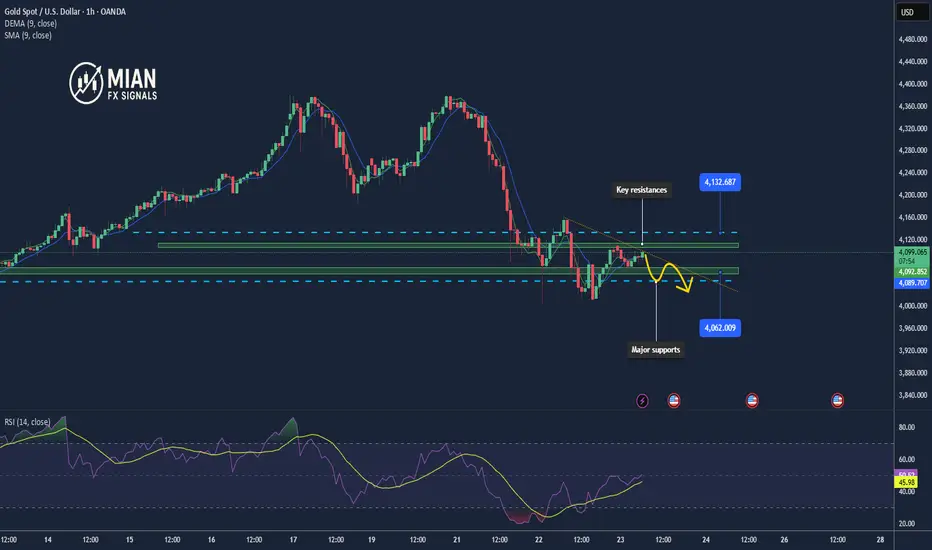
Gold consolidates at 4090 – Downside risk if 4070 breaks1. Market Overview
Gold (XAU/USD) rebounded slightly from the 4081 low after a quick wick rejection, now trading around 4090–4092. The market remains under pressure from the upper supply zone, while buying momentum is still weak. Traders are waiting for U.S. economic data later today to determine the next direction.
________________________________________
2. Technical Analysis
• Main trend: Short-term bearish
• Key resistances: 4108 – 4115 – 4132
• Major supports: 4070 – 4060 – 4045
• EMA50/200 (H1): Still in a bearish crossover, indicating ongoing downside momentum.
• H1 Candles: Narrow range with long lower wicks — showing mild buying but no strength.
• RSI (H1): Hovering around 45 – not oversold yet, leaving room for further decline.
________________________________________
3. Outlook
Gold remains in a consolidation phase after a recent drop, with no clear reversal signal yet. As long as the price stays below 4115, the short-term bearish bias prevails. A break below 4070 could push prices toward 4060 or even 4045. Conversely, a close above 4115 (H1) may trigger a short-term bullish correction.
________________________________________
4. Trading Strategy
🔻 SELL XAU/USD
Entry: 4111 – 4114
🎯 TP: 40 / 80 / 200 pips
🛑 SL: 4117
🔺 BUY XAU/USD
Entry: 4061 – 4064
🎯 TP: 40 / 80 / 200 pips
🛑 SL: 4058
XAUUSDHello Traders! 👋
What are your thoughts on Gold?
Gold has reached a key support zone after a sharp two-day drop.
From this area, we expect a corrective rebound toward the broken structure.
This retest could complete a pullback phase before the next wave of decline resumes.
A short-term rally toward the resistance zone is likely.
If price shows rejection there, the next downside targets are expected to follow.
As long as price remains below the red resistance zone, the bearish bias remains intact.
Look for bearish confirmation signals on lower timeframes before entering short positions.
Don’t forget to like and share your thoughts in the comments! ❤️

COULD GOLD (XAU/USD) BOUNCE TO THE UPSIDE OR DROP?GOLD (XAUUSD) is currently being held by a strong support trend line which is is struggling to breakthrough.. however, it is currently in a new downtrend and could continue to fall to the downside.
If The support trendline has been broken, this will be a great sell opportunity.. if it struggles to break, then it will be a great buy opportunity. Keep an eye!

Double Top Confirmed! Is Gold About to Fall Deeper?As expected from my previous idea , Gold touched its target of $4,183 ( the double top pattern’s target(Small) ). Before reaching that target, it had some ups and downs over the past few days, mainly due to the ongoing US-China tensions .
Gold is trading near a Support zone($4,193 – $4,156) .
From a classical technical analysis perspective, it’s forming a clear double top pattern on the 1-hour timeframe . There’s also a regular bearish divergence (RD-) visible between the two peaks of the double top.
From an Elliott Wave theory standpoint, it looks like Gold has started its corrective wave. If the Support zone($4,193 – $4,156) and the double top pattern’s neckline break , we can expect further downside .
I expect that after breaking the Support zone($4,193 – $4,156) and the neckline , Gold could drop at least to around $4,083(First Target) .
Second Target: $4,057
Stop Loss(SL): $4,385(Worst)
Note: Keep in mind that given the ongoing US-China tensions, any news could invalidate this analysis. So it’s more important than ever to manage your risk carefully these days.
Please respect each other's ideas and express them politely if you agree or disagree.
Gold Analyze (XAUUSD), 1-hour time frame.
Be sure to follow the updated ideas.
Do not forget to put a Stop loss for your positions (For every position you want to open).
Please follow your strategy; this is just my idea, and I will gladly see your ideas in this post.
Please do not forget the ✅ ' like ' ✅ button 🙏😊 & Share it with your friends; thanks, and Trade safe.

GOLD (XAUUSD): Important Supports to Watch
As Gold continues an extended correction,
here are significant supports to watch.
Horizontal Structures
Support 1: 4040 - 4060 area
Support 2: 3942 - 3959 area
Support 3: 3870 - 3897 area
Support 4: 3766 - 3831 area
Support 5: 3691 - 3735 area
Vertical Structures
Vertical Support 1: Rising trend line
A trend line and horizontal Support 1 compose a demand zone.
That will be the first potentially significant zone for a pullback.
In case of its breakout, the price will reach at least Support 2 then.
❤️Please, support my work with like, thank you!❤️
I am part of Trade Nation's Influencer program and receive a monthly fee for using their TradingView charts in my analysis.
