Gold 2026 Outlook: Risk-On Pullback, Geopolitics Keep Bull TrendFOREXCOM:XAUUSD Gold 2026 Record Prices Risk On Markets & Rising Global Uncertainty (8 January 2026)
🔍📈 Welcome back to Trade with DECRYPTERS
📊 MARKET OVERVIEW
On January 7, 2026, gold prices pulled back after recent strong gains, as investors booked profits amid a broader risk on market mood. Spot gold briefly tested the $4,500 level before slipping toward the mid $4,430s, while COMEX futures also closed modestly lower. The decline followed several sessions of rally driven by geopolitical tensions linked to US actions in Venezuela. Attention shifted toward key US economic data that could shape Federal Reserve rate cut expectations.
🧩 KEY FUNDAMENTALS
💵 US Monetary Policy Supportive
Expectations of 1 to 2 Fed rate cuts in 2026 lower the opportunity cost of holding gold.
💲 US Dollar Mild Headwind
The dollar remains slightly firm short term, but broader long term weakness supports gold.
📉 Inflation & Real Yields Moderately Supportive
Cooling inflation and softer real yields enhance gold’s appeal as an inflation hedge.
🏦 Treasury Yields Mixed
Lower real yields improve gold competitiveness versus bonds.
🏆 Central Bank & Investment Demand Structurally Bullish
Strong central bank buying and ETF inflows provide a solid long term price floor.
🌍 GEOPOLITICS
🚨 US Venezuela Intervention Key Trigger
The capture of Venezuela’s president sharply increased global risk perceptions, driving strong safe haven demand for gold.
🔥 Middle East Tensions
Ongoing instability involving Iran, Israel, Lebanon, and Gaza keeps geopolitical risk premiums elevated.
⚔️ Russia Ukraine War
The prolonged conflict continues to add background uncertainty, supporting gold as a hedge.
🌐 US Expansionist Rhetoric
Aggressive policy signals on Greenland, trade tariffs, and regional security raise fears of global instability and de dollarization.
⚖️ RISK ON RISK OFF ANALYSIS
🔁 Inverse Relationship
Higher US Treasury yields increase the opportunity cost of holding gold, while lower yields support gold.
📈 Current Yield Level
US 10 year yield around 4.14% to 4.18%, easing slightly and reducing pressure on gold.
📉 Real Yields Matter
Falling real yields after inflation remain supportive for gold prices.
📊 Yield Curve Inversion
Ongoing inversion signals growth concerns, indirectly favoring gold as a hedge.
⚠️ Near Term Risk
A sharp rise in yields could cap gold gains, while softer data could trigger rallies.
🔗 MARKET CORRELATION
💵 US Dollar DXY
Stable near 98.7. A firmer dollar is a mild headwind, but long term trends remain gold positive.
📈 Equities
Strong stock markets reflect risk on sentiment, limiting gold upside short term.
⚖️ Yields vs Gold
Gold remains elevated despite yields, as geopolitical risks offset pressure.
🔮 RISK ON RISK OFF OUTLOOK
🌤 Current Mood
Markets lean risk on, but geopolitical tensions add risk off undertones.
🛡 Gold’s Role
Gold acts as protection during sudden risk off events such as geopolitics and policy shocks.
🚀 Forward View
Continued risk on conditions may mean consolidation, while a risk off trigger could push gold toward $4,900 to $5,000 in 2026.
🧠 KEY INSIGHTS FROM CREDIBLE SOURCES
📜 Policy Uncertainty Boosting Gold
Investors are accumulating gold as a hedge against policy driven uncertainty under Trump, especially amid geopolitical and economic shifts.
⚠️ Higher Tail Risks
Trump era policies are seen as increasing fat tail risks, supporting both equities and safe haven assets like gold simultaneously.
💰 Gold Revaluation Narrative
Market discussions suggest potential gold revaluation in 2026 as a tool to address debt and balance sheet pressures.
📉 Rate Cut Expectations
Calls for ultra low interest rates have historically triggered sharp rallies in gold and silver.
🌍 Trade & Tariffs Impact
Gold is perceived as insulated from tariffs, reinforcing its appeal versus other commodities.
🛂 Immigration for Revenue Policies
Gold Card style visa programs tie gold symbolism to fiscal and immigration strategies.
🪙 Gold vs Crypto Framing
Bitcoin is often compared to digital gold, but gold remains positioned as the ultimate stable reserve asset.
🏦 Strategic Reserves Focus
Renewed attention on national gold reserves highlights trust, transparency, and monetary credibility themes.
✅ CONCLUSION
Gold’s pullback in early January reflects profit taking after a strong rally, not a breakdown in trend. Supportive Fed rate cut expectations, softer real yields, and sustained central bank demand continue to provide a solid floor. Heightened geopolitical risks, particularly the US Venezuela situation and broader global tensions, reinforce gold’s safe haven appeal. While a risk on market mood and a firm dollar may cap gains in the short term, downside appears limited.
🙌 SUPPORT THE ANALYSIS
👍 Like the post
💬 Comment your key levels
📈 Share your charts
🚀 Let’s grow together
Best Regards
M. Moiz Khattak
Founder
🟡 TRADE WITH DECRYPTERS 📊
Goldstrategy

Gold Breaks Records This Christmas — What’s Next?For the first time in history, Gold ( OANDA:XAUUSD ) has reached new all-time highs during the Christmas period, setting a remarkable record.
The question now is whether gold will continue to rise.
It’s important to note that when an asset hits all-time highs, technical analysis can become a bit more challenging, and it’s crucial to consider previous support and resistance levels.
Personally, I find that taking long positions at all-time highs can be risky due to the high likelihood of overbuying, so I tend to be more cautious about entering new long positions.
This period is usually characterized by consolidation or mild directional moves, rather than strong breakouts.
Important trends and decisive moves in Gold often emerge after the holidays, when liquidity returns and institutional positioning resumes in early January.
At the moment, Gold has started to decline with the new week and is moving below the resistance zone($4,513-$4,492).
From an Elliott Wave perspective, it seems that the main wave 5 may have completed at these all-time highs, and the wave patterns are clearly visible, so we can wait for correction waves.
I expect that Gold may attempt to retest the support line, and if it breaks that support lines and the support zone($4,448-$4,426), it could potentially drop to around $4,393.
What do you think? Will 2026 be another bullish year for gold, or should we expect a correction? I’d love to hear your thoughts!
First Target: Support lines
Second Target: $4,393
Stop Loss(SL): $4,529(Worst)
Points may shift as the market evolves
💡 Please respect each other's opinions and express agreement or disagreement politely.
📌 Gold Analyze (XAUUSD), 1-hour time frame.
🛑 Always set a Stop Loss(SL) for every position you open.
✅ This is just my idea; I’d love to see your thoughts too!
🔥 If you find it helpful, please BOOST this post and share it with your friends.

XAUUSD set to go another 500 pips?XAUUSD had bullish breakout early this asian session fueling by AUD breakout and DXY bearish move has boosted GOLD to remain bullish after Monday's strong breakout of weekly resistance level.
Market is maintaining series of higher low on 1h timeframe a pressure on current daily high at 4169.00
Breaking above 4169.00 and candle close in 4h or 1h can triiger buy trade targeting to 4210.00
Follow for more updates and analysis !

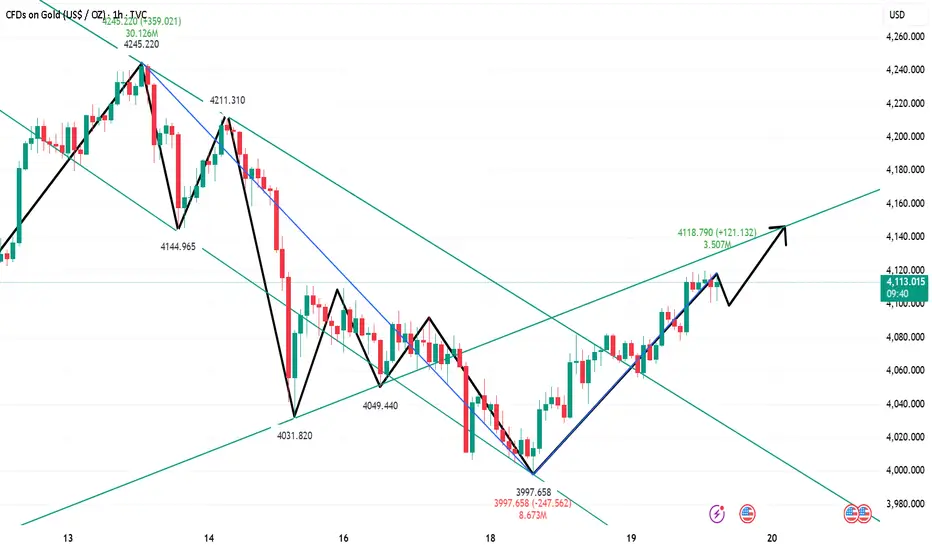
Gold pullback on November 19th: Buy on dips!The 1-hour moving average for gold has turned upwards, indicating continued upward momentum. After breaking through and stabilizing above 4100, gold is currently exhibiting a steady upward trend on the 1-hour chart. The 4090 area has formed short-term support, and buying on dips to this level presents a buying opportunity.
Gold: Buy at 4090, stop-loss at 4078, target 4150-4160;
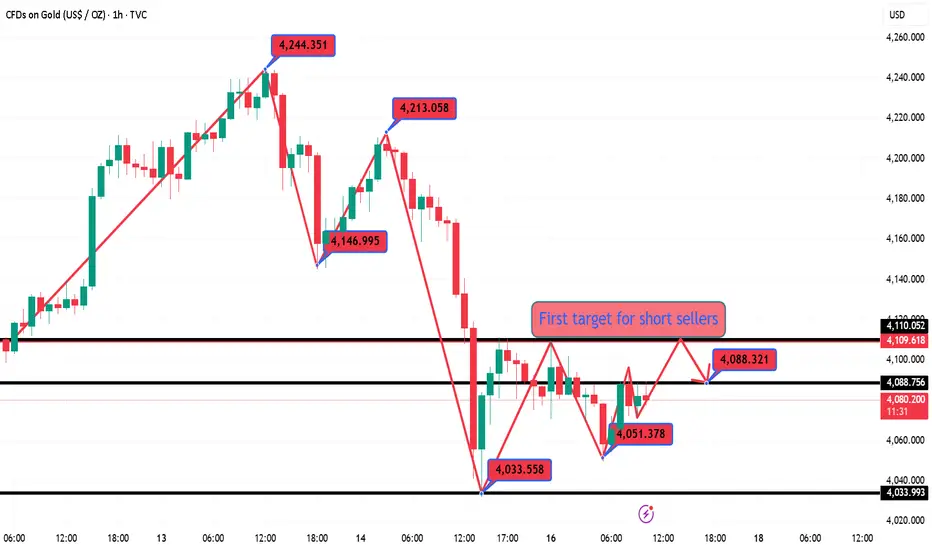
Gold Short-Term Trading Guide (November 18th)!!!The US released some unemployment claims data, and gold briefly broke through 4000 before experiencing a strong rebound. Is this rebound merely a flash in the pan due to the data, or will it help reverse the gold bullish trend?
First, we should note that gold is still generally weak. The 1-hour moving averages are still in a bearish crossover, indicating continued downward momentum. Gold is also still trading within a 1-hour downtrend channel. If gold continues to trade within this channel, the overall trend will likely remain one of oscillating decline. The upper resistance level of the 1-hour downtrend channel has now moved down to around 4068. If gold rallies below 4068, the strategy remains to sell on rallies.
Gold prices naturally fluctuate, just like the tides. Volatility creates opportunities. If gold cannot break through the 4068 level, the rebound may be short-lived. Until a break above 4068 is achieved, continue to sell on rallies.
US Session Trading Strategy:
Sell gold at 4060, stop loss at 4070, target 4000-3980;

Gold is expected to rise and then fall in the short term.After opening today, gold was pressured down by the 4110 area, finding support at around 4050 and rebounding. The 1-hour and 4-hour charts show severe oversold conditions, indicating a clear short-term stabilization. Therefore, overall, while maintaining a bearish outlook for gold, a short-term rebound is likely, with a high probability of further declines.
Key resistance remains at the 4110 area, followed by the 4140-50 area. A sustained bearish stance is warranted; an unexpected upward breakout could extend the rebound, but a decline is still expected. Key support during the European session is at the 4050 area, with the 4030-40 area being a short-term key level. A break below this level would likely lead to further declines towards the 3980-3950 and 3915 areas.
Gold pullback on November 12th: Buy on dips!The hourly moving averages for gold continue their bullish crossover and upward divergence, indicating continued upward momentum. The 4-hour chart shows gold continuing its consolidation phase, likely preparing for a breakout above the resistance level of 4160. Gold may have dipped slightly below 4100 to around 4098 before rebounding. Buying on dips above 4098 is recommended.

THE KOG REPORT THE KOG REPORT:
In last week’s KOG Report we wanted to stick to a similar plan from the week prior, looking for price to attempt either the high to short it again, or, for price to attempt to break the lower box and then give us the opportunity to long again. We had to switch to intra-day trading during the week due to the ranging and as usual, the indicators worked well giving us some good trades and we near enough got what we wanted from the KOG report analysis and the red box targets published.
So, what can we expect in the week ahead?
Potential for this range to continue during the first half of the week with the immediate resistance above at 4006-10 which will need to break in order to target the 4030 level which is what we’re looking for. For this to happen, support 3990 needs to hold us up and if we can push upside it’s that 4030 level we want to keep an eye on. Rejection there can again lead to another swoop of the lower regions but, we need to keep in mind that red box below. That is the key level of defence for the early part of the week and will need to break!
The indicators are suggesting lower at the moment but we need more confirmation and we also need to see if they fill the void left over above from Friday.
In our opinion, another choppy week ahead, more ranging and whipsawing while we accumulate and await that clear confirmation of direction. Until then, it’s level to level and intra-day Red box trading for us.
RED BOXES:
BREAK above 4004 for 4010, 4014 and 4030 in extension of the move
BREAK below 3990 for 3985, 3979, 3970 and 3965 in extension of the move
Many of you have asked what the “Bubbles/circles” are on the chart! These are the hot spots we have been sharing with you that work well as RIPs! We share the monthly results and daily hot spots and I’m sure our traders will agree, they are powerful!
Please do support us by hitting the like button, leaving a comment, and giving us a follow. We’ve been doing this for a long time now providing traders with in-depth free analysis on Gold, so your likes and comments are very much appreciated.
As always, trade safe.
KOG

The 11.7 range is narrowing; buy low and sell high.Gold has recently exhibited a typical consolidation pattern. After a brief dip to 3928 at the beginning of the week, it gradually stabilized and rebounded from Wednesday, briefly surging to 4020 yesterday, forming a V-shaped rebound overall, but failing to break out of the large consolidation range of 4060-3915. As time progresses, the range of fluctuation continues to narrow, forming a converging triangle pattern, suggesting the market is at a critical juncture in choosing a direction.
Today's trading should focus on two key price levels: 4020 represents significant short-term resistance, while 3965 is a support level that has been repeatedly tested recently. Strategically, short-term investors can buy low and sell high within the 4020-3965 range.
XAUUSD has formed a left handed cup and hadnle patternIt is finally skipping out of hand but from left hand!
Price finally managed to bouce off the top of the left handed cup and handle pattern
We are on long, on a retest re-entry possible !

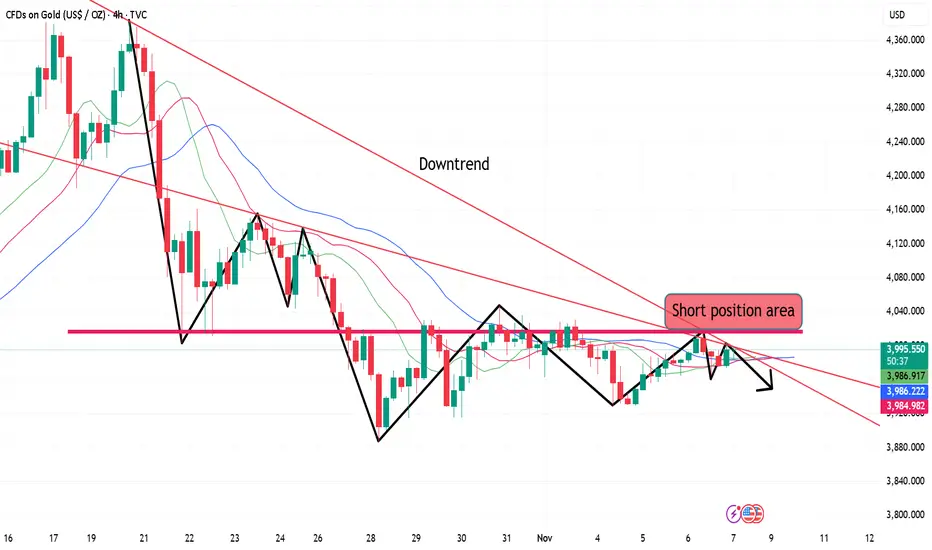
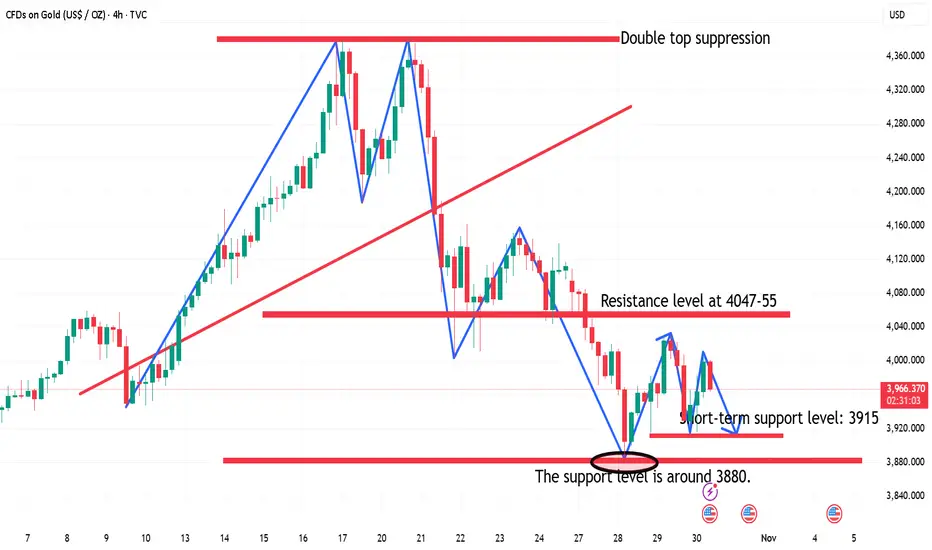
Gold prices fell back during the US session on November 5th.From the 4-hour chart, the current short-term resistance levels to watch are 3965-70 and 4020-55. Short-term support is at 3918-20, with a key support level at the previous low of 3888-90. The strategy is to sell on rallies.
Gold Trading Strategy:
1. Sell gold at 3980-70, add to the short position at 4020-25, stop loss at 4039, target 3940-3930.

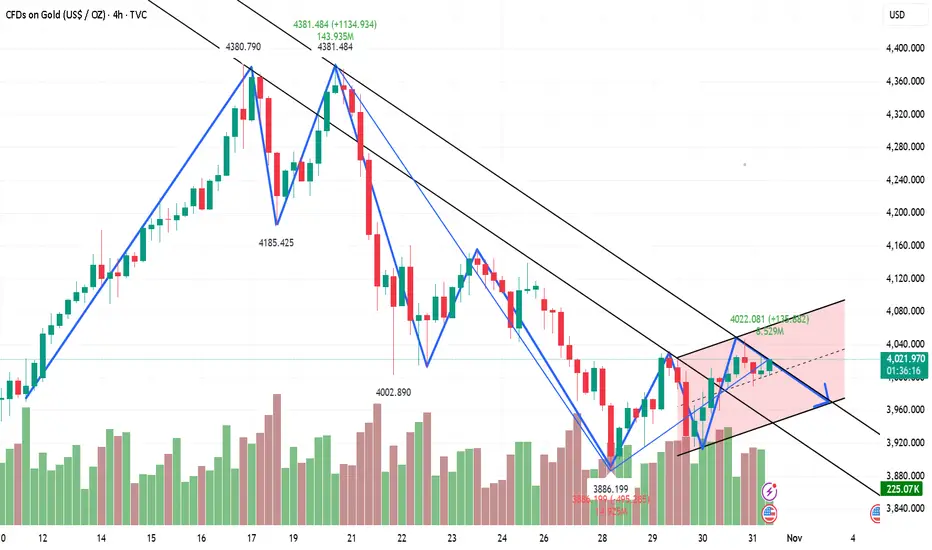
Gold prices fluctuated upwards on November 3rd, but bulls faced From the 4-hour chart, the current resistance level to watch is 4030-35, with a key resistance level at 4047-55. The short-term support level is 3965-70. The recommended strategy is to primarily sell on rallies, avoiding chasing the market and patiently waiting for key entry points. Specific trading strategies will be provided during trading hours; please pay close attention.
Gold Trading Strategy:
1. Sell gold on rallies to 4030-35, add to the short position on rallies to 4047-55, stop loss at 4069, target 3960-3965, hold if it breaks through.

October 31st Gold Intraday Short-Term Trading Guide!!!Gold prices retreated from around 4044-46 during the day, hitting a low of 3988 in the morning. Currently, it's oscillating within the 4000-4126 range. Today is the weekly and monthly close, potentially triggering a significant price movement. From a trend perspective, short-term gains remain limited. A further dip to 4000 is possible amidst the consolidation. A break below 3986/3960 could lead to a move towards 3920-3900. The recommended strategy is to sell on rallies, but be aware of the risks.
US Session Trading Strategy:
Sell near 40120-25, stop loss at 4035, target 4000-3990, continue to look for further downside if the price breaks through.
US session short-term trading strategy guidance at 10:30!From a 4-hour chart perspective, the current short-term resistance level to watch is 3978-85, with a key resistance level at 4047-55. Short-term support is at 3915-20. Trading should focus on range trading; avoid chasing the market and patiently wait for key entry points.
Gold Trading Strategy:
1. Sell gold at 3978-3985, stop loss at 4009, target 3880-3895, hold if it breaks through;
2. Buy gold at 3915-20, stop loss at 3896, target 3977-85, hold if it breaks through.
‘10.29 Buy first below 3900 and then sell!Technical Analysis:
The first resistance area above is 3960-70. Maintain a short position below this level. If the market unexpectedly breaks higher, focus on the 3995-4005 area, which remains bearish. If the market weakens, the 3945-50 area, previously the starting point for the rally, has become a source of pressure after breaking below it today.
Key support areas below are the 20-day moving average (SMA) at 3865-70 and the 50% level at 3840-45.
Trading strategy: Maintain a short position on rebounds.
Participate in the 3960-70 area, targeting a new low. After a new low, consider entering long positions based on the 20-day moving average and the 50% level.
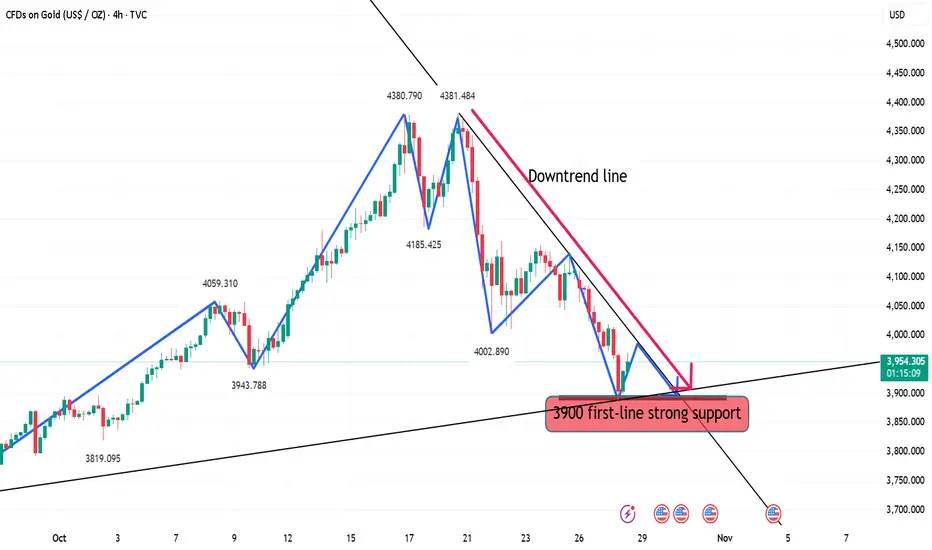
Gold finds support in the short term, target is 3950Gold has found support at 3886. A short-term rebound is expected around 3950-55. At this level, you can switch to short positions, with a focus on 3965. If it breaks through 3973 and breaks above the support level in the Asian session, abandon your short position and switch to a full long position. In the short term, we're looking for a rebound around 3950-55. Here, you can short, but be mindful of the risk.
October 28th Gold US Trading Strategy:
1. Buy around 3900-3910, stop loss at 3886, take profit at 3940-50.
2. Short around 3950, stop loss at 3965, take profit at 3910.

THE KOG REPORTTHE KOG REPORT:
In last week’s KOG Report we said we would be looking at two levels as potential for the long trades and target for the short trades. We ideally wanted price to push upside and complete the long target before turning and then completing the short target. During the early part of the week, we activated short and gave caution on longs only to see the aggressive decline which hit our short target and completed our bias level and red box targets for the week.
All in all, a decent week in Camelot with Excalibur guiding and the EA hitting another full house of completed targets on Gold.
So, what can we expect in the week ahead?
We're pondering on this bearish move and it’s giving us hints of a swing low so for that reason we’ve given the red box bias level at 4095 which will need to break for us to see a continuation of the move. Above there, we have immediate support at 4104 which if held can give us another bounce in the early sessions giving us a move upside into the 4140-50 regions initially.
Above that level there is a level sticking out sitting at 4173 with the extension level 4192 which if targeted is the level to keep an eye on for us. A break above there and it’s likely we will attempt to swing high from a lot higher up which we will need to navigate level to level. But a RIP there would be ideal if it happens with a clean reversal.
On the flip, we do want to see lower pricing on gold as we feel it’s not only needed, but it will give buyers better opportunities to get in for better positioning to carry trades upside into the higher target levels we have active. As we approach the end of the month, it's going to be another whipsaw and we would hope to complete the move, or, we'll most likely see some sideways accumulation leading into the next week.
KOG’s bias for the week:
Bullish above 4095 with the ideal target 4274
Bearish below 4095 with the ideal target 4025
RED BOX TARGETS:
Break above 4115 for 4123, 4125 and 4140 in extension of the move
Break below 4095 for 4080, 4065 and 4050 in extension of the move
Please do support us by hitting the like button, leaving a comment, and giving us a follow. We’ve been doing this for a long time now providing traders with in-depth free analysis on Gold, so your likes and comments are very much appreciated.
As always, trade safe.
KOG

10.28 Gold continues to fall to 3970For the day, we will focus on the support at 3970. If it falls below, the price will continue to fall to 3950-3900-3850. In the short term, we will focus on the 4020 line and the resistance near 4060. After breaking through 4020, the price will continue to rebound and test the 4050-4060 line. However, the main strategy for the day is still to go short.
Strategy:
Go short near 4006-4010, defend 4021, and target 3970-3940-3900-3850
The second short position above is near 4054-4060, and the target position remains unchanged.
As for the long position below, it is at 3895 and 3870.

Gold shorts are coming, rebound under pressure and short sellGold hit resistance twice today and broke new lows again. Currently, the market is fluctuating at a low level, with resistance levels decreasing and the lows falling. The overall trend remains weak. Previous support at 4047-55 has become resistance. Focus on the downside: last week's lows of 4000-4004. The 4000 level will be the first barrier for bears to break through. Key resistance from above remains around the 4047-55 level we identified earlier.
Technical Analysis:
From the 4-hour market trend, short-term resistance at 4047-55 is currently under pressure. Gold is struggling to break through this resistance. Trading strategies should prioritize shorting on rebounds. In the intermediate range, be cautious and watchful, and wait patiently for key entry points.

10.19 Gold Monday short-term analysis guide!Gold closed near 4247 on Friday. Following five consecutive daily gains, the market closed with a bearish candlestick pattern. Technical analysis suggests that gold prices are poised for a period of volatile correction. Without news stimulus, gold is expected to fluctuate within a range. Given the pullback from Friday's large bearish candlestick, Monday's focus should be on whether the decline can be sustained. If this trend isn't sustained, bulls are poised to launch a counterattack. Otherwise, gold is poised to enter a range of rebound resistance.
From the 4-hour market trend, short-term resistance is currently at 4280-4293, with a focus on 4315-23. Support is at 4185-4193. If bulls fail to achieve a sustained breakout, a period of volatile correction is imminent. Trading strategies should prioritize range-bound trading. In the middle, adopt a cautious approach, cautiously follow orders, and patiently wait for key entry points.

XAUUSD is in buy area!Price level 4205.00 is a strong liquidity sweep showign up a momentum gain on GOLD to reverse from this long term support level gold has started to bounce off the level.
As daily and long term trend continue to be bullish price is highly likely to continue to remian upside with another momentum gain from this support level. A bullish trade is high probable from the long term support level.

Accurate sniping, gold is shorted all the way.Who else has continuously arranged short orders from above 4050 and gone down all the way. Before the market closed yesterday, we arranged in advance at 3990 and accurately set a limit short order. During the opening rebound, gold only touched 3994. After perfectly activating the limit short order, it quickly fell and hit the target near 3970 in one fell swoop, with a steady profit of 200pips on a single transaction. This wave of operations is not only a manifestation of technology, but also a perfect combination of rhythm and plan execution. It once again verifies our core concept of planned trading and strict risk control, precise analysis, advance layout, and steady cashing. Looking back at the entire market, since above 4050, we have clearly stated that there is a risk of periodic correction in gold, and have repeatedly suggested the idea of shorting on the rebound. Facts have proved that planning in advance and decisive execution are better than chasing ups and downs afterwards. The rhythm of this round of decline is clear, and the short-selling-dominated pattern is obvious. We decisively enter the market in the key interval. Every high-level short order is fast, accurate, and ruthless, and we win in a steady manner.
From a technical perspective, gold completed a structural breakdown at the 4000 mark. Short-term support is focused on the 3945-3940 area. If it continues to break down, it will open up downward space to the 3920 line. The upper pressure is focused on the 4000-4015 area. Rebound pressure is still the focus of shorting at rallies. The overall rhythm is still bearish, and short-term operations are mainly based on rebound shorting.
The market never waits for anyone. Profits belong to traders who have plans and execution capabilities. Congratulations to all my friends who are paying attention. Once again, I have steadily realized profits. Strength is not something that can be expressed with words, but is the result of precise implementation of each order. Next, I will continue to track the gold fluctuation structure and lead everyone to steadily grasp the next key market opportunity.

Gold short positions above 4050 have achieved another success!Today we have been emphasizing that gold may usher in a major adjustment. In the end, gold fell below the 4,000 mark. This position is exactly the important medium-term bullish and bearish turning point that we have been adhering to for a long time. Gold broke through and fell directly during the U.S. trading session. We participated in short orders throughout the process. Gold fell sharply as expected. At present, gold has fallen below the key mark. It is likely to be mainly adjusted in the short term. There is a lack of new positive news stimulation in the near future. The market may enter the bearish home court next. The gold 1-hour moving average has turned, indicating that the bullish momentum has weakened significantly and the rebound strength is limited. The trading ideas in the future are still clear. The rebound is under pressure in the 3985-4000 area, which are opportunities to short at highs. We never do stubborn longs or shorts. Once the long and short key positions are broken, the trend has turned. Only by following the trend can we be invincible.
