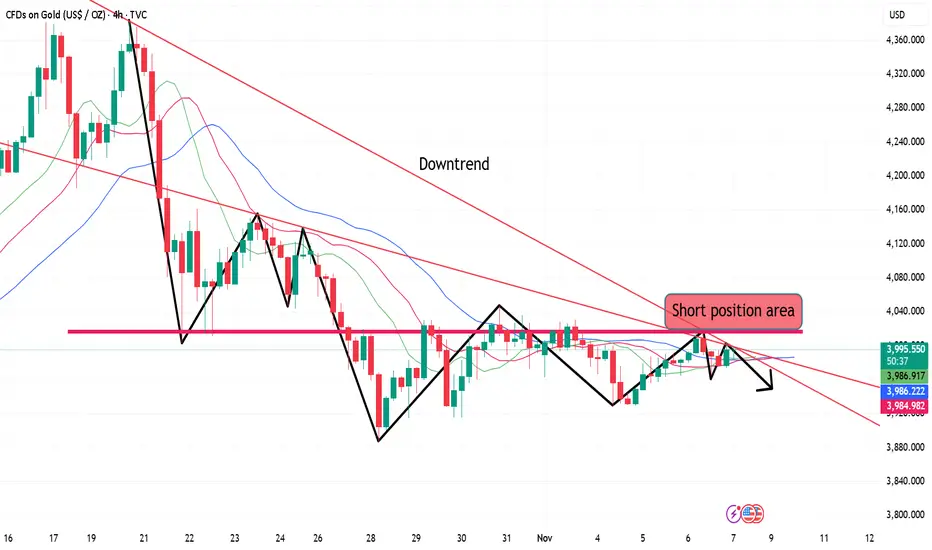
Gold bulls are losing momentum Arebound means continuingto shortLast week, the longest government shutdown in the US ended. Key economic data will take time to be released, and Federal Reserve officials have been releasing hawkish signals, reducing the probability of a December rate cut. Gold prices rose overall, boosted by a weaker dollar and safe-haven demand, reaching a high of $4245 last week. Silver followed a similar trend but rose even more, once increasing by nearly 10%. On Friday, both spot gold and silver experienced a rapid drop, narrowing the weekly gains. Gold, which reached a high of around $4210, plummeted to around $4030, a drop of up to $180. With the government shutdown over, market trends are likely to change. Gold's historical high of $4381 this year is unlikely to be surpassed this year, and even if it is, it will likely be next year. In my view, last week's high of $4245 was a secondary high. The upward trend that began on October 1st when the shutdown started is coming to an end, and a pullback to the starting point of this upward trend, around $3850, where the shutdown began, is possible.
As seen on the daily chart, gold's short-term support is currently at 4050. Since last Friday, this level has not been breached. As long as 4050 holds, gold is likely to continue oscillating within the 4050-4100 range for a few more days. However, it's important to note that if the daily chart breaks below 4050, caution is advised, as the move could accelerate, potentially targeting the 4000-3900 range. A break below 3900 would likely lead to a return to the starting point around 3850. If strong support is found, it would likely be around 3850-3800.
Secondly, looking at the short-term 4-hour chart, if gold fails to break below 4050, the next resistance levels are around 4080 and 4100. The immediate target is the 4050-4105 range. If it returns above 4100 today, it could reach around 4110. However, it's crucial that 4100 is not breached and held. If it reverses and breaks the high of 4110 from last Friday night's rebound, gold might test 4150, which could be considered the limit of this rebound. This possibility exists and should not be ignored. Of course, the overall trend is bearish, and unless it returns to the 3850-3800 range, avoid rushing into long positions.
Goldstrategy

Gold is expected to rise and then fall in the short term.After opening today, gold was pressured down by the 4110 area, finding support at around 4050 and rebounding. The 1-hour and 4-hour charts show severe oversold conditions, indicating a clear short-term stabilization. Therefore, overall, while maintaining a bearish outlook for gold, a short-term rebound is likely, with a high probability of further declines.
Key resistance remains at the 4110 area, followed by the 4140-50 area. A sustained bearish stance is warranted; an unexpected upward breakout could extend the rebound, but a decline is still expected. Key support during the European session is at the 4050 area, with the 4030-40 area being a short-term key level. A break below this level would likely lead to further declines towards the 3980-3950 and 3915 areas.
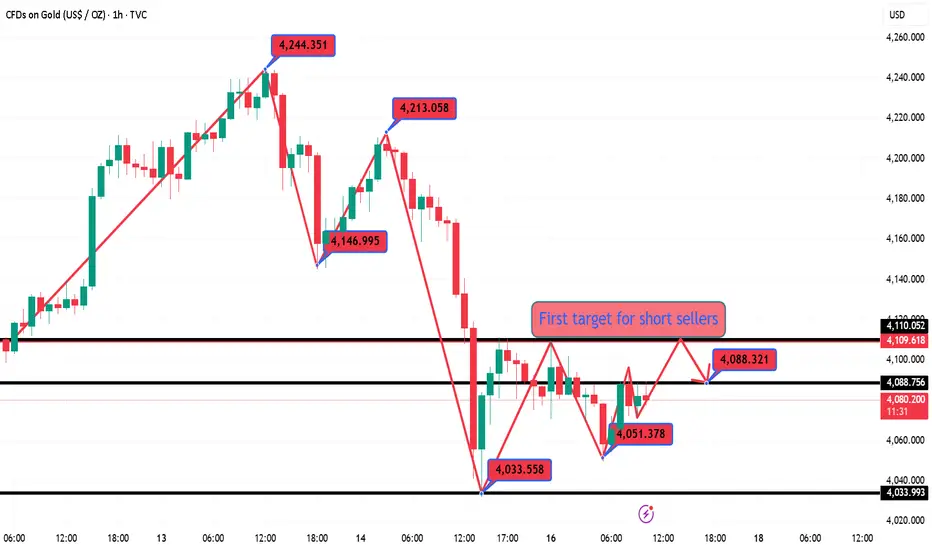
Gold's upward momentum is weak, so shorting is the only option.Gold Technical Analysis: Gold suddenly entered a downtrend at the end of last week, with a target price around 4210. On Friday, it reached a high of around 4211 before retreating, breaking below 4100 to around 4032, resulting in a large bearish candlestick on the daily chart. The question now is whether this downward trend will continue. The daily chart shows a consistent decline in highs, suggesting that the resistance level at the three key points could easily trigger a second downward reversal. Therefore, we should expect a pullback at the beginning of this week. Therefore, at the beginning of this week, we definitely expect gold prices to continue falling. However, since the fast and slow lines are still above the zero axis, even if prices fall, it will only be a pullback. Looking at the candlestick chart, the trendline support is around $4,000, which is both our target for shorting this week and a place to try to place long orders. If it breaks down, it may test the lower Bollinger Band at $3,890. However, it should be noted that the halfway resistance level of Friday's full-blown bearish candlestick is at $4,130, which is also the highest point of the rebound in the two days following the sharp drop on October 21. If gold prices break through this level again, it will mean the end of this round of pullback.
Gold rebounded slightly after the opening but continued to face pressure at higher levels and fell back again. In the short term, the 4110-4120 area has formed effective resistance. If the rebound is still pressured by the 4110-4120 area, then the gold rebound is extremely weak, and there may be some room for further adjustment. However, even if the gold rebound is slightly stronger, the resistance below 4150 still indicates a head and shoulders pattern on the 1-hour chart, favoring a short-term bias towards range-bound selling. Today's core strategy should be to sell on rallies. Although there was a technical rebound after Friday's sharp drop, the rebound strength was limited. As long as it cannot break through the key resistance of $4120, any rally is an opportunity to short. It is necessary to pay close attention to whether the rebound shows signs of exhaustion. If the rebound of the right shoulder is insufficient, the head and shoulders pattern will be officially established, and the gold price may face a deeper decline. Therefore, today's strategy is still to sell on rallies.

What's next for gold after its sharp drop?Gold Technical Analysis: Last week's gold market was incredibly exciting, like riding a crazy roller coaster. Gold, which had been soaring all the way, suddenly plummeted on Friday, dropping by $180. This plot twist caught many off guard, leaving many investors bewildered. So what will happen to gold this week? From a technical analysis perspective, the daily chart closed bearish with a significant drop, indicating substantial upward pressure in the short term. The market outlook is less optimistic. The 4000 level is crucial; if it holds, the market may consolidate for a while. However, if it breaks, it's likely to seek support around 3930 or even lower, near 3886. The 4-hour chart is currently in a consolidation phase. If the market can recover lost ground and reclaim key moving averages, the bulls still have some hope. Otherwise, the bears may continue their rampage.
Gold has formed a head and shoulders pattern on the 1-hour chart. If it cannot regain a foothold above 4150 this week, then the 1-hour rebound will form the right shoulder of the head and shoulders pattern. Therefore, if gold rebounds this week and is pressured below 4150, continue to sell on rallies. After Friday's sharp drop, there may be a rebound correction at the beginning of the week, and then we will see how strong the rebound is. As for the trading strategy this week, I think selling on rallies is the most reliable approach. If gold rebounds to around $4110-$4120 early this week, this is a key resistance zone from the previous period and also near the high point of Thursday night's rebound. It is highly likely to encounter resistance. Aggressive traders can consider shorting with a small position, with a target of $4050-$4030. For a more conservative approach, wait for a rebound to the $4140-$4150 range before placing short orders. This is the upper edge of the previous consolidation range. The initial target is $4100-$4080. If the downtrend continues, look towards the $4000 psychological level, or even lower to the $3930-$3887 area.

Gold prices fell as expected,The next big opportunity is brewingGold Technical Analysis: Let's first discuss why the price has fallen so sharply, and the core point hits the nail on the head! Expectations for a Fed rate cut have completely cooled down! This is the most direct trigger! Recent US ADP employment data has surged higher than expected, suggesting the economy isn't as weak as it seemed. The previously certain "December rate cut" has now completely changed, with some institutions even saying there might only be one rate cut this year! It's important to understand that gold is a non-interest-bearing asset. As interest rates are expected to rise, the cost of holding gold increases, causing funds that previously rushed to buy to immediately withdraw. With a wave of selling, how can the price of gold not collapse?
Today, after gold broke through the key support level of 4150, we suggested shorting. As expected, it fell sharply. Unfortunately, gold continued to decline without giving us another chance to rebound. So let's wait patiently for an opportunity. We can't rush into the market in the current situation. Be patient and wait. If there's no opportunity, we'll try again next week. Have a peaceful weekend. As market expectations for a December rate cut continue to decline, gold prices are under increasing pressure.
Tonight, watch the 5-day moving average around 4035-4030 for gold. If it closes below this level today, market sentiment at the beginning of next week will likely be bearish and expect a correction. The 4035-4030 area is quite important, as it was the breakout point for the bulls on Monday and a previous support/resistance level. Given that it's Friday, bears shouldn't be greedy before a breakout and should wait for the weekly close. Normally, a market decline cannot be completed in one go, and a rebound is expected in the 4035-4030 range. As expected, we seized the opportunity to take profits, and the timing was exactly in line with our prediction. The rebound was met with resistance at 4110, and the market continued to fall. This round of decline is heading towards a break below 4000, followed by a test of 3886-3600! In the evening, the focus for gold remained on holding short positions and shorting at higher levels. If the price does not rise above 4120 tonight, short positions can be held over the weekend. Try to maintain a stable approach and wait and observe if there are no good entry points. In summary, today's gold trading strategy is to primarily sell on rallies and secondarily buy on dips. The key resistance level to watch in the short term is 4110-4120, while the key support level is 4030-4000. Please keep up with the pace. It is essential to manage position size and stop-loss orders carefully, strictly set stop-loss orders, and never hold onto losing positions.

Gold prices plummeted, but what exactly happened?Gold's technical outlook has shown clear signs of a reversal, compounded by recent comments from Federal Reserve officials that have reinforced bearish expectations. The bullish trend is struggling to hold, and prices rebounded quickly after touching the previous strong support level of 4030. We successfully captured this profit as expected, with the timing perfectly in line with our predictions. From a structural perspective, the short-term gold price movement is a technical correction after an oversold condition. This rebound is a normal technical correction and does not change the overall weak medium-term outlook. The market is likely to continue its downward trend through a period of consolidation. Strategically, the key short-term resistance level to watch is the 4090-4110 area. If the price rebounds but fails to break through this range, it will present a crucial opportunity to short. The overall strategy remains unchanged: focus on selling on rallies, and look for opportunities to short in the 4090-4110 area. Maintain a steady pace, follow the trend, and the market will naturally provide the necessary profit opportunities.

Is a gold price collapse signaling the end of the bull market?Today's market is likely to continue its downward trend. The strategy should be to sell on rallies. The primary focus is on the 4200 level, a key support/resistance level. If the downward trend continues, short positions can be initiated near 4200, with an initial target of 4145 and a further target of the key support at 4100. Only a decisive break below 4100 would confirm the formation of a secondary high. If the rebound holds above 4200, be wary of a large-scale market correction. Short-term resistance is around 4210; a break below this level would target yesterday's high, with the possibility of a second test to confirm the secondary high. Today's market is prone to surprises. While the technicals suggest a continuation of the downward trend, sudden fluctuations should be monitored. Initial resistance is around 4100; a short position can be initiated if it holds. Further upside targets are 4230-4240, where short positions can be initiated. Support is around 4100; a long position can be initiated if it holds.

Bulls are in control, and gold is poised for new highs!Gold bulls have resumed their strong upward momentum, and the overall pattern has gradually shifted towards a bull market structure. Further gains are expected, potentially pushing towards previous historical highs. Technically, the bullish trend remains dominant after the breakout. However, during this sustained upward movement, short-term caution is advised regarding the risk of high-level consolidation and potential pullbacks. The key support level to watch is the 4220-4200 area. If the price stabilizes and holds above this level, the bullish trend is likely to continue. Long positions can be initiated in batches, patiently waiting for the trend to extend. Avoid blindly chasing highs; maintain a steady pace and wait for a pullback confirmation before entering a position. This is the key to a stable and prudent approach in a strong market.

Opportunities are plentiful; what's lacking is patience.Gold Technical Analysis: On Wednesday, a large bullish candlestick broke through the 4150 resistance level during the US session, ending the recent sideways consolidation. The price reached a high of around 4210. As we repeatedly emphasized on Wednesday, after consolidation, further upward movement was expected, opening a new upward channel. The market has largely lived up to expectations. The key focus now is on the sustainability of this upward move. Structurally, with this strong rally, all timeframes are in a bullish alignment. The immediate resistance levels to watch are around the 4-hour upper Bollinger Band at 4215, and the 0.786 Fibonacci retracement level, around 4275. These two levels are expected to provide some temporary resistance for the bulls. As the price has risen, the support level has gradually moved higher. The primary support level to watch in the short term is 4150. This level is a previous resistance zone that has repeatedly faced downward pressure and is currently a top-to-bottom reversal point. As long as the gold price holds above this level, the bullish trend will continue. The important support level is around 4100. As long as the price stays above this level, the upward trend will not change. Therefore, for the end of the week, we will continue to be bullish with 4150 and 4100 as support levels.
Gold prices have broken through the previous resistance zone around 4150 on the 4-hour chart. Both bulls and bears have made substantial profits over the past few trading days. If the price can hold above 4150, it is highly likely to reach 4250-4270 tomorrow. At the end of the trading day, pay attention to whether there will be a pullback followed by a second upward move. Also, watch for support around 4160-4150 in the final minutes of the trading day. The upward momentum after the recent breakout should continue, although the deviation in the smaller timeframes is slightly large. We should watch for any short-term corrections. On the hourly chart, watch the low of 4097 from Tuesday's pullback. The US session saw a rapid rise above 4150, indicating a low probability of a significant drop; at most, it will only be a pullback. Short-term focus should be on buying on dips, using the 4150 level (a previous support/resistance level) as support, and also looking for opportunities to buy at the 0.5 Fibonacci retracement level. In summary, today's gold trading strategy should prioritize buying on dips, with selling on rallies as a secondary approach. Key resistance levels to watch are 4250-4275, and key support levels are 4150-4170. Please stay on track.

A massive shockwave crashes against the golden roller coaster.Gold Price Analysis: Yesterday, gold rose but encountered resistance around 4150, then fell back to around 4100 before rebounding and entering a period of consolidation. As of this morning's trading, it failed to break new highs. The first wave of the upward trend since the short-term bottom at 3886 has stalled. 4160 is the starting point of the second wave of the decline after the previous drop from 4380. Short-term pressure and pullback correction are normal. The overall upward trend remains unchanged. The rise from 3886 to around 4150 represents an increase of approximately $265, and the pullback correction is entirely a normal technical adjustment. However, after encountering resistance around 4150, the upward movement will be delayed. After Monday's surge, many people thought that a rally of over $100 in a single day was coming again. But now, the market is generally in a large range of high-level fluctuations, and it's impossible for it to rise by $100 every day. However, the overall daily uptrend remains unchanged. After a short-term correction, a second wave of upward movement will begin. But there is one thing to be aware of: this wave is a rebound correction after the drop from 4380. If it takes too long to break through and fails to rise further, we should be wary of a weakening momentum and subsequent decline. So, if the market fails to break through the resistance of 4150-4160 after this period of consolidation, the bulls should be cautious.
Gold Technical Analysis: After the morning's pullback, the MACD lines turned downwards again, continuing the death cross signal. Gold prices also showed a structure of lower highs, currently under pressure at the $4145 level. However, since the fast and slow lines are still running above the zero axis, if gold prices cannot fall further and cause the fast and slow lines to cross the zero axis, the bulls may launch another counterattack. The failure to break yesterday's high in the morning indicates that the bullish trend has slowed down. However, the failure to break yesterday's low of $4097 during the Asian session suggests that the bears are not strong either. The battle between bulls and bears is intense, and gold prices have entered a new adjustment period. Therefore, today's strategy remains to sell high and buy low. In the second half of the week, gold will continue to focus on testing the support level below. Currently, the moving averages show signs of crossing upwards, increasing the possibility of gold extending its rebound. However, the short-term upward movement was too sudden and the magnitude of the movement was too large, which brings great difficulty and risk to the operation. Therefore, even if the short-term outlook turns bullish, in actual operation, it is still necessary to wait for a pullback before considering going long. Do not blindly follow the bullish trend without considering the price level. In summary, today's gold trading strategy is to mainly buy on dips and sell on rallies as a secondary approach. The key resistance level to watch in the short term is 4145-4160, and the key support level to watch in the short term is 4110-4095. Friends, please keep up with the rhythm.

Gold pullback on November 12th: Buy on dips!The hourly moving averages for gold continue their bullish crossover and upward divergence, indicating continued upward momentum. The 4-hour chart shows gold continuing its consolidation phase, likely preparing for a breakout above the resistance level of 4160. Gold may have dipped slightly below 4100 to around 4098 before rebounding. Buying on dips above 4098 is recommended.

Perfectly grasp the rhythm of gold trading.Gold has maintained a strong upward squeeze this week, steadily climbing and breaking new highs. Currently, we are watching the 4145-4150 level as short-term resistance. A pullback and consolidation are needed to break through this level. The moving average system shows a bearish divergence, and the price has stalled at higher levels, failing to break through. There are currently no good entry points. Although the market outlook is bullish, we should wait for a pullback to the 4125-4110 area before considering long positions. The technical indicators need correction, so chasing the upward trend is not advisable. We should patiently wait for a pullback before looking for opportunities to go long!

Continue to buy gold after the correction!Gold opened on Monday and immediately began its upward trend, relying on the short-term moving average. It broke through two key resistance levels in succession, soaring once again. The daily chart showed a large bullish candle, breaking through the 4100 psychological level again, forming a strong upward spike and raising expectations for further gains. The weekly chart also broke through the short-term moving average again. Judging from the current pattern, the strength formed after the continuous upward movement is likely to continue strongly. Although there was a slight pullback during the US session, it ultimately continued its rapid upward climb. For now, we remain bullish on the gold market. The key resistance level remains around 4150, which will be the first target in the near term. The support level remains around 4110-4100, which is also one of the first pullback correction points for the bulls in the short term. If gold pulls back to around 4115-4100 during the day, we suggest going long on gold, with a target of around 4130-4150.

Right now, I've discovered another market opportunity.We publicly pointed out that we should pay close attention to the resistance in the 4100-4120 range. After encountering resistance, a pullback was expected. The market trend was largely in line with our expectations, with the lowest point reaching around 4074. We were very satisfied with the substantial profit we achieved.
There was indeed some upward movement during the day. This week, we need to focus on the news: Although the market continued its strong performance at the beginning of the week, it was easy to create the illusion that a "sharp rise was about to happen". However, the government shutdown is now in its final countdown, so we need to be wary of potential risks. Once the shutdown ends, the market may see a significant pullback. Since relevant news has already released signals, we should remain rational about the recent rise and not blindly follow the trend. There is always something fishy going on, so it is better to be cautious. For more detailed instructions, please refer to the notification at the bottom.
From a technical perspective, gold has repeatedly faced resistance near 4110 after breaking through 4100. It is severely overbought in the short term and shows signs of a potential top. I personally do not recommend continuing to buy at this high level to avoid a sharp drop, which is a common market shakeout pattern. Therefore, my strategy remains to prioritize short-term shorting. From the current structure, 4100 has not truly stabilized. Do not blindly and aggressively chase the upward trend. Focus on short-term adjustments and seize opportunities to trade within the time frame. Short positions can be initiated in the 4100-4120 range, with a target of 10-40 USD. The key support level to watch is 4050-4030, which can be considered as a range for buying on dips and medium- to long-term positions. It is best to remain on the sidelines and not participate in positions in the middle range. The 4100-4120 range remains a key focus for short-term bears. Market trends don't only rise or only fall. If you grasp the opportunities well, every phase can be a chance. Generally speaking, don't blindly chase the rise when you're bullish. Flexibly manage the rhythm of primarily long positions and secondarily short positions, and follow the trend to achieve steady success.

The gold price trend is clear; opportunities lie in the timing!At the start of the week, the gold price chose a clear upward direction, breaking through key resistance levels at 4030 and 4050, reaching a high near 4095. From the overall trend structure, the bullish momentum remains strong, and the short-term trend is still robust. However, the upside potential is gradually being limited. The biggest mistake in trend trading is chasing emotions. I personally prefer to focus on resistance signals in the 4100-4120 area. If signs of resistance appear, consider shorting at higher levels. If the price retraces to the 4050-4030 area and stabilizes, that would be a more stable entry point for long positions. After the breakout, the pace accelerates. The key now lies in entry points and execution. Avoid chasing highs and blindly shorting; steadily follow the rhythm and wait for market confirmation. True stability lies not in prediction, but in the unity of execution and rhythm.

THE KOG REPORT THE KOG REPORT:
In last week’s KOG Report we wanted to stick to a similar plan from the week prior, looking for price to attempt either the high to short it again, or, for price to attempt to break the lower box and then give us the opportunity to long again. We had to switch to intra-day trading during the week due to the ranging and as usual, the indicators worked well giving us some good trades and we near enough got what we wanted from the KOG report analysis and the red box targets published.
So, what can we expect in the week ahead?
Potential for this range to continue during the first half of the week with the immediate resistance above at 4006-10 which will need to break in order to target the 4030 level which is what we’re looking for. For this to happen, support 3990 needs to hold us up and if we can push upside it’s that 4030 level we want to keep an eye on. Rejection there can again lead to another swoop of the lower regions but, we need to keep in mind that red box below. That is the key level of defence for the early part of the week and will need to break!
The indicators are suggesting lower at the moment but we need more confirmation and we also need to see if they fill the void left over above from Friday.
In our opinion, another choppy week ahead, more ranging and whipsawing while we accumulate and await that clear confirmation of direction. Until then, it’s level to level and intra-day Red box trading for us.
RED BOXES:
BREAK above 4004 for 4010, 4014 and 4030 in extension of the move
BREAK below 3990 for 3985, 3979, 3970 and 3965 in extension of the move
Many of you have asked what the “Bubbles/circles” are on the chart! These are the hot spots we have been sharing with you that work well as RIPs! We share the monthly results and daily hot spots and I’m sure our traders will agree, they are powerful!
Please do support us by hitting the like button, leaving a comment, and giving us a follow. We’ve been doing this for a long time now providing traders with in-depth free analysis on Gold, so your likes and comments are very much appreciated.
As always, trade safe.
KOG

Selling on rallies remains the dominant strategy for gold!Yesterday's closing price was around 3977, with a low of around 3964, successfully reaching the 3980-3960 range I predicted. I consistently emphasized against chasing the price higher yesterday and provided a shorting strategy around 4020-4030. Congratulations to those who followed my analysis for substantial profits. Gold faces significant upward pressure, and unless there's a major positive news catalyst, a breakout is unlikely. Otherwise, we will continue to focus on selling on rallies. Today, Friday, is the non-farm payrolls report; we will maintain our strategy of selling on rallies during the day. If you're currently experiencing difficulties with your trading, and I hope to help you avoid common pitfalls, feel free to contact me for discussion!
From the 4-hour chart, gold is maintaining a generally bearish trend with some volatility. The upside resistance is around 4010-4020, with a key resistance level near 4030. Support is around 3970-3960. The recommended strategy is to sell on rallies, observing more and acting less in the middle range, avoiding chasing the market, and patiently waiting for confirmation at key levels before entering the market. Specific trading strategies will be provided at the bottom; please pay close attention.
Gold Trading Strategy: Sell gold in batches in the 4010-4030 range on rebounds, with a target of 3980-3960.

The 11.7 range is narrowing; buy low and sell high.Gold has recently exhibited a typical consolidation pattern. After a brief dip to 3928 at the beginning of the week, it gradually stabilized and rebounded from Wednesday, briefly surging to 4020 yesterday, forming a V-shaped rebound overall, but failing to break out of the large consolidation range of 4060-3915. As time progresses, the range of fluctuation continues to narrow, forming a converging triangle pattern, suggesting the market is at a critical juncture in choosing a direction.
Today's trading should focus on two key price levels: 4020 represents significant short-term resistance, while 3965 is a support level that has been repeatedly tested recently. Strategically, short-term investors can buy low and sell high within the 4020-3965 range.
"Short-selling is correct" - Gold consolidation awaits breakout.Gold prices have indeed been somewhat sluggish recently, fluctuating repeatedly within a range. While this volatility can be agonizing, it reflects the market's rhythm. In terms of trading, avoid blindly chasing highs and lows. If you're bearish, don't chase the market down. Patiently wait for a rebound and resistance before entering a position. The recent market rhythm is very clear: sharp rallies are prone to pullbacks, and sharp drops are prone to rebounds – typical characteristics of a range-bound market. Our trading advice remains clear: focus on the 4010-4030 area. If a rebound fails to break through resistance, continue shorting, building positions in batches and proceeding steadily. We have repeatedly emphasized that gold is currently in a range-bound, slightly bearish adjustment phase, with the overall center of gravity continuing to shift downwards. Short-term rallies do not signify a reversal, and so-called signals are often just bull traps. High-level rebounds remain a good opportunity to establish short positions. Market conditions can change rapidly, but there are always patterns to follow. Don't be misled by appearances; look at the underlying logic and structure. Gold is still in a downward continuation phase. Rebounds present opportunities, while false breakouts pose risks. Gold prices fell as expected. Although we exited early and missed the lowest point, a steady exit is a victory in itself. Trading is never about who is more greedy, but about who knows how to control the pace better.

The bears' rhythm is clear, and their direction remains firm!Gold's early morning dip yesterday did not continue, and it even broke through the important resistance level of 3990 during the European session. Today, it broke through the 4000 mark, reaching a high of around 4020, which is the resistance level we predicted earlier. The price has accurately reached the 4020-4030 rebound range, and then quickly fell back to around 3978 and fluctuated. I believe that those who followed the plan have made a steady profit. Judging from the current trend structure, gold is likely to continue its oscillating rebound, but the short-term rebound space is limited. The key resistance area to watch is still 4020-4030. If the rebound fails to break through the resistance, it will still be a good opportunity for short sellers to position themselves. In terms of strategy, we will continue to focus on shorting on rallies, entering positions in batches with small positions, controlling risks, and moving forward steadily. If you've been struggling with your recent trading and want to avoid pitfalls in complex market conditions, feel free to contact me. I'll do my best to help you clarify your thinking and master your own trading rhythm.

Gold breaks through $4,000, has the bulls returned?You might be surprised if I said gold could continue to decline? But the truth is, I'm not surprised. I see this round of trend very clearly: the break below the 4000 mark was just a brief "acceleration" rather than a true reversal of direction. After the price broke through, it quickly rose to around 4017. This performance is more like an emotional release than a trend reversal. After all, the 4000 level has been breached or recovered many times before. There have been too many short-term fluctuations, and the real significance has already been digested by the market's inertia. I maintain a bearish outlook because the chart structure has reached the testing area of the channel's low point, a key position I have repeatedly emphasized. There are only two possibilities for the trend: either the market will soar upwards and return to the upward channel, or it will begin a new round of decline. What I want to seize is the volatility opportunity in the latter. Looking at the key levels: the highs this week are 4050, 4040, and 4030. If the rebound stops in the 4020-4030 area, then a short-term top has likely appeared. At this point, entering a short position would be extremely cost-effective. As long as the market cannot regain a foothold above 4030, I remain firmly bearish, with targets to watch for a break below 4000 and further down to the 3980-3960 area. I don't strive for perfect predictions, but every move I make must be logical, structured, and valuable. When opportunities arise, do not hesitate or waver; execution is key. Seek victory through stability and do not blindly follow the noise of the market.

XAUUSD has formed a left handed cup and hadnle patternIt is finally skipping out of hand but from left hand!
Price finally managed to bouce off the top of the left handed cup and handle pattern
We are on long, on a retest re-entry possible !

Gold prices fell back during the US session on November 5th.From the 4-hour chart, the current short-term resistance levels to watch are 3965-70 and 4020-55. Short-term support is at 3918-20, with a key support level at the previous low of 3888-90. The strategy is to sell on rallies.
Gold Trading Strategy:
1. Sell gold at 3980-70, add to the short position at 4020-25, stop loss at 4039, target 3940-3930.
