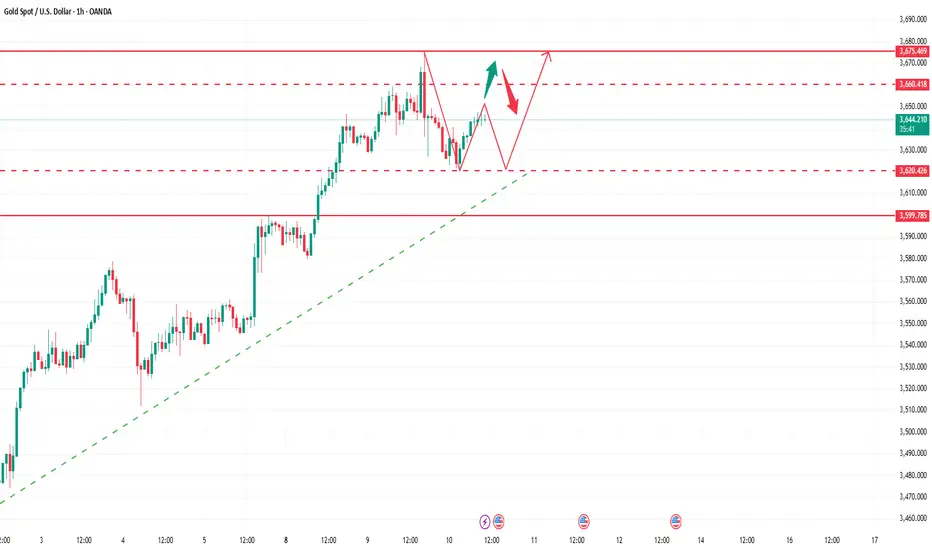
A pullback is an opportunity, go long decisively!Yesterday, the technical analysis of gold first declined and then rose. It was suppressed below the 3650 mark during the Asian and European sessions and showed a continuous decline. It further accelerated its decline before the European and US sessions, breaking through the 3630 mark, and continued to decline to around 3613 to stabilize and rebound. It rebounded strongly during the US session and finally closed above the 3630 mark with a small negative fluctuation. The overall price still held the 3610 mark, forming a support and stabilization pattern. After the opening of today, gold once again rose and broke through the 3640 mark. In the short term, it has experienced continuous retracements to test the 3610 mark support, which is still valid. The long position at the daily level is continuing well, and it is expected to further impact the previous high of 3675 resistance area. Today, the short-term support below is around 3630-3620, and the important support is 3610. If it falls back to this position during the day, the main bullish trend will remain unchanged. The short-term bullish strong dividing line is 3600. If the daily level stabilizes above this position, the rhythm of falling back to low and long and following the trend will continue. The specific execution plan of the counter-trend short order will be updated as soon as possible according to the real-time trend, and I will remind everyone to respond flexibly to ensure that every step of the operation is carried out under controllable risks. Remember to pay attention in time.
Gold operation strategy: Go long when gold falls back to around 3630-3620, with the target at 3650-3660. Continue to hold if it breaks through.
Goldstrategy

Gold trend analysis continues to rise after consolidationGold trend: Today, gold focuses on the impact of CPI data, which may impact the temporary technical view. Today, the Asian and European sessions maintain a low-long bullish trend, with support at 3620-3610 and short-term focus on 3645-3655. The US data has little impact, so it depends on the range. If the data has a large impact, focus on 3600 below and 3680-3690 above. Gold has risen unilaterally in two transactions and fluctuated for one trading day this week. The current high of gold is 3675, and the decline is only around 3620. Therefore, it is obvious that gold is rising slowly under the bullish trend, and even if it fluctuates, it will not fall much. Then, to determine the direction, we must look at the upward space under the direction. We still don’t guess the top, but under the influence of data, we still have to discuss whether there will be a change in direction or a shift in strength in the near future.
From a technical point of view, the daily line is still above the support of the 5-day moving average. If the 5-day moving average is not broken, there is no possibility of weakening. Although the 4-hour Bollinger Bands have closed, the middle track has not broken, and it is difficult to have a major adjustment. Therefore, the current market is still in a strong position. It is not clear whether gold has peaked or has a larger adjustment space. Therefore, if you want to trade, you still have to go long on the decline. So, today's market can be viewed in two steps. The European session is expected to fluctuate upward. Operate at key points and go long in the 3620-3610 support area below. Look at the 3645-3655 area above. If the US data has a greater impact, pay attention to the gains and losses of the 3600 key point below. It is still a good time to go long if it does not break.

The decline is just an adjustment, gold still has new highsAccording to the strategy, we first arranged long orders near 3620, and the market rose smoothly to around 3650; then it fluctuated and consolidated, and according to the strength of the decline, we were prompted to go long again near 3640, and finally made a profit again near 3655, achieving two consecutive wins with open long orders, and reaping considerable profits overall. Congratulations to friends who have been paying attention. Many traders who blindly followed the trend and shorted in the market today are wailing, but we have always insisted on remaining unchanged in the face of change. After confirming the strong rhythm, we have made decisive and continuous attacks, steadily reaping profits, and the winning streak is still continuing.
Gold is fluctuating upward above the 3640 level. It is currently fluctuating around the 3650 level. The market's expectations for interest rate cuts have not cooled down. The market may continue to fluctuate at a high level in the later period. Although gold rebounded on Wednesday, it did not reach a new high. The main structure is still operating within the expected range. However, after the market has stood above 3650, it brings uncertainty to the trend. Therefore, gold is still treated with the idea of going long on pullbacks. Going long on pullbacks is still the general trend. In terms of operation, I believe that we will continue to go long as the pullback does not break.
From the 4-hour cycle, the bullish structure of gold remains stable. The short-term support below is around 3635-3625. The bullish strong dividing line has moved up to 3615. If this position is not broken, the pullback will rely on this area and continue to be bullish. At the daily level, as long as it stabilizes above 3615, the overall main tone of pulling back to low and long and following the trend will remain unchanged. In terms of operation, we should be patient and wait for the support to be confirmed. Low and long is still the general direction. As for the specific operation strategy of the counter-trend short position, I will remind you again at the key position, and everyone can pay attention to it in time.
Gold operation strategy: Go long when gold falls back to around 3640-3630, with the target at 3655-3660. Continue to hold if it breaks through.

How to correctly grasp the gold trading opportunities?Yesterday, the technical side of gold rose first and then fell. The overall gold price continued to rise strongly in the Asian and European sessions, and finally fell back in the U.S. session and fell into repeated fluctuations, and finally closed near 3628. The daily K-line closed at a high and then fell back and fluctuated in the middle. Yesterday, I kept notifying everyone that the technical side needed to retrace and not to be overly bullish on gold. Now everything is perfectly in line with expectations. Friends who follow me can see it. Today we continue to treat it with the idea of going long on retracements. After all, I believe that the trend has not reversed, and going long on retracements is still the general trend. Today, we will first focus on the short-term support at 3620-3610 below, and continue to go long if it retraces and does not break. If you encounter troubles in your current gold operations and want to make your investment journey more stable and avoid detours, please feel free to communicate with us at any time!
From the 4-hour level, today's short-term support for gold will focus on the 3620-3610 area, and the 3600 mark is the core dividing line between the strength of the bulls. If it retraces and stabilizes above this position during the day, the overall bullish thinking will remain unchanged. The main tone is still to go long on the retracement. At the daily level, as long as gold stabilizes above 3600, the low-long thinking will be sustainable. As for the counter-trend short positions, specific reminders will be given according to the pressure on the market at high levels. Brothers just need to pay attention to the bottom in time.
Gold operation strategy: Go long on gold when it retraces to around 3620-3610, target 3650-3660, and continue to hold if it breaks through.
Gold Rockets Toward 3600 on NFP—How Can Shorts Escape?After the NFP market unexpectedly broke out, gold is currently testing the 3600 mark, and the bullish momentum is strong. However, when gold is facing the pressure of the 3600 psychological level, it is showing signs of stagflation at a high level. So I still think that before gold completely stands above the 3600 mark, it is still necessary for gold to retreat first.
Because the gold market rose sharply under the influence of the NFP market, many investors were unable to intervene in the market in time, and even some investors who had already bought gold at high prices were not determined. Therefore, once gold experiences stagflation at a high level, some unsteady chips may first consider taking profits, thereby triggering panic selling; on the other hand, the gold market has risen sharply, and off-market wait-and-see funds dare not enter the market easily. Due to the lack of liquidity, gold may lead to weak continuity, so there is also a need for a pullback to increase liquidity!
I still hold a short position in gold, with an average entry price of around 3582. Although there is a certain floating loss at present, the risk is still controllable and within expectations, so there is no need to be too nervous for the time being. I still expect gold to retreat to the 3570-3560 area before the market closes today.

XAUUSD and DXY Analysis todayHello traders, this is a complete multiple timeframe analysis of this pair. We see could find significant trading opportunities as per analysis upon price action confirmation we may take this trade. Smash the like button if you find value in this analysis and drop a comment if you have any questions or let me know which pair to cover in my next analysis.

THE KOG REPORT - Jackson Hole Pt 2Jackson Hole 2025:
Here’s what to expect from the 2025 Jackson Hole Economic Policy Symposium, held August 21–23 in Jackson Hole, Wyoming:
Event Overview & Theme
• The 48th annual symposium is hosted by the Federal Reserve Bank of Kansas City from August 21 to 23, 2025.
• The theme is “Labour Markets in Transition: Demographics, Productivity, and Macroeconomic Policy.” It focuses on structural changes like aging populations, fertility declines, declining labour mobility, and the evolving role of AI in labour markets.
• The full agenda will be released on Thursday evening, August 21, with Federal Reserve Chair Jerome Powell’s speech scheduled for Friday morning (U.S. time): 10 a.m. EDT / 8 a.m. MDT.
Key Participants & Format
• A select group of around 120 invitees will attend, including central bankers, policymakers, academics, and journalists.
• Formats include research paper presentations, panels, Q&As, and the keynote address. All presentations and transcripts will be published online during and after the event
What to Watch For
1. Powell’s Speech & Policy Signals
Powell’s keynote—titled "Economic Outlook and Framework Review"—is expected to outline possible interest-rate decisions, update the Federal Reserve’s policy framework, and respond to critiques that its 2020 approach delayed necessary responses to inflation.
This is likely one of his most consequential speeches, delivered amid mounting political pressure, internal Fed disagreements, and a contested labour market environment.
2. Global Central Bankers & International Engagement
Notable international participants include ECB President Christine Lagarde and likely the Bank of England’s Andrew Bailey, expected to join panels on Saturday.
Their contributions will underscore the symposium’s global reach and offer comparative perspectives on monetary policy challenges.
3. Market Expectations & Reactions
Markets anticipate a 25 basis-point rate cut in September, with several sources placing the probability at ~85%.
Simultaneously, investor caution is elevated due to geopolitical tensions—especially around Trump’s influence, Ukraine talks, and tech policy developments.
4. Broader Economic Context
The symposium takes place amid mixed U.S. data: weak job growth and rising producer prices raise concerns about both slowing labour markets and persistent inflation.
Retail earnings (e.g. Target, Walmart, Home Depot) and recent CPI data also add to the backdrop, offering clues on consumer resilience and inflation trends.
GOLD:
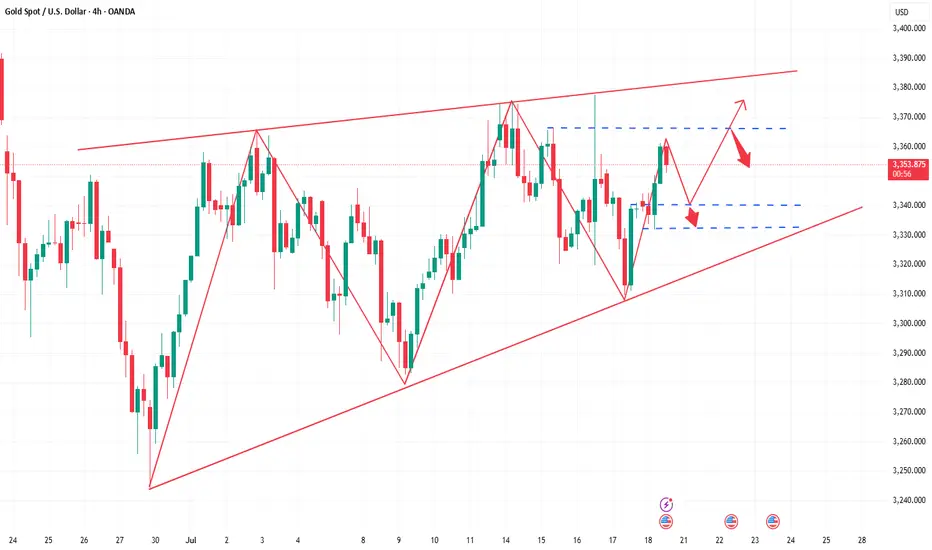
Based on the back test of the event they tend to test the low of the range which in this scenario is around the 3280-90 region, however, if we look at the structure we do have a reversal in play here with the support level being the 3330-25 level. Above 3330 we have that extension of the move we spoke about last week 3360-65 which is still untouched. So, if we that in mind and they support that lower level in the coming session, there is a possibility they take us up into that region sitting around 3360-75 due to the volume that is expected, and if rejected they correct that move downside to again attempt to break through the 3300 level. The key level in this scenario is 3375 which needs to be broken to go higher taking us above 3400.
On the flip. 3330-20 breaks forcefully, in this scenario there is possibility that for price to attempt the range low sitting around the 3280 level which needs to hold in order to go back up. Please note, an aggressive swing here can break through that level resulting in a move all the way back down into the 3230-50 levels before then exhausting.
The range is huge and where we’ve seen 500-700pip movement over the years, we’re seeing over a couple of days lately, so we need to exaggerate every move and only look at the extreme levels.
RED BOX TARGETS:
Break above 3350 for 3360, 3365, 3374, 3390 and 3420 in extension of the move
Break below 3335 for 3320, 3310, 3305, 3297, 3280 and 3265 in extension of the move
What we’re trying to show you here is that its going to be a very difficult event to trade for new traders. Its going to be choppy, its going to be volatile, its going to whipsaw and its likely to move. If you’re caught the wrong side of it its going to kill your account. Best practice here is to let the market make the moves it wants to, wait for the price to settle in whatever level they want to drive it to, once this has happened then look for the setup to get in to the trade.
Please do support us by hitting the like button, leaving a comment, and giving us a follow. We’ve been doing this for a long time now providing traders with in-depth free analysis on Gold, so your likes and comments are very much appreciated.
As always, trade safe.
KOG
The link below will take you to the previous report on this event:

THE KOG REPORT THE KOG REPORT:
In last week’s KOG Report we said we would be looking for the red box defence and potential target to hold us down and then expect a move downside unless broken. This move played well and as you can see the red box defence downside was broken, ultimately leading to us completing the move we wanted into the target level completing all the targets below before then getting that bounce from the exact level giving us the long trade.
It was only in the latter part of the week we experienced more choppy price action but red boxes worked well as did the path we had plotted out over the week.
So, what can we expect in the week ahead?
For this week we’re going to keep it short as we would like to put together further analysis and plans for the upcoming Jackson Hole symposium like we have been sharing over the last few years.
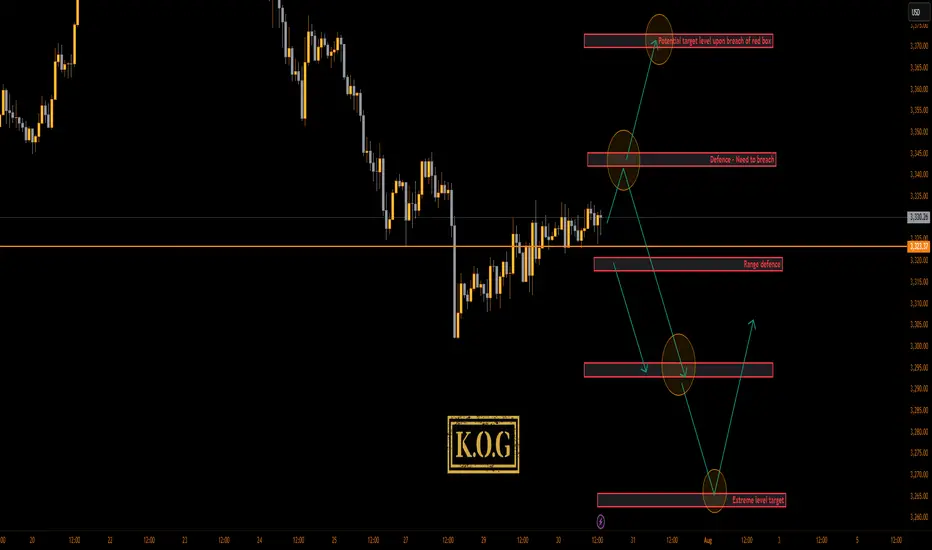
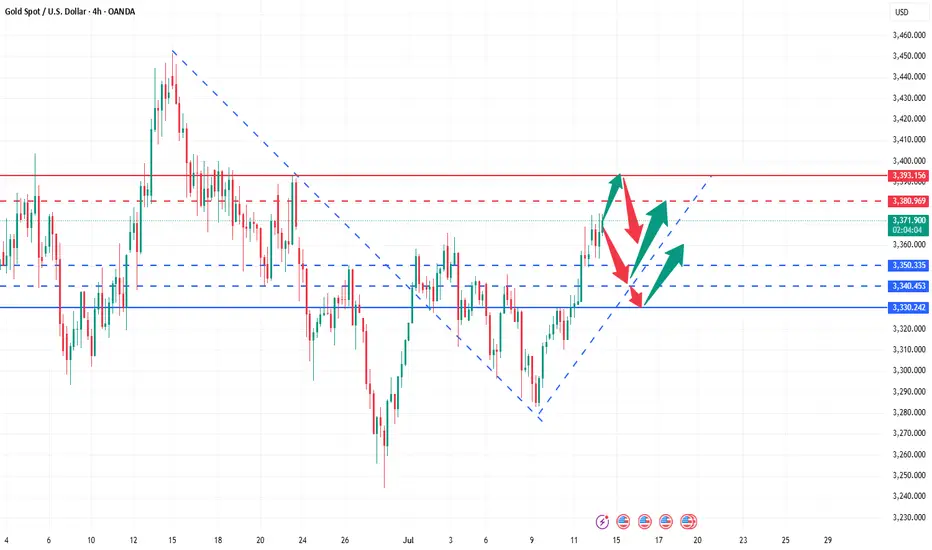
So we will start with the higher level 3350-55 which is the order region and has a hotspot. We have the lower level 3320-23 which is key level support for the opening, a tap into this level with rejection can give us the move upside into that 3350-55 level which is the level that needs to hold us down. There is an extension to this move and it’s towards that 3365 level so we have to keep that in mind.
If we break below the defence box, it’s very likely that we will be visiting the 3310-6 level initially while there sits a potential target level at the 3300-3295 level. We’re expecting a range here of 3380 and 3290 as potential for the first part of the week.
We’ll release the Jackson hold analysis and trade ideas towards the middle of the week. For now, that’s all.
KOG’s Bias of the week:
Bearish below 3355 with targets below 3330, 3320, 3317, 3310, 3306 and below that 3295
Bullish on break of 3360 with targets above 3365, 3371, 3375, 3385 and above that 3392
KOGS RED BOX TARGETS:
Break above 3337 for 3340, 3346, 3350, 3355 and 3363 in extension of the move
Break below 3317 for 3310, 3306 and 3301 in extension of the move
Please do support us by hitting the like button, leaving a comment, and giving us a follow. We’ve been doing this for a long time now providing traders with in-depth free analysis on Gold, so your likes and comments are very much appreciated.
As always, trade safe.
KOG

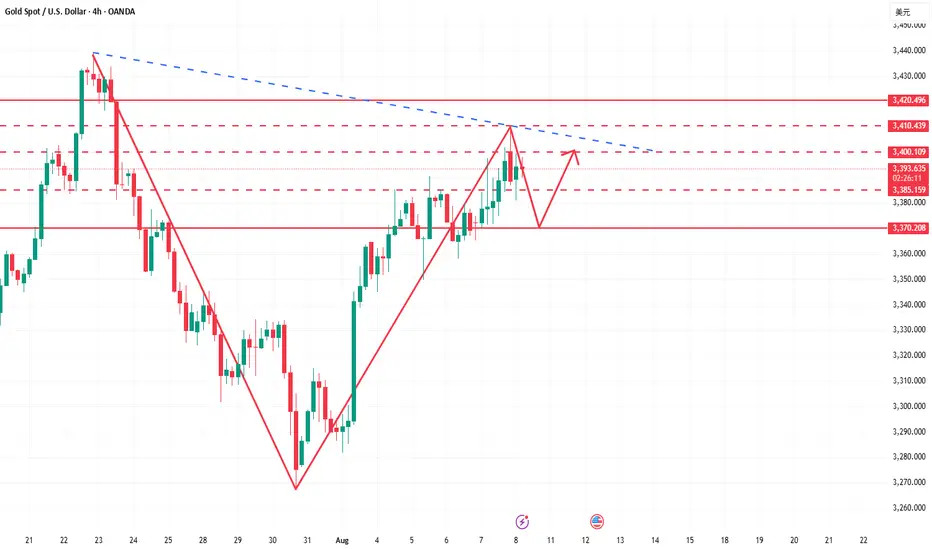
Bullish momentum weakens, and bearish opportunities emergeThe 4-hour gold chart shows a slow, volatile upward trend. While gradually climbing higher, it has failed to effectively break through key resistance areas. This suggests the market is not in a one-sided bullish trend, but rather in a state of sustained oscillation. Current price momentum is weakening, so it's not advisable to continue chasing higher prices. Today's strategy is to short on rallies, focusing on the key resistance area around 3410-3420. Opportunities are open for short positions. If prices trade within the 3400 range, this would be an ideal entry point for a short position. The main trend is to short on rebounds from higher levels, with strict risk management.
Gold Recommendation: Short in batches between 3400-3415, with a target of 3385-3370.
What you see are fluctuations, what I see are opportunities!Gold prices are rising as expected, with long positions perfectly fulfilled and periodic profits successfully secured. Currently, prices are once again encountering resistance at 3390. A clear bearish engulfing pattern has formed on the short-term hourly chart, suggesting weakening short-term momentum and increasing risk of a pullback. From a cyclical perspective, today marks the fifth trading day of gold's rebound, and technically, a periodic adjustment is necessary. A break below 3370 today will essentially confirm the establishment of a short-term top, and the market structure may shift into a phase of decline. Regarding trading recommendations, we recommend continuing to short on rallies around 3390 as a key resistance level, with short-term targets focused on 3370-3360. A subsequent break below this level with significant volume could open up further downside potential. Market sentiment is shifting rapidly at this time, so it is crucial to strictly enforce risk management discipline, avoid blindly chasing orders, and maintain a flexible and forward-looking strategy.

THE KOG REPORT - FOMCTHE KOG REPORT – FOMC
This is our view for FOMC, please do your own research and analysis to make an informed decision on the markets. It is not recommended you try to trade the event if you have less than 6 months trading experience and have a trusted risk strategy in place. The markets are extremely volatile, and these events can cause aggressive swings in price.
It’s been an aggressive month on the markets especially this week which has been testing for traders due to the extended movement on gold. We’ve managed to stay ahead of the game and although we missed the move downside, we’ve capture scalps up and down trading it on an intra-day basis rather than a swing.
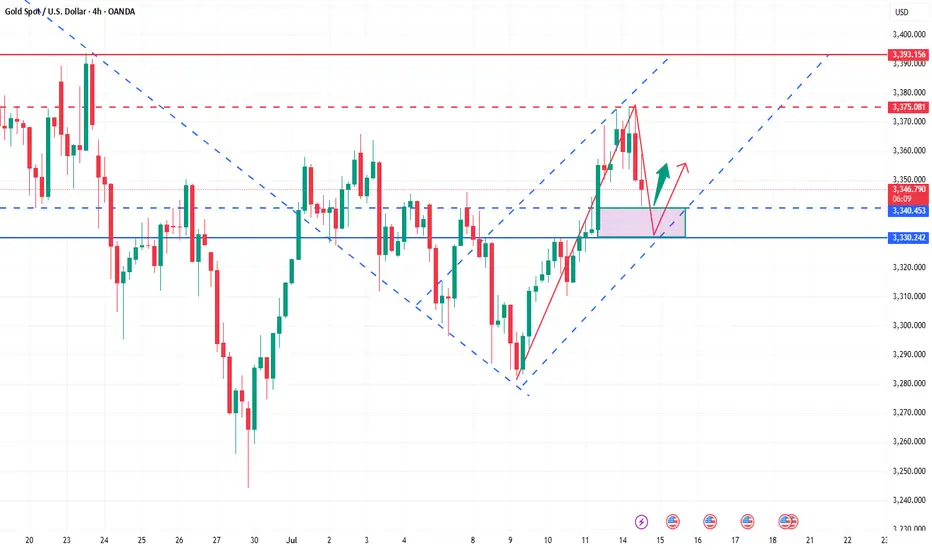
Looking at the 4H chart, we can see we have support forming at the 3310 level which is the key level for this week and will need to be broken to go lower. If we can flip the 3334 resistance, price should attempt higher into the 3355-60 region which is where we may settle in preparation for NFP. on Friday This is the level that needs to be watched for the daily close, as a close above will confirm the structure and pattern test which can form a reversal if not breached.
Now, here is the flip! We’re still sitting below the daily red box but we know this break does give a retracement and with sentiment long, it may not be a complete retracement again. Here 3345-50 is the red box to watch and as above, if not breached, we may see a rejection here which will confirm no reversal for higher and, potentially a further decline into the 3270-5 regions for the end of the month and quarter.
Pivot – 3323-6
RED BOX TARGETS:
Break above 3335 for 3338, 3340, 3345, 3347 and 3357 in extension of the move
Break below 3320 for 3310, 3306, 3302, 3297 and 3393 in extension of the move
Please do support us by hitting the like button, leaving a comment, and giving us a follow. We’ve been doing this for a long time now providing traders with in-depth free analysis on Gold, so your likes and comments are very much appreciated.
As always, trade safe.
KOG
GOLD Analysis : XAUUSD Major Bullish Demand Zone🧠 Market Structure Context (MMC Framework)
Gold has recently shown a clean structural decline from its local highs within a well-defined ascending channel. This analysis highlights a reaction zone-based playbook, focusing on high-probability reversal scenarios guided by institutional footprints, volume reaction points, and MMC logic.
We’re currently trading near a previous reversal zone, where history tells us the market tends to shift behavior. Let’s dissect the key components.
📊 Key Technical Components
🔸 1. Ascending Channel Breakdown
The entire uptrend was respecting a well-established bullish channel until the recent drop violated the midline structure. This breakdown confirms a temporary bearish phase, with price breaking cleanly below a QFL base (Quick Flip Level)—a level where price reversed sharply before, which now acts as a major supply zone.
Psychological Insight: Channels give clues about momentum. Breaking below the lower band shows the market is preparing for a retest or a deeper liquidity hunt.
QFL Breakdown: Once broken, previous buyer confidence is shaken—inviting sellers to test demand zones.
🔸 2. Previous Reversal Zone (PRZ) Reaction
Currently, price is hovering inside the blue shaded Previous Reversal Zone, where bullish pressure previously kicked in. It’s a minor demand zone, but critical due to historical reaction. The projected structure shows a bounce from this area before deciding next direction.
MMC Insight: The first test of PRZ often leads to an initial reaction. But deeper liquidity lies just below in the major green demand zone.
🔸 3. Major Demand Zone + Volume Burst Area (The Real Magnet)
Below the PRZ lies the major reversal block—highlighted in green. This zone is significant because:
It aligns with a high-volume burst in the past, confirming institutional orders.
It's a cleaner structure level for smart money re-entry.
It also provides room for the “liquidity sweep” (stop hunt), collecting sell stops before a proper reversal.
💡 Expected Play: Price may fake out below PRZ, enter the major demand, and then initiate a multiple-leg bullish rally. Patience is key here.
🛠️ Trade Structure Outlook
✅ Scenario 1 – Aggressive Buyers (Marked "1"):
Buy from the current PRZ zone around $3,305–$3,315
Target: $3,340 (Minor Resistance)
Risk: Slippage into deeper demand zone
Stop-loss: Below $3,295
✅ Scenario 2 – Safer Entry from Major Demand (Marked "2"):
Let price dip into $3,270–$3,280 zone (green box)
Look for reversal candles or liquidity sweeps on lower timeframes
TP1: $3,330
TP2: $3,365 (Major Resistance)
📈 Resistance Levels to Watch:
Minor Resistance: $3,340 – Expect short-term pullbacks or hesitation.
Major Resistance: $3,365 – Key target for swing traders and potential reversal zone.
🔍 MMC Concepts in Action
✅ Channel Logic: Breakdown implies momentum shift—watch for retests.
✅ QFL: Previous bounce zone broken = supply now overhead.
✅ Volume Burst Zone: Strong historical reaction = institutional interest.
✅ Zone-to-Zone Trading: Instead of random entries, focus on logical zone interactions.
🧭 Conclusion – Path of Probability
Gold is currently in a transitional phase—shifting from bearish correction to potential bullish revival. Patience will reward those who wait for PRZ rejections or deeper liquidity taps. The MMC framework helps frame this market not as chaos, but a map of strategic reaction points.

XAUUSD Traders - Turn Chaos into Pips with This StrategyHello Traders,
Struggling to trade XAUUSD due to its high volatility? Taking small profits but suffering big losses?
We’ve got your back.
Introducing Gold Sniper — a high-probability strategy specially crafted for XAUUSD traders. With a 65%+ win rate and a consistent 1:1.33 risk-reward ratio, it’s designed to help you catch sharp moves with confidence.
🚨 Live Performance Highlights:
Today’s Trades:
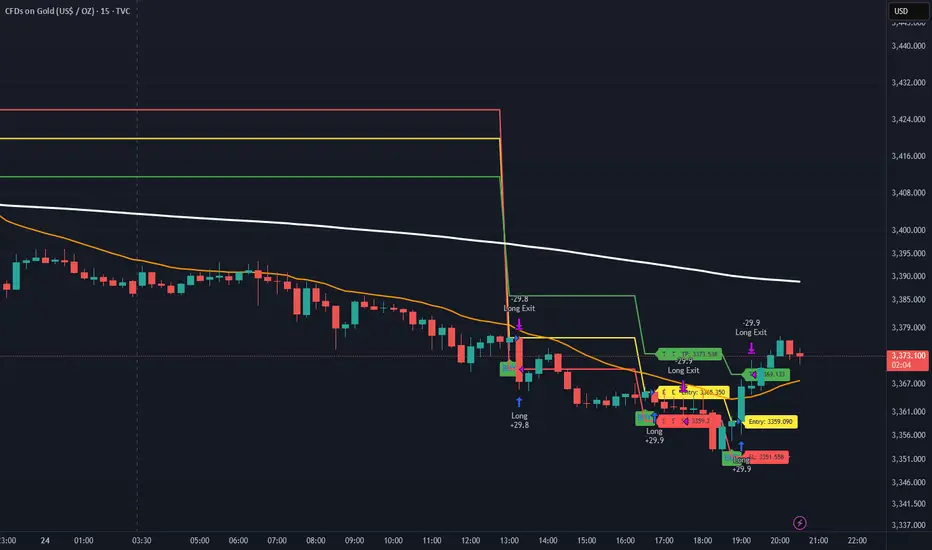
Signal 1
🟢 Buy @ 3365.350
🔴 SL @ 3359.209
🟢 TP @ 3373.538
❌ Result: SL Hit → 61 Pips Loss
Signal 2
🟢 Buy @ 3359.090
🔴 SL @ 3351.558
🟢 TP @ 3369.133
✅ Result: TP Hit → 75 Pips Profit
📊 Net Profit Today: +13 Pips
📅 Yesterday’s Profit: +150 Pips
✅ Gold Sniper helps you:
• Avoid fake breakouts
• Catch real momentum
• Stick to disciplined entries and exits
🎯 Want to boost your trading accuracy?
📩 DM us now to get access and start using Gold Sniper directly on your TradingView chart.
If you find this valuable, like the idea and show your support. Let’s grow together!
Happy Trading,
InvestPro India
XAUUSD Analysis todayHello traders, this is a complete multiple timeframe analysis of this pair. We see could find significant trading opportunities as per analysis upon price action confirmation we may take this trade. Smash the like button if you find value in this analysis and drop a comment if you have any questions or let me know which pair to cover in my next analysis.

How to seize deterministic trading opportunities?The rebound momentum of the gold market has been significantly enhanced today. After breaking through the 3345 resistance in the Asian session, it has continued to rise. It has now reached around 3360, and has rebounded by more than US$50 from this week's low of 3310, setting a new rebound high in the past three trading days. After the gold price effectively broke through the key resistance band of 3340–3350, it triggered some short stop loss trading and trend funds to enter the market, driving the price to accelerate the upward trend. Judging from the hourly chart, the trading volume has increased by about 30% compared with the same period yesterday, indicating that the market's recognition of this round of rebound has increased significantly.
A physically full sun candle chart has been closed in the 4-hour cycle, successfully standing on the Bollinger middle track, further confirming the upward structure, the mid-track support area 3340–3345 has become a key position for bulls' defense, and the short-term structure of the market is still relatively strong. Overall, the intraday retracement range of gold is limited, and the probability of continuing to rise is relatively high. In terms of strategy, it is still recommended to go long. In the short term, focus on the 3340–3345 area retracement support, and the stop-profit target is 3365–3370; if the upward breakthrough, pay attention to the suppression performance of the 3370–3375 line, beware of highs and falls, and pay attention to controlling risks.
Two lines of defense for bulls: 3340 and 3330 are the key!Gold maintains a strong pattern in the short term, and it is recommended to mainly buy on dips. The short-term support below focuses on the neckline of the hourly line at 3340 last Friday. The more critical support is locked at the 3330 line. This range is an important watershed for judging the continuation of short-term bullish momentum. As long as the daily level can remain stable above the 3330 mark, the overall trend will remain upward. Before falling below this position, we should adhere to the idea of buying low and buying low, and rely on key support levels to arrange long orders. At present, the price has completed a technical breakthrough and broke through the upper edge of the 3330 convergence triangle under the dual positive factors of Trump's tariff landing to stimulate risk aversion and the support of the Fed's interest rate cut expectations, and formed three consecutive positive daily lines. It is necessary to pay attention to the short-term pressure at the 3375 line. The overall operation strategy will be combined with the real-time trend prompts during the trading session, and pay attention to the bottom in time.
Gold rises strongly, aiming for a new high!Last Friday, gold continued to rise strongly, breaking through 3320 in the Asia-Europe session and accelerating its rise. The European session broke through the 3340 mark continuously. The US session broke through 3369 and then fell back. The daily line closed with a big positive line. It broke through the high for three consecutive days and returned to above 3360. The unilateral bullish pattern was re-established. Today, the gold price jumped high and broke through 3370 and then fluctuated at a high level. Although it rushed up, the strength was limited. It must be adjusted after a short-term retracement before it can continue to rise. Therefore, in terms of operation, we continue to maintain the main idea of retreating and multiplying. Pay attention to the 3340-3345 area for short-term support during the day, and look at the 3330 line for strong support. If it does not break, it will continue to be a good opportunity to buy low and do more. Taking advantage of the trend is still the current main tone. As long as the daily level does not break 3330, the bullish structure will not be destroyed.
🔹Support focus: 3340-3345, key support level 3330
🔹Resistance focus: 3380-3393 area
1️⃣ If the price falls back to 3340-3350, a light long position will be intervened, with the target of 3365-3370. A strong breakthrough can see a new high;
2️⃣ If the price rises to 3380-3393 and is under pressure, a short-term short position adjustment can be tried, with a short-term target of around 3360.
The specific real-time points and position arrangements will be updated at the bottom. Interested friends are advised to pay attention to my strategy tips in a timely manner and seize every opportunity reasonably.
It is the right time to go long after the shock and adjustmentGold opened higher at 3364 today, and after a brief surge to 3374, it entered a stage of shock and retracement. Our plan to arrange short orders near 3370 was successfully implemented, and we stopped profits in batches in the 3360-3355 range, making short-term profits. Overall, although it jumped higher due to the stimulus of news such as the increase in tariffs over the weekend, the momentum of the surge is limited, and the technical side still needs to retrace to digest the gains.
At present, the market has returned to the technical rhythm. The key support refers to the breakthrough point of 3340-3345 last Friday. Further exploration will look at the strong support of 3330. The overall rhythm is still mainly to arrange long orders near the low support, and going with the trend is the key. As long as the 3330 support is not broken, the daily line structure will still maintain a strong bullish trend. Do not blindly chase the short position. The operation of short orders against the trend needs to be particularly cautious. I will promptly remind you of the specific operation strategy according to the changes in the market. You can pay attention to the bottom notification. It is recommended that you keep paying attention and respond to the market rhythm steadily.
Reference for gold operation strategy: Go long on gold near the 3345-3355 area, target the 3365-3370 line. If it breaks above 3370, you can continue to hold and hope for further continuation.

The 3400 mark will be the key for next week!Gold has been up and down this week, and the shock wash has intensified. It bottomed out and rebounded at 3282, and then steadily pulled up. After a slow rise to 3368 on Friday, the retracement was limited, and finally closed at 3355. So can gold be expected to be strong? Is it possible to reach 3400 next week? From the trend point of view, it is too early to say that it will turn strong. 3400 is an insurmountable barrier. Only by breaking through 3400 can we see a stable strong bull. If it is suppressed below 3400, the bulls will not be stable and may fall back at any time. We can only see large range fluctuations. From the overall trend point of view, gold is currently fluctuating widely in the large range of 3250-3400. It is safe to buy below 3300, and it is easy to go up. After all, it is still upward in the long run. Next week, we will focus on the gains and losses of the 3400 mark. It is not recommended to chase the high position directly on Monday. On the one hand, the interruption of the market after the weekend holiday can easily cause discontinuous rise. In addition, after three consecutive positive lines on the daily line, there will either be a negative correction and a fall, or a large positive volume. Combined with the current trend and rhythm of gold, be careful of a high-rise fall, and it is easy to get trapped by chasing long positions at high positions. Don't feel that it will soar as soon as it rises, and the high point of 3500 seems to be within reach; don't feel that it will fall sharply as soon as it falls, and the 3000 mark is not a dream. We should stay away from those who sing long when it rises and sing short when it falls. The direction is not because you see it, so you believe it, but because you believe it, so you see it. There will always be a time when you chase the rise and sell the fall and you will return with nothing.
Moreover, the high point of 3365 has not formed a substantial break and stabilized. On Monday, we still need to focus on the gains and losses of this position, so we need to look at it from two aspects:
1. If it rises directly at the opening, pay attention to the pressure near 3370-3380 and you can go short, and the target is 3350-3340!
2. If the market falls back at the opening, go long around 3340-3330, with the target above the high point of 3360-3368.
Where will gold prices go at the weekly close?The mentality of trading is very important. At the same time, you must have clear ideas and decisive actions. Gold has been in a state of rapid growth. Many people are easily led to big losses by a small mistake. If you are worried about the loss at this time, you can choose to observe our daily operations in the group. The operations in the group are reasonable and well-founded, with real-time current price orders, and the returns are also considerable. Everyone is welcome to come and verify.
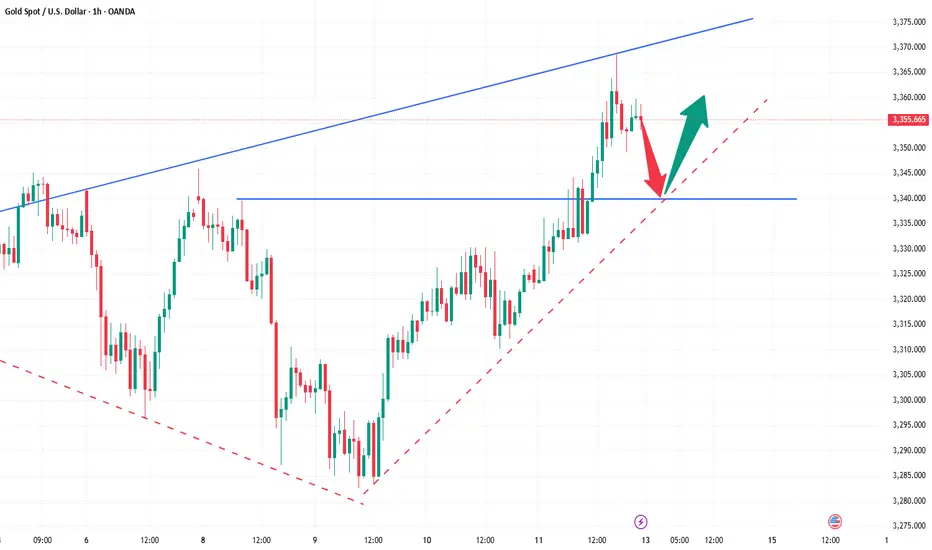
Gold risk aversion has driven gold to strengthen. The current bullish trend of gold is strong. The decline during the US trading session is still dominated by long positions. Technically, the 1-hour moving average forms a golden cross upward, indicating sufficient bullish momentum. After the gold price breaks through, it is confirmed that the support level of 3330 is effective, and the short-term support structure has been formed. It is recommended to wait for the second opportunity for the gold price to step back! Although the 1-hour chart shows that the current trend remains strong and the step-back amplitude is small, it is necessary to maintain a cautious attitude-even if the market is strong, it is not recommended to chase more, and it is necessary to guard against the risk of a deep correction in the gold price. In terms of operation, it is reminded that you can focus on the support level below: the first support level is 3345 (bull-bear watershed). If it falls below, pay attention to the key support of 3330. If the gold price falls back to around 3345 and stabilizes, you can consider a light position to try more.

Although the bulls are strong, don't chase them at high levelsGold trend analysis:
The market is fluctuating repeatedly now, and it is possible to rise or fall, but under the bullish trend, the main force is still rising. Therefore, this week's trading is to fall back and do more at a low price. Whether it is the previous 3285, 3306, or 3315, there are good profits. Although it is temporarily unable to break out of the bullish volume, at least the trend remains unchanged, and there will definitely be a large upward space in the future. Today is Friday, and we still pay attention to the possibility of bullish volume. This week, we have been emphasizing that if it rises during the week, we will see the 3370 high point. If 3370 breaks, there are still 3380 and 3400 above. On Friday, we will see whether this idea is realized.
From a technical point of view, there was a sharp pull this morning, with the big sun breaking through the upper track of the downward channel 3326 in the above figure, and then stepping back to confirm stabilization and bottoming out, which means that the breakthrough is effective, so you can directly follow the bullish trend in the morning, and during the European session, it repeatedly went up and down around the 3345-3332 range. With the experience of yesterday's trend, today we have been waiting for it to approach the 10-day moving average and then continue to be bullish on dips, and the entry point is basically good; currently it has broken through the resistance level of 3345 in the European session, so it depends on whether it can stand directly on it tonight. Once it stands, it can gradually rush to 3370, and the second is 3374, etc.; Of course, if it just pierces but does not stabilize, it will continue to spiral slowly upward around the yellow channel in the figure, so continue to wait patiently for the 10-day moving average, which is also the lower track position to grasp the low and long; Therefore, tonight gold 3345-3333 continues to rise on dips, with 3330 top and bottom positions as nodes, resistance at 3370, further resistance at 3374, etc.; If there is an unexpected big negative inducement to empty the market like yesterday, pay attention to stabilization above 3320 and still bullish;
Gold operation strategy: It is recommended to go long when it falls back to 3333-3345, and the target is 3360-3370.

Try shorting once below 3355!The market closed at 3326 on Thursday and still failed to break through the small range of long and short positions. The overall market is in a strong bullish trend and this trend indicates the possibility of a breakout in the future. In this week's trading example, after confirming that the 3315 low support is effective, a short-term long operation was successfully carried out below the area and profited. The picture and truth can be checked in the article on Thursday. In the short term, continue to pay attention to the range shock and pay close attention to the breakthrough direction of key points. The first thing to pay attention to is the strong pressure of 3355. If it breaks through and stands firmly at this position, it will open up further upward space, and the potential target can be seen in the 3365 or even 3400 area. On the contrary, if the gold price is always under pressure below 3355, the market is likely to continue the current shock and consolidation rhythm. Therefore, breaking through the 3355 mark will be a key signal to judge whether the market can release significant upward momentum in the future. Before the effective breakthrough, continue to intervene in the low-long opportunity at the 3325-15 support level of the shock range. On the upper side, you can arrange short positions at 3345-3455.

How to seize gold trading opportunitiesNews:
On Friday (July 11) in the Asian time zone, US President Trump posted a "tariff change" on social media, announcing that a 35% tariff would be imposed on all Canadian goods from August 1, a 10 percentage point increase from the current rate. This decision was like a thunderbolt, instantly igniting the market's risk aversion sentiment, and the spot gold price soared, reaching a high of $3,344 per ounce during the session. Although Trump extended the tariff agreement to August 1, which once suppressed the gold price, he subsequently stated that it would not be extended after the expiration, and launched further tariff attacks after the expiration, announcing a new 50% tariff on copper imports from the United States and a 50% tariff on goods from Brazil, which increased concerns about tariff risks and pushed the gold price to rebound from the bottom;
Gold trend analysis:
The market is fluctuating repeatedly now, and it is possible to rise or fall, but under the bullish trend, the main force is still rising. Therefore, this week's trading is to fall back and do more at a low price. Whether it is the previous 3285, 3304, or 3317, there are good profits. Although it is temporarily unable to break out of the bullish volume, at least the trend remains unchanged, and there will definitely be a large upward space in the future. Today is Friday, and we still pay attention to the possibility of bullish volume. This Monday has been emphasizing that if it rises during the week, it will look at the 3345 high point. If 3345 breaks, there are still 3365 and 3400 above. Friday will see whether this idea is realized.
From a technical point of view, all cycles are obviously bullish now. The daily line bottomed out on Tuesday, and Wednesday and Thursday were all small broken Yang rising. If it continues, we will first see whether the daily Bollinger middle rail 3345 pressure is broken. After the break, the big Yang closes high. This wave of rise may reach 3400. Therefore, the daily cycle has a lot of room for growth and should not be taken lightly. The H4 cycle needs to see whether today's rise can break 3345, because if it breaks 3345, there is a possibility of the upper rail opening. After the upper rail opens, gold will have a unilateral trend. Therefore, today's bullish target is 3345. If 3345 is not broken, there is still a possibility of a decline. If 3345 breaks, there will be 3365 and 3400 above. Here, it is clearly bullish and optimistic about the break of 3345. After determining the direction, the trading idea on Friday is also clear. It must be mainly long on the decline. The support below is 3320-3310. Don't chase more in the European session. Trade again if there is a decline.
Gold operation strategy: It is recommended to go long if it falls back to around 3315-3325, with the target at 3335-3345; it is recommended to consider shorting if it touches 3345 but does not break, with the target at 3335-3325.
