Repeated cycle, timing is keyMarket fluctuations are oscillating about 70% of the time, and only about 30% of the time are unilateral upward or downward, so accumulating small victories into big victories is the magic weapon for long-term success. What we need to do is to plan our positions well, and make this investment with a plan, direction, and guidance. A good trader will make your investment journey smoother. How to operate in a volatile market? The ancients said: Do not do good things because they are small, and do not do evil things because they are small. If we move it to financial management, it can be understood as: Don't be too greedy, enter the market in batches. When entering the market and covering positions, the position should be small. Although the profit is less, accumulating small victories into big victories is the key to success. The investment philosophy is composed of the investor's psychology, philosophy, motivation, and technical level. It mainly includes: stability, patience, independent thinking, discipline, trend, etc.
Judging from the current trend of gold, in the 4H cycle, it has touched 3330 many times under pressure, and the K-line has continuously closed with upper shadows, which is quite similar to yesterday's rhythm. So we must first look at the strength of the decline. The support below is at 3314 and 3306. In terms of operation, it should be treated as mainly long and auxiliary short. The upper pressure still focuses on the gains and losses of 3330.
Goldstrategy

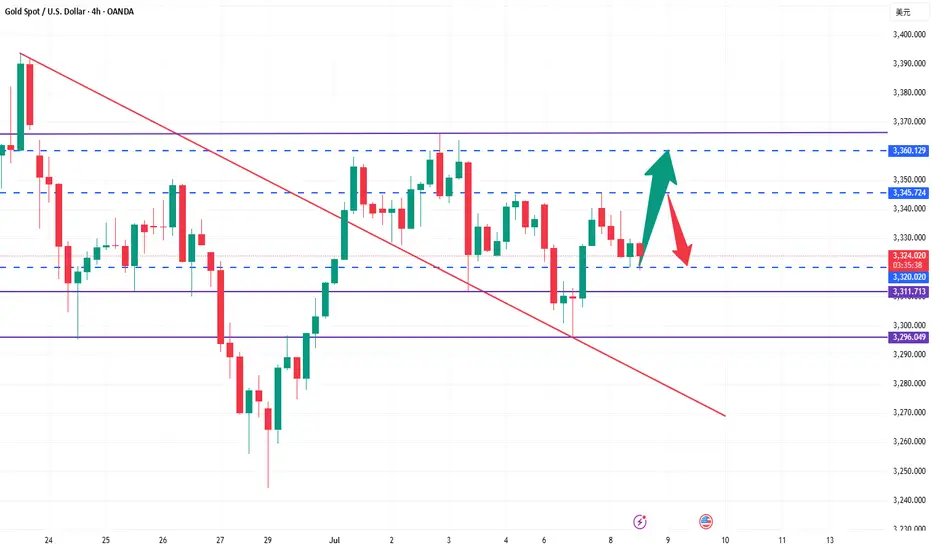
Hold more than 3320 gold orders and wait patiently for the riseWe arranged a long order at 3320. Obviously, the market has given us an opportunity. After entering the long order, we should set a stop loss and wait patiently for the profit to be released. This is what we have to do, so there is no other idea and we are still bullish.
The current market has a clear rhythm, and the support is effective. In the short term, it is still a bullish structure. The structure is not broken and the direction remains unchanged. We will continue to advance the trading rhythm as planned.
🔸 Hold long orders near 3320, and the stop profit is 3335-3345 unchanged.
🔸 Strictly implement the trading plan, keep a stable rhythm, and wait for the market to realize the space.
Trade within the plan, rhythm first, keep an eye on the key points, and leave the rest to the market.
After repeated tug-of-war, where will gold go?At present, the gold market is divided between long and short positions. The Federal Reserve may maintain high interest rates, which weakens the investment appeal of gold; however, trade frictions and geopolitical risks provide safe-haven support for gold. Overall, market sentiment is mixed, with bulls lacking confidence, but bears have not been able to fully control the situation. Last week's strong non-farm data reduced market expectations for a rate cut in July, pushing up U.S. bond yields and the dollar, putting pressure on gold, which does not generate interest. In addition, Trump said on social media that he would impose a 10% tariff on countries that "support anti-U.S. policies." The market is waiting for the release of the minutes of the Fed's June meeting, which will more clearly show policymakers' views on the current economic situation and future policies, and may determine the direction of interest rates. If the minutes show that the Fed is inclined to maintain high interest rates for a longer period of time, gold prices may continue to face downward pressure.
From a technical perspective, gold was under pressure at a high level at the opening, so gold is expected to fall today. Today's key pressure level is 3345. Before the price effectively breaks through and stabilizes at 3345, any rebound is a short-selling opportunity; once it stabilizes at 3345, the bottom pattern is confirmed to be established, and the bulls will start an upward market. At this time, the short-selling idea should be abandoned. From a technical point of view, the 1-hour chart has shown a trend from weak to strong, and the Bollinger Bands are opening and diverging upward, indicating that the market may accelerate upward. Today's operation suggestion is to focus on low-long and high-short as a supplement. In terms of specific points, the lower support is 3327-3320, and the upper resistance is 3355-3360.
Operation strategy:
1. It is recommended to buy gold when it rebounds to around 3327-3320, with the target at 3340-3350.
2. It is recommended to sell gold when it rebounds to around 3345-3355, with the target at 3330-3320.

Gold fluctuates repeatedly, how to seize the opportunityIf the direction is right, you are not afraid of the long journey. Use time to witness your strength, use your strength to win the future, let trust become profit, and use profit to resolve doubts. The market is changing rapidly, and going with the trend is the kingly way. When the trend comes, just do it, don't go against the trend to buy at the bottom, so as not to suffer. Remember not to act on impulse when trading. The market is good for all kinds of dissatisfaction, so you must not hold orders. I believe many people have experienced this. The more you resist, the more panic you will feel, and the floating losses will continue to magnify, making you eat and sleep poorly, and you will miss many opportunities in vain. If you also have these troubles, then you might as well follow my pace and try to see if it can make you suddenly enlightened.
Gold is concerned about the short-term pressure of the 3316 line above, and focuses on the pressure of the 3325 line. If the pressure above the 3325 line is not broken, then the possibility of gold further breaking through the lower space to 3295-3300 in the short term will also increase significantly. Therefore, the main line of gold operation is still based on holding shorts and rebounding shorts. Gold can rebound to the 3316 line and 3325 line before considering participating in short shorts. In terms of operation, we first pay attention to the support of the 3295-3300 line. If the lower support is broken today, the market will reverse to the short side. Otherwise, we will continue to rebound from the bottom and look for opportunities to go long.
From the current trend of gold, pay attention to the support of the 3300-3295 line below, the short-term resistance above pays attention to the vicinity of 3316, and focus on the suppression of the line near 3325. The overall main tone of high-altitude low-multiple cycle participation remains unchanged. In the mid-line position, keep watching and do less, follow orders cautiously, keep the main tone of participating in the trend, and patiently wait for key points to participate.
Gold operation strategy:
1. Go long on gold around 3330-3295, target 3315-3320.
2. Go short on gold around 3315-3325, target 3305-3300.

Gold fluctuates near the resistance point, and the short positioSpot gold rose slightly in the European session on Friday (July 4), currently trading around $3,333/oz, up about 0.37%, and is expected to record a considerable increase of nearly 2% on a weekly basis. Behind this wave of gold price increases is the smooth passage of the massive tax cut and spending bill promoted by US President Trump in Congress, which has caused market concerns about the US fiscal situation. At the same time, the continued weakness of the US dollar index has further helped the rise in gold prices. As a traditional safe-haven asset, gold continues to be supported by bargain hunting.
Despite the continued rise in gold prices, physical gold demand in major Asian markets has been sluggish. Due to high prices, consumer purchasing interest has significantly weakened. In India in particular, the reduction in gold imports has led to a narrowing of the market discount. The weak demand in the Asian market is in sharp contrast to the risk aversion in the global financial market, highlighting the complexity of the current gold market. On the whole, fiscal concerns caused by the US tax cut bill, the weakening of the US dollar and the potential impact of Trump's tariff policy are jointly driving the upward trend of gold prices. The attractiveness of gold as a safe-haven asset is increasing, especially against the backdrop of increasing global economic uncertainty. In the future, as tariff policies are gradually implemented and the Federal Reserve's monetary policy becomes clearer, the gold market may have more opportunities to rise.
.

Maintain range fluctuations during the day?Gold has maintained a volatile pattern recently. As the US market is closed today for Independence Day, the market volatility is expected to be limited, but the volatile market will continue, but the volatility range may change. Yesterday's gold price fell mainly due to the news, and this decline usually does not last too long. From a technical point of view, gold prices are supported near 3310-3300, which is the key support level today. It is worth noting that on Wednesday, gold prices were under pressure in the 3340-3350 area, and on Thursday, prices formed support in this range, indicating that the area is forming a top-bottom conversion. Therefore, 3340-3350 has become an important pressure level today. It is expected to fluctuate in the 3300-3340/3350 range during the day. The impact of news on gold prices is usually short-term. When the fundamentals and technical directions are consistent, price fluctuations will be more obvious. When the two are inconsistent, price fluctuations will weaken, but will not change the technical trend. The rebound pattern established at the beginning of the week is still valid. After a short-term shock, gold prices are expected to re-stand above 3345 and continue to maintain the rebound trend.

THE KOG REPORTTHE KOG REPORT:
In last week’s KOG Report we said we would be looking for price to attempt that higher level and potentially break for higher pricing. If it didn’t the path showed the level for an opportunity to short which fell just short but worked well into the level we initially wanted.
We then published the red box targets and the bias through the week which held, and we managed to complete all bearish targets by Friday.
Was it easy? No! Did we expect that flush? No! We simply got to a stage on Friday where we could only watch or get in with the volume, so we stood back and just watched.
So, what can we expect in the week ahead?
Simple one this week. We can see potential for lower, however, we’re too low to attempt shorting this, especially with the key level 3250-55 just below and major support. For that reason, we published the red boxes to help you all, look for the break either side! Ideally, we want to support on the low from the open and then continue with the move upside into the 3280-85 level initially, which should flip us on the support at 3270-75. We could range there as there is no news tomorrow but a gradual incline is what we’re looking for.
Support 3250-55 needs to break for lower, while resistance 3306-10 is the level that needs to break to go higher. That’s our potential range for now.
KOG’s bias for the week:
Bullish above 3250 with targets above 3278, 3285, 3297 and above that 3306
Bearish below 3250 with targets below 3240, 3232, 3220 and below that 3212
RED BOX TARGETS:
Break above 3275 for 3279, 3285, 3289 and 3306 in extension of the move
Break below 3260 for 3255, 3251, 3240 and 3235 in extension of the move
Please do support us by hitting the like button, leaving a comment, and giving us a follow. We’ve been doing this for a long time now providing traders with in-depth free analysis on Gold, so your likes and comments are very much appreciated.
As always, trade safe.
KOG

XAUUSD 200 pip FVG drop?XAUUSD Finally started to break below to the major direction of the trend. After crossing the daily high, price started to break below upon retest of the neck line of the 4H head and shoulder.
As the market has got rejected from daily resistance we see possible drop back to daily low or even test of the strong liquidity zone on the monthly support level.
Upon price action confirmation, a sell trade is high probable

Everybody loves Gold Part 3Gold strategy proving functional and reliable thus far.
Everybody loves Gold Part 3 takes a heavy bias towards the down side; all be it following the predicted price as highlighted.
As always price action determines trades.

Fellow Traders: Take Control—Free from Dependency—Here THE How!!Do you want to have control within your grasp? Not relying or depending on others/signals? Do you wish for that— minus the baits?
It’s something that maybe resonates with many retail traders today— paying with their hard-earned money and only getting the crumbs.
All I’m saying— keep an open mind . Whatever you do to invest in yourself ( knowledge & development ) is an excellent decision.
However, it’s okay to ask oneself: Is this the best that the market can offer, or is this the best the signals provider can do? Well, the limitation or struggle is never the question.
The real questions:
Is this how you want to proceed—always dependent on others?
What happens next if that sole source is now MIA or inactive?
I sincerely invite you to feedback on this system that I built to resolve just that. No hidden agenda. I am not asking you to follow or subscribe— I am doing this to better and challenge myself, and I hope it resonates with you too.
Would it be better for traders to have a clear guide to significant price levels—helping decisions and keeping emotions in check? What if real-time, no-delay dynamic levels could do just that? Would it be useful to you?
I’m not here to sell signals or recruit. I’ve seen too many traders lose hard-earned money—wiped clean, left with nothing but frustration.
I know the pain because I’ve been there before. That’s why I share ideas and anticipations— not for hype, but because clarity is power.
Maybe most traders prefer quick results , and that’s fine. But what if I share this system that I built could actually help to make those decisions—without second-guessing?
Here’s what I’ll do—starting June, I’ll drop snapshots of this dynamic system. If it resonates with you, take it. Use it for better trading.
No hidden agenda. No pressure. I just don’t want traders to keep blowing their money on blind trades.
Stay tuned. June marks a fresh start.
Awakening Traders from the Signal Trap
Signals tell you when to enter— but they don’t teach decision-making. They don’t show you market intent. They don’t prepare you for real liquidity shifts.
That’s why traders keep getting wiped out. Signals might bring short-term wins, but they don’t protect against the losses that erase accounts overnight.
Here’s the truth: Markets don’t move because of signals. Markets move because of liquidity pools, sentiment shifts, and dynamic price levels unseen in static analysis.
💡 What if instead of relying on signals, traders could access a real-time dynamic price level system—one that adjusts instantly, revealing crucial liquidity zones before the market moves?
This is what I built— a strategy framework, not just a tool.
✔ It’s fully dynamic. No delay, no guessing—just clarity.
✔ It adapts to any trading style —scalpers, swing traders, position traders—all benefit.
✔ It exposes where liquidity and sentiment pools —revealing opportunities before price reacts.
Most traders chase the move. But the ones who anticipate market dynamics take control before it happens.
This is what I’m sharing. Snapshots, real insights— not to convince anyone, but to show how clarity transforms trading. It is ease and simple to read - simple select your TF and the dynamic line guide the decision process , no drawing, not bogus line. The dynamic line is calculated based on real-time data - a simple script .
And no, this isn’t about selling signals or forcing belief. I just want traders to stop blowing their hard-earned money on blind trades.
And yes, this is limited, exclusive, and it’s personalized —meant only for traders who value precision.
If it resonates with you, take it, apply it, make better decisions—use it to refine your trading. Knowledge is meant to be shared.
Drop me the comment and perhaps connect to share knowledge and experiences.

THE KOG REPORT - FOMCTHE KOG REPORT – FOMC
This is our view for FOMC, please do your own research and analysis to make an informed decision on the markets. It is not recommended you try to trade the event if you have less than 6 months trading experience and have a trusted risk strategy in place. The markets are extremely volatile, and these events can cause aggressive swings in price.
Our NFP KOG Report worked pretty well apart from it being a Friday and us closing out positions for the weekend only for the move to complete on Monday. For this FOMC we’ll share the levels and potential reaction points on the red boxes as well as the red box target levels. Due to the range, it’s best to wait for the break and also for them to move the price to where they want, then hunt the trade once price has settled.
We have the immediate support level below 3360-55 which if held can push this upside to break the recent high and that 3480-90 level again. Break of that level we have red box region 3330-20 which is where we could get a RIP but that will give us the flip with potential for the order region 3350-55 to turn into resistance unless broken. For that reason, a down move for now could only give scalps for decent captures on tap and bounces.
3320 is the line in the sand, if broken below we’ll get the long from the 3290-95 region which will come next week.
Note, these days it’s only Trump that manages to move the markets aggressively, so this FOMC is most likely already priced in. Not worth attempting the immediate levels so we’ll rather wait for the extreme levels.
RED BOXES INDI LEVELS:
Break above 3395 for 3406, 3410, 3420, 3430 and 3435 in extension of the move
Break below 3375 for 3370, 3366, 3356, 3351 and 3345 in extension of the move
Please do support us by hitting the like button, leaving a comment, and giving us a follow. We’ve been doing this for a long time now providing traders with in-depth free analysis on Gold, so your likes and comments are very much appreciated.
As always, trade safe.
KOG

Gold Weekly Outlook - XAUUSD May 5th- May 9th🌍 XAUUSD Weekly Outlook – “Gold’s Cooling Off… Or Just Reloading? 🔁💥”
📅 Week of May 5–9, 2025
After breaking records with a fiery move into 3533, Gold just blinked. But is this the start of a deeper pullback — or simply a power nap before another skyrocket? Let’s break it down.
🧱 Macro Structure:
🔹 Massive bullish expansion from sub-2000 to 3533 → clear weekly BOS & continuation
🔹 First real retracement candle after months of nonstop gains
🔹 Price now hovering around the 3240–3270 mid-range FVG zone
🔑 Key Weekly Levels + Real Confluence:
📍 Price Range Zone Type What’s Here & Why It Matters
3533 🔺 ATH / Weak High Top liquidity grab + Premium high — supply reaction confirmed
3480–3510 ⚠ Reversal OB zone Weekly OB + clean FVG + sell-off origin = potential rejection zone
3240–3270 🔵 Micro Demand Mid-imbalance fill + minor OB + current retest base
3050–3100 🟦 Weekly Demand Block Big boy OB + 50% FIB retrace + macro HL zone → sniper reentry magnet
2750–2850 🧠 Strong HTF Demand Long-term CHoCH zone + discount imbalance stack = last line of defense
🔎 Weekly Confluences:
✅ SMC: BOS confirmed, CHoCH flipped in 2023 = macro bullish bias holds
📐 FIBO: 3050–3100 = perfect golden pocket (50%) of last full impulse
📊 EMA 5/21: Full bullish lock, no signs of EMA cross down
🔥 Liquidity: Above 3533 = final weak highs, below 3050 = deep liquidity pool
🧭 Bias Summary:
Bullish overall, but watching for:
A trap sell into 3050–3100 (clean sniper reentry zone)
🧲 Liquidity grab near 3300+ that could fuel another leg up or fakeout
🙏 Like this breakdown? Boost and follow us for sniper setups all week.
📌 Important Notice!!!
The above analysis is for educational purposes only and does not constitute financial advice. Always compare with your plan and wait for confirmation before taking action.
#XAUUSD #GoldOutlook #SMC #LiquidityHunt #SmartMoneyFlow

XAUUSD Analysis todayHello traders, this is a complete multiple timeframe analysis of this pair. We see could find significant trading opportunities as per analysis upon price action confirmation we may take this trade. Smash the like button if you find value in this analysis and drop a comment if you have any questions or let me know which pair to cover in my next analysis.

YOUR SEEING THIS NOT BY ACCIDENT (GOLD SWING)
remember this idea before, way early to short right?
Now its the time to short it. initial and 2nd tp zone. probable the swing tp could be 2700-2600 or
lower.
See this a liquidity grab on internal/inside a monthly basis chart.
This is not a random as you see this, it means you trade this for Long shot or swing thot.
Guys this idea is on my self only.
This is not a financial advice.
See you again next week.
The previous news or the ADP NFP are non sense. we a make a new highs again once this idea works?
This is only my view.
sharing this could turn your idea to swing trades.
Follow for more.

XAUUSD Analysis todayHello traders, this is a complete multiple timeframe analysis of this pair. We see could find significant trading opportunities as per analysis upon price action confirmation we may take this trade. Smash the like button if you find value in this analysis and drop a comment if you have any questions or let me know which pair to cover in my next analysis.

XAUUSD drop to daily support?XAUUSD with the new daily open price with a gap and started to trend back down. As the market is just below a significant support, the price may continue to drop to the daily 20ema which is also previous swing high turn support.
A sell trade is high probably after price action confirmation.

GOLD Price Analysis: Key Insights for Next Week Trading DecisionLast week, Gold briefly hit an all‑time high of $3,357 before profit‑taking drove it back to around $3,320 zone📉
Ongoing uncertainty around US‑China trade relations and a weaker dollar drove traders into safe‑haven assets, supporting bullion bids despite the pullback.
Meanwhile, Fed Chair Jerome Powell’s hawkish speech on Wednesday capped the rally for now, though tariff risks and geopolitical tensions may continue to underpin Gold prices into the new week.
In this video, we:
🗺️ Break down the key chart levels
🔍 Highlight bullish vs. bearish setups
🚀🔻 Preview catalysts that could spark the next move
Disclaimer:
This is my personal take based on experience and what I see on the charts. It’s not financial advice—always do your own research and consult a licensed advisor before trading.
#GoldMarketAnalysis #Inflation #TradeTensions #GeopoliticalRisks #TechnicalAnalysis #GoldTrading

Gold & The Policy Earthquake: Has the Top Been Set?🌐 1. Macro Landscape & Fundamental Drivers
April 2025 is shaping up to be one of the most volatile months in recent financial memory:
The U.S.-Global trade war is escalating with no signs of cooling. Following widespread tariff hikes by the Trump administration, the EU retaliated with 25% tariffs on U.S. goods, and dozens of nations are reacting in kind. WTO estimates global trade volume will drop by 1% in 2025.
Central banks are pivoting: both the ECB and Bank of England are signaling rate cuts. Morgan Stanley expects the BoE to slash rates down to 3.25% by year-end.
Global equities are under stress: the DAX and CAC40 plunged 4%, while U.S. indices are selling off hard.
💡 OANDA:XAUUSD surged to a record high near $3,360/oz, before pulling back to the current level around $3,327.
📌 Bottom Line – Fundamentals:
Flight to safety is alive and well. However, with gold at record levels and rate expectations shifting rapidly, we may be witnessing a transitional phase – from aggressive bidding to cautious holding.
📉 2. Multi-Timeframe Technical Analysis
🔍 Daily Chart (D1) – Strong Bull Trend, but Warning Signs Ahead
Price trades significantly above the 34, 89, and 200 EMAs – classic uptrend structure.
RSI is at 72.79, indicating overbought territory.
Volume shows signs of tapering off after a major spike – early signs of exhaustion?
🧾 D1 Summary: Momentum remains bullish, but with RSI overheated and volume waning, the rally may pause or retrace in the near term.
🔍 4H Chart (H4) – Entering Distribution Zone
Price has broken out and is now consolidating above prior highs.
All EMAs (34 > 89 > 200) remain bullish.
RSI at 70.24 = overbought, and price action shows indecision (doji, small-bodied candles).
🧾 H4 Summary: This is textbook distribution behavior. Bulls may still be in control, but sellers are testing the water.
🔍 1H Chart (H1) – Short-Term Battle Ground
Current price: $3,327.375
EMAs remain aligned for upside, but price is stalling around resistance.
RSI is neutral at 55.71, suggesting temporary equilibrium.
Volume is declining, hinting that bulls may be losing momentum.
🧾 H1 Summary: Price is consolidating. The next breakout or breakdown will define the short-term direction.
🧠 3. Market Sentiment Overview
🛡 Gold is still the safe-haven of choice, but fresh buying interest is diminishing.
📉 Risk sentiment remains fragile – traders are trimming exposure amid policy uncertainty.
📈 Bond yields are rising again, drawing capital away from gold in the very short term.
🧾 Sentiment Summary: Bulls dominate the narrative, but the crowd is showing signs of hesitation. A healthy pullback wouldn’t be surprising.
🎯 4. Trade Strategy for April 21, 2025 – Two-Sided Plan by Fuinvest
🔻 Scenario A: Short-Term Sell Setup (If price fails to break resistance)
Sell Entry: $3,327 – $3,332
Stop Loss: $3,348
Take Profits:
TP1: $3,313 (EMA34 on H1)
TP2: $3,288 (local demand)
TP3: $3,272 (EMA89 H1)
🧠 Why sell? Overbought RSI, weak volume, and potential distribution suggest a short-term pullback is likely.
🔺 Scenario B: Trend Continuation Buy (If breakout confirmed)
Buy Entry: $3,350 – $3,355 (after H1/H4 closes above $3,348 with volume confirmation)
Stop Loss: $3,327
Take Profits:
TP1: $3,378 (measured move target)
TP2: $3,410 (Fibonacci extension)
TP3: $3,450 (psychological round number)
🧠 Why buy? Trend remains intact. If resistance breaks, it could trigger momentum buying and stop-runs.
💼 Risk Management Tip:
Limit risk to 1–2% per trade.
Use trailing stops once price moves in your favor.
🧾 5. Final Thoughts from Fuinvest
“Gold has rallied in response to deep macro uncertainty, but with record highs comes fragility. The current structure suggests we are at a key decision point: either a clean breakout or a well-needed cooldown. Smart money is watching closely – and so should you.”
📣 Follow Fuinvest for real-time trade analysis, macro commentary, and actionable strategies that help you stay ahead of the market. Don’t just react – anticipate.

XAUUSD Analysis todayHello traders, this is a complete multiple timeframe analysis of this pair. We see could find significant trading opportunities as per analysis upon price action confirmation we may take this trade. Smash the like button if you find value in this analysis and drop a comment if you have any questions or let me know which pair to cover in my next analysis.

XAUUSD Analysis todayHello traders, this is a complete multiple timeframe analysis of this pair. We see could find significant trading opportunities as per analysis upon price action confirmation we may take this trade. Smash the like button if you find value in this analysis and drop a comment if you have any questions or let me know which pair to cover in my next analysis.

THE KOG REPORT THE KOG REPORT:
In last week’s KOG Report we said we would stick with the NFP move and look for price to continue long looking for our target region 3050-55. We were already in the move with the trades protected, however, on open we did get closed at BE only to be able to get a better entry from the undercut low. After the break of the key level and on the flip we managed to then continue with the move upside completing numerous Excalibur targets as well as our bias and red box targets upside.
I can’t say that was an easy week, the move was huge and thankfully we managed to stay the right side of it guided by the in-house indi’s and Excalibur.
So, what can we expect in the week ahead?
Although further upside is likely, we can’t long here as it’s too dangerous after that stretch last week. So let’s see how the market opens and if the Asia session attempts to test that high again. It’s the first level of 3230 that needs to be watched, support here can push us back upside into the above the key level of 3250-55 which is our ideal level for the hunt. If we can stay below that level we could see a RIP and price attempt the correction many traders are looking for in the early part of the week. The lower levels 3220 need to break as well as then the hurdle of 3210 which will make the correction easier.
Due to low volume news next week, we could see a lot of ranging in anticipation of some geopolitical news which will bring sudden spurts of volume and the movement that we want to see.
3190 is the key level support and also the pattern test region, traders should keep an eye on this level of support for any RIP’s and potential for upside, so if attacked a bounce around there should be on the cards. It’s simply a red box break and close week this week, monitoring the price action and only looking for the longs if we get pullbacks, otherwise, 1-2 decent short opportunities should be enough for the short week.
KOG’s bias of the week:
Bearish below 3265 with targets below 3220, 3210. 3197, 3190 and below that 3170
Bullish on break of 3265 with targets above 3276, 3280, 3285 and above that 3292
RED BOXES:
Break above 3250 for 3255, 3261, 3269, 3275 and 3290 in extension of the move
Break below 3230 for 3220, 3210, 3206, 3195 and 3180 in extension of the move
Please do support us by hitting the like button, leaving a comment, and giving us a follow. We’ve been doing this for a long time now providing traders with in-depth free analysis on Gold, so your likes and comments are very much appreciated.
As always, trade safe.
KOG

XAUUSD Entry on break of structure ?Hello traders, this is a complete multiple timeframe analysis of this pair. We see could find significant trading opportunities as per analysis upon price action confirmation we may take this trade. Smash the like button if you find value in this analysis and drop a comment if you have any questions or let me know which pair to cover in my next analysis.

XAUUSD Analysis todayHello traders, this is a complete multiple timeframe analysis of this pair. We see could find significant trading opportunities as per analysis upon price action confirmation we may take this trade. Smash the like button if you find value in this analysis and drop a comment if you have any questions or let me know which pair to cover in my next analysis.
