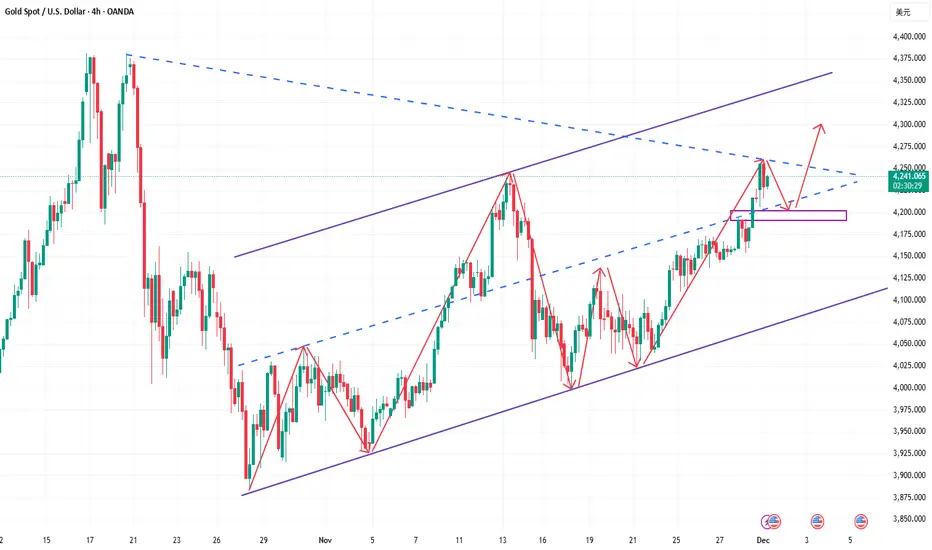
We perfectly capitalized on multiple bottoming out and rebounds!Yesterday, the bulls tested the bottom and rebounded, reaching a low of around 4163 in the US session before rebounding to a high of around 4229, approaching yesterday's high of 4235. Although it is currently undergoing a slight pullback correction, the overall trend is relatively bullish, and there is a possibility of further upward breakout after a period of consolidation. The support level below is currently around the psychological level of 4200, which may be breached. However, given the current situation, the possibility of a continuous decline is relatively small. After all, in a continuous upward trend, yesterday's single bearish candle will serve as an important indicator of bullish correction. The key support level below remains around 4190-4180, which is crucial for the subsequent bullish or bearish trend. If the price continues to consolidate above 4200 during the European session, you could consider taking a small long position if conditions permit. The key resistance level remains around yesterday's high of 4235. If this level is broken, the price may continue to rise. However, for those seeking a more conservative approach, it is advisable to wait for a pullback before taking long positions. If the price pulls back to the 4200-4180 range during the day, consider taking long positions in batches.
Goldtechnicalanalysis

Gold rallies again after a V-shaped recovery.Gold has once again exhibited a typical bottoming-out rebound pattern. After dipping to a low of around 4181 during the day, it quickly stabilized and rebounded. Currently, gold has successfully regained its footing above 4200, and the bullish structure remains intact. We accurately placed long orders around 4182, and as expected, successfully took profits above 4200. Once again, we grasped the rhythm, and our trading strategy remains clear: if a pullback doesn't break through, we will continue to focus on buying on dips. This is not blindly chasing the rise, but rather based on the current international environment, which continues to favor gold prices, coupled with the constantly strengthening bullish technical structure. Following the trend is our core trading logic. From a 4-hour chart perspective, the key resistance level to watch is around 4250-60, a crucial resistance zone that the bulls must break through. On the downside, the key support level is around 4180-4170, a core support level in this current structure. As long as this level holds, the bullish momentum will remain unchanged, and the overall trend will continue its upward movement within a range. The more thorough the pullback, the clearer the opportunities. We will continue to patiently wait for key levels, execute our plan, avoid chasing rallies, and refrain from impulsive actions. If you've been experiencing chaotic trading lately, struggling to determine the direction, and frequently getting caught in market fluctuations, feel free to discuss it with me. Perhaps what you lack isn't luck, but a sound trading strategy. I will provide timely updates on specific entry points and strategies at the bottom; just stay tuned.

The bulls are correcting before continuing their upward surge!Gold opened lower but rebounded, quickly stabilizing around 4192. Bulls launched a counterattack from the lows, reaching a high of around 4226 before entering a period of consolidation and pullback. The current movement is still within a normal adjustment structure, with some room for further retracement. In terms of trading, focus on the key support zone around 4200-4190, which was broken after the previous surge. As long as this zone holds, the strategy remains to buy on dips. The international macroeconomic environment continues to favor gold, and the technical structure also remains bullish. Therefore, buying on dips is crucial, rather than blindly chasing highs – this is the core of sound trading. Looking at the 4-hour chart, the resistance level to watch is around 4250-4260, a key resistance level. Support is seen around 4205-4190, a crucial support level for the bulls. Therefore, today's strategy remains to patiently wait for pullbacks at key levels. As long as the support holds, the potential for further bullish movement remains significant.

A perfect grasp of both bullish and bearish trends.Gold remains in an overall bullish trend, consistently hitting new recent highs. The bullish momentum remains strong, and pullbacks during the US session present buying opportunities. After testing the lows again in the US session, gold rebounded, maintaining its bullish strength. Continue to buy in the 4225-4215 range during the US session. The 1-hour moving averages are still in a bullish golden cross and diverging upwards, indicating further upward momentum. Gold rebounded strongly after testing the lows around 4215 in the morning, and again during the US session. The highs during pullbacks are progressively higher, suggesting continued buying opportunities during the US session. The principle is simple: follow the trend. Gold is currently in a bullish trend, and pullbacks present buying opportunities.

Will gold prices fall after a surgeWhat will become ofthe marketGold Technical Analysis: Today, the gold market was paralyzed due to a data malfunction on the CME Group, leading to the closure of all gold trading. Due to the Thanksgiving holiday, trading was relatively quiet, and overall price fluctuations were not significant. However, the overall trend remains bullish. Looking at the intraday price action, fundamental uncertainties exacerbated market sentiment volatility, but the overall trading range remained within the expected range of 4220-4155. This indicates that with the US market closed today, market sentiment remains cautious, not blindly following sudden fundamental developments or completely deviating from technical expectations. However, this also reflects the current market's lack of direction and the risk of sudden price movements due to other factors.
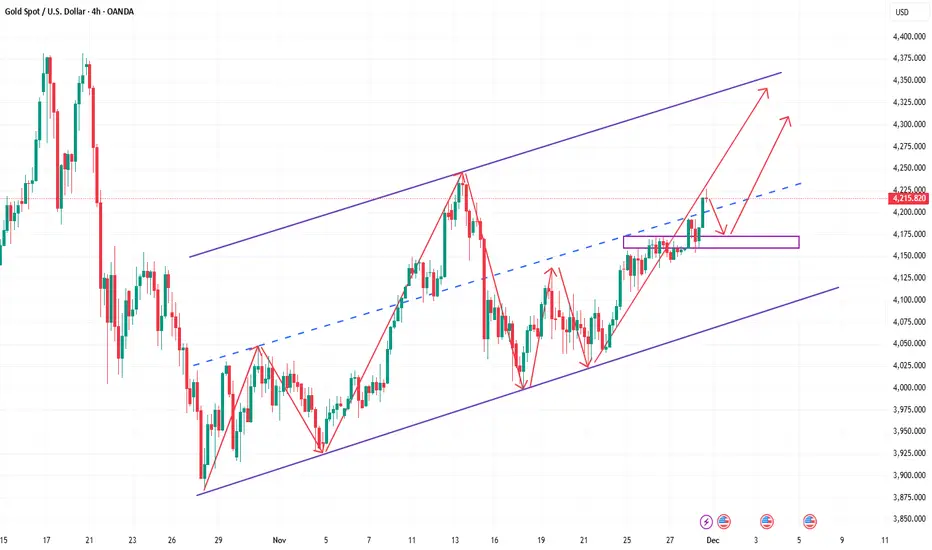
Gold is still trading within an upward channel on the hourly chart. A pullback to the lower channel support suggests a continued bullish trend. During the US session, gold is expected to fall back to 4160, presenting an opportunity to buy on dips. The hourly chart also shows gold at the upper edge of a range-bound pattern, potentially forming a support/resistance level. Support lies around 4160, the starting point of the morning's rise, which could become a key level for determining future direction. Key resistance is around 4220; a break above this level could lead to a challenge of the previous high near 4245. The recent upward movement after the open may be due to pent-up energy from the past two days of consolidation. Currently, the market trend leans towards an upward consolidation, so our trading strategy should focus on the bullish direction.In summary, the recommended trading strategy for gold is to primarily buy on dips and secondarily sell on rallies. The key resistance level to watch in the short term is 4240-4250, while the key support level is 4170-4160. Please stay tuned for further updates.

What is the intention behind the surge in gold prices at theopenLast Friday, due to Thanksgiving, market liquidity was limited. It was expected that the market would close early and the price movement would be minimal. However, gold still broke strongly above 4200 before the close, reaching the 4220-4230 area before a strong finish. Nevertheless, the trading strategy for this week should not be to blindly chase the rally. The key focus now is on the short-term resistance zone of 4245-4260, which is the high point after gold rebounded from the strong support of 4000 on November 18th. It is also a key resistance level in this upward structure. From the 4-hour chart, this area shows very clear resistance. If the bulls cannot break through effectively in the short term, shorting at higher levels remains the preferred strategy. On the downside, the key support level to watch is the psychological level around 4200-4190. If it retraces and stabilizes without breaking through, it can be used as a reference area for short-term long positions. The overall strategy remains the same: if the resistance level holds, prioritize shorting at higher levels; if the support level holds, then look for pullbacks to go long. The trend is there, but timing is more important. Blindly chasing the rise is not a wise choice. Trading according to the structure and key points is the key to continuous stability. Continue to follow my rhythm this week. We make decisions with discipline, not let the market lead us.
How high will gold go next week How much room is there to go up?Gold Technical Analysis: Gold has seen several highlights this week, breaking through the 4200 mark again, a figure that has caused considerable panic. Coupled with consecutive daily gains and high-level consolidation, this is the first sign of a strong upward move. The daily chart shows a reversal from a bearish to a bullish pattern, and if this pattern continues for two more days, forming a consecutive bullish formation, it will likely evolve into a second upward move. On Friday, gold experienced a relatively strong surge, falling to a low of around 4153 and rising to a high of around 4226. Currently, the bullish trend remains unchanged, and pullbacks present opportunities to enter long positions. The next key resistance level to watch is around 4245; if this level holds, a short position can be considered before going long.
This week, the key resistance area for gold is around 4240-4250. If it can break through effectively, the price of gold is expected to further test the previous highs of 4300 and even 4380. On the downside, 4175-4160 has turned from resistance into the first strong support, and the more critical support is at the 4150 level, a trading zone between bulls and bears. From the 4-hour chart, the main support for the price is at 4200. As long as the market maintains its strong upward momentum, it will not retrace too deeply. Therefore, it is necessary to pay attention to the short-term bullish trend. On the hourly chart, the price rose from 4155, and after a retracement from 4170-4180, it rose to 4226. The bullish trend support is at 4155. As long as the price does not break 4155, it will continue to rise and move towards the 4240-4250 area. In summary, the recommended strategy for gold trading next Monday is to primarily buy on dips and secondarily sell on rallies. The key resistance level to watch in the short term is 4240-4250, while the key support level is 4180-4160. Please keep up with the pace of the market.
Wait and see to avoid CME technology risks!Gold Technical Analysis: Since the beginning of this week, gold has been trending upwards in a volatile manner. After breaking through the high point of the 4110-4130 trading range, it formed a small, one-sided upward trend, currently approaching the 4200 level. The increase has not been significant, and the process has been tortuous, with continuous oscillating upward movement. Currently, supported by positive news, there is still room for short-term upward movement, but overall, the upside potential remains limited. Moreover, as mentioned before, this bullish move is likely to trap many investors. Therefore, a relatively conservative approach has been consistently advised. The extent of this upward movement is uncertain and depends entirely on the strength of the news. It may reach the previous high of 4245, or it may break through. However, even if it breaks through, it is still recommended that long positions exit rather than hold on. The area above 4200 is a risk zone for longs. Once the news direction changes, the decline will be faster than the rise; a rise may take two weeks, while a fall may only take three days.
Looking at the overall performance of gold, after consolidating yesterday, it opened higher today. However, such a rapid rise should not be chased, especially as it approaches $4200, where the upside potential is limited and the risk outweighs the potential profit. The key resistance level to watch in the short term is $4200, a level we have consistently emphasized. If it breaks above $4200, short-term bulls should consider exiting their positions. Short-term support lies in the $4155-$4150 area. If this support is reached, short-term traders can continue to follow the trend, but if it rallies further, take profits quickly, as there is a possibility of stagnation or a pullback above $4200. Due to Thanksgiving in the US, trading markets closed early, resulting in limited market activity during the US session. The market is expected to oscillate between $4150 and $4190, and this oscillation is likely to continue. Recently, neither bulls nor bears have shown sustained momentum. Watch the $4190-$4200 resistance level above and the $4150 support level below, and be aware of the risks. Today is the last trading day of November. We should be cautious about the current rise, as there is a possibility of a large-scale sweeping fluctuation at the monthly closing price. Therefore, even if we are bullish now, we should be cautious and not chase the rise.

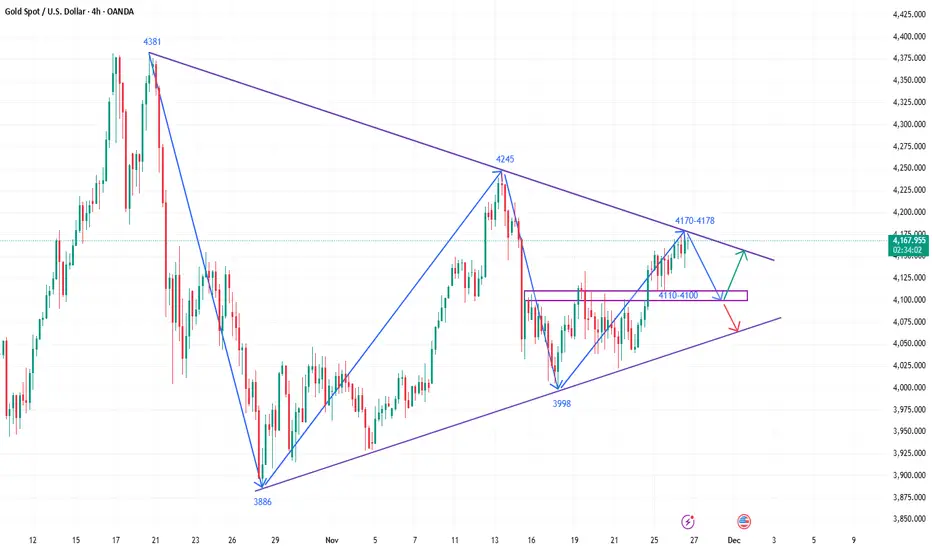
How to grasp the convergence of the golden triangle pattern?Gold Price Trend Analysis: After rising on Monday, gold closed with a doji on Tuesday and continued its upward trend today, reaching a high of around 4173. Overall, the market remains relatively strong. On the larger timeframe, the weekly chart shows solid support at the MA10 level, while the daily chart shows a tendency to form a triangle pattern. The upper edge of this triangle, around 4170-4180, will likely provide short-term resistance. Furthermore, considering the Thanksgiving holiday in the US market later this week, market activity is expected to be low. Therefore, range-bound trading is currently a suitable strategy for gold, but it may not be ideal for trading. This special timeframe could easily trigger a high degree of market manipulation, leading to abnormal price fluctuations.
Gold Technical Analysis: Looking at the 4-hour chart, the triangle consolidation pattern for gold remains unchanged. The downward trendline resistance is around 4170-4180. Only a decisive break above this trendline resistance will allow for further upward movement and a new round of opportunities. Otherwise, it will remain in a consolidation phase. On the 1-hour chart, gold is expected to continue its high-level consolidation today. The key support level to watch is the 5- and 10-day moving averages around 4110-4100. On the upside, the first resistance level to watch is 4170-4180. The possibility of testing 4200 depends on both technical and fundamental factors. Specifically, if gold holds above the moving averages throughout the second half of the week and provides further bullish fundamental catalysts, it might attempt to reach 4200 in the second half of the week. However, the uncertainty brought by the holiday season should be carefully considered in the second half of the week. In summary, today's gold trading strategy is to primarily sell on rallies and secondarily buy on dips. The key resistance level to watch in the short term is around 4170-4180, while the key support level is around 4110-4100. Traders must follow the trend, manage their positions and stop-loss orders carefully, strictly set stop-loss orders, and avoid holding losing positions.
With perfect timing in trading, where will gold go next?Gold closed in a narrow range yesterday with light trading, consolidating within the 4160-4150 range, perfectly in line with our expectations. After opening today, gold broke through the trendline resistance, officially entering a bullish phase. The longer the consolidation, the higher the potential rise; the upward momentum is expected to be significant. If gold prices break through and stabilize above 4200 as anticipated, further upside potential will open up. Long positions can wait for a pullback before considering appropriate entry opportunities. From a 4-hour chart perspective, gold broke upwards after consolidating sideways around the middle Bollinger Band and trend line, indicating a clearly bullish structure. There is still momentum for further upward movement in the short term. The recommended strategy is to buy on dips, focusing on support around 4175-4160, and resistance at 4200 and 4245. It's important to note that today is the monthly closing day; while bullish, be wary of a potential technical pullback after the initial surge. Overall, the trend remains bullish. After a period of consolidation, today's price action broke through the previous secondary high resistance level, making the direction very clear. Following this trend, the focus for today should be on buying on dips.

The gold short-selling strategy was executed flawlessly!Gold Technical Analysis: Due to Thanksgiving, the overall intraday volatility was not significant, mainly fluctuating within the 4140-4170 range, which was largely in line with my expectations. There was a slight dip in the Asian session, and I anticipated a drop to the 4130-3120 range, but it failed to break below 4140. With the US market closing early, the volatility is likely to be even smaller. Tonight, the overall strategy is still to treat it as a range-bound market. Before breaking 4175, the strategy is to sell on rallies, or simply observe, as the market movement is not significant and not very meaningful.
From the 4-hour chart, the gold triangle consolidation pattern remains unchanged. The downward trendline resistance is at 4170-4175. Only a valid break above this trendline resistance can lead to further upward movement and a new round of opportunities. Otherwise, it remains a consolidation phase at the end of the consolidation. On the 1-hour chart, the price has started to slowly break below the short-term support zone and is now under pressure from the short-term moving averages. There may be some room for adjustment in the short term. Pay attention to the short-term adjustment and repair. Today, continue to focus on the resistance level of the upper trendline of the triangle, which is also the watershed between bulls and bears. If the resistance is effective, expect a pullback. In this case, we still need to continue to try to establish short positions. If there is a rebound to around 4170-4175, we can short. In summary, today's gold trading strategy is to primarily sell on rallies and secondarily buy on dips. The key resistance level to watch in the short term is 4170-4175, and the key support level is 4110-4100. Please follow the rhythm.

The strategy of shorting gold was accurate.Today's bottoming strategy clearly indicated that gold should be shorted around the 4165-4180 resistance zone. From the opening to the afternoon, the market provided countless opportunities. We placed three short orders in the 4165-4180 area in our strategy, all of which were completed according to the rhythm, structure, and plan. The timing was perfect.
Gold Technical Analysis: The gold market is exhibiting a volatile and fluctuating trend. From a daily chart perspective, the current gold price is showing a wide-range fluctuation pattern, ultimately closing with a doji candlestick. Gold traded in a volatile manner on Tuesday, ultimately closing with a doji candlestick on the daily chart. Looking at the technical pattern formed by connecting recent highs and lows, the current gold price is generally trading within a triangle consolidation range, and this range is gradually narrowing. In the short term, it is necessary to continue to monitor the consolidation rhythm and wait for the market to choose a clear direction. The key resistance level to watch is around 4170-4180, while the short-term support level is around 4140-4120.
From a technical perspective, although the 5-day and 10-day moving averages have formed a golden cross, the short-term trend shows a divergence between the 5-day moving average moving upwards and the 10-day moving average moving downwards. This reflects the intense short-term battle between bulls and bears, and the possibility of continued price fluctuations. In intraday trading, the 4110-4100 area, where the 5-day moving average is currently located, should be the primary focus, as this level will serve as a crucial short-term support reference. Overall, today's gold trading strategy is recommended to primarily focus on selling on rallies and secondarily on buying on dips. The key resistance level to watch in the short term is 4170-4180, and the key support level is 4110-4100. Please stay tuned.

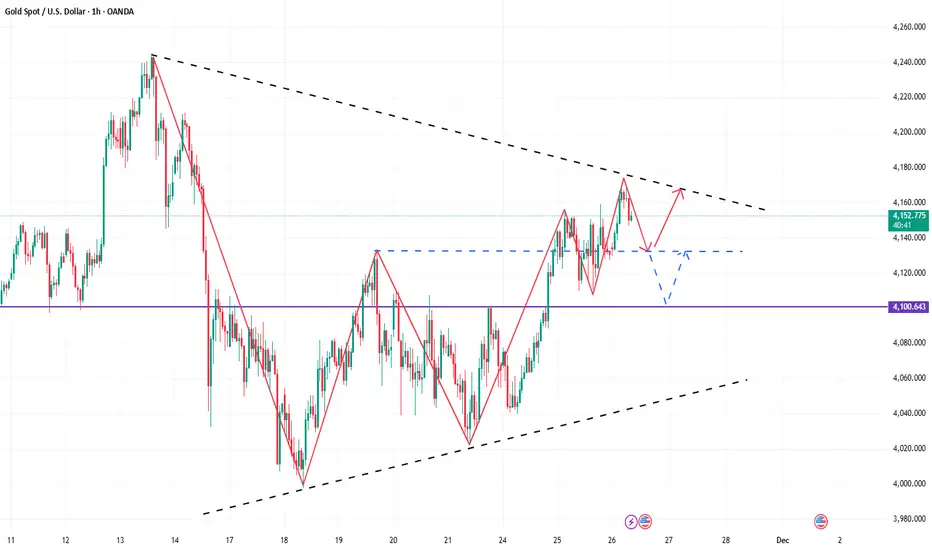
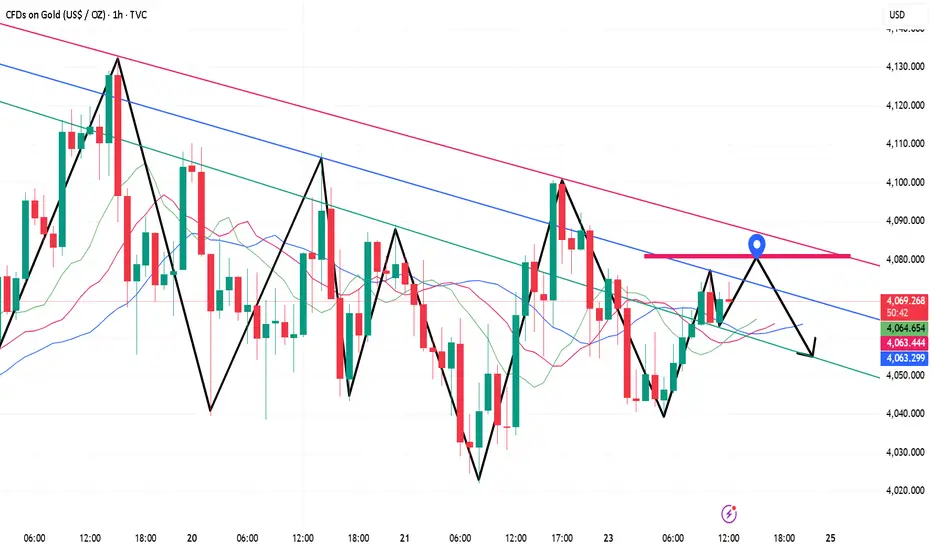
Is this a short-selling opportunity?Gold continued its upward trend from the previous two days after opening yesterday, reaching a high of around 4173 before pulling back. This level is also the downtrend line we've highlighted in the past two days. Although there was some resistance and a pullback, it ultimately stopped at around 4136. In other words, the resistance at this level is only effective in the short term and needs further verification. The rebound from the bottom in the US session indirectly dealt a blow to the bears, but the follow-through was clearly insufficient. Therefore, whether the resistance at this level will be effective today needs further verification. If the price continues to face pressure at this level today, the downward momentum may persist. The rebound in the evening was followed by a slight pullback to around 4140 after the opening bell, followed by continued minor fluctuations. Yesterday's high in the US session will be the key level for today's bulls and bears. The pullback pattern is likely a tentative move, and the strength of the European session will directly influence the US session's trend. Considering the previously formed downward channel, the upper resistance may shift down to around 4165-4175. We can still short below this level. Although yesterday's pullback was under pressure, the subsequent breakout was somewhat disappointing. Therefore, we still need to tentatively establish short positions today. If the price first rallies to around 4160-4175, we can short, targeting 4140-4110. If the European session breaks above this level, we can adjust our positions and exit during the US session.

Analysis of key technical levels and trading strategies for goldGold traded in a range-bound pattern during yesterday's European and American sessions, closing with a bearish doji candlestick on the daily chart. This indirectly indicates the continued struggle between bulls and bears in the short term. Without a sustained upward trend, the range-bound trading is likely a way to digest excess energy from both sides. After opening higher, it reached a high of around 4169. Continuing from yesterday, the downward channel formed by the previous historical high will likely shift slightly lower to around 4170-4180. This level is crucial for the future direction of the market. A break above this level could potentially push the price up to 4200. Conversely, if this level holds, it would suggest that the current rise is not driven by bulls but rather a prelude and correction by bears to prepare for a potential further decline. The current support level is around 4110-4100, and the intraday price action will be particularly important. If gold breaks through the resistance level today, the bullish momentum will continue. Conversely, the bearish correction may also come to an end. If gold rebounds to around 4165-4180 today, consider shorting with a target of around 4150-4130.
Seeking high-probability trading opportunities in gold.Gold Price Trend Analysis: Looking at the 4-hour chart, gold is currently showing a trend of both higher highs and higher lows. However, using a Fibonacci retracement level, gold is facing resistance at the 0.618 Fibonacci retracement level, specifically around 4155, which triggered a decline. However, it found support at the 4110-4100 area, a previous support level, ultimately closing above 4110. Therefore, today we need to pay attention to the support levels at 4110 and the psychological level of 4100. Long positions can be considered. Looking at the MACD indicator, the fast and slow lines were previously converging, but diverged yesterday as expectations of a Fed rate cut increased. This divergence may continue during the US session today. We need to watch for a break above 4155; if it breaks, a move towards 4180-4200 is expected.
The 1-hour moving averages continue to trend upwards, maintaining a bullish alignment. Reviewing the day's gold price movement, the overall trend remains upward, with a short-term pullback from the 4150-4160 area. It's important to note that gold has seen minimal pullbacks throughout its upward breakout. Even the pullback in the European session only tested the 4110 level before resuming its upward climb. The short-term upward trend remains intact. In the US session, consider buying on dips above 4100. The key resistance level is the same as on the 4-hour chart, at 4155. However, today's price action didn't see a pullback to 4100; instead, it fell to 4110 before rebounding. Therefore, it's highly likely that gold will surge upwards in the evening, breaking through 4155. The key level to watch then becomes 4180, which is the resistance of the previous trendline on the daily chart. In summary, today's gold trading strategy is to primarily buy on dips and secondarily sell on rallies. The key resistance level to watch in the short term is 4160-4180, while the key support level is 4110-4100. Please follow the recommendations carefully.

On November 26th, consider buying gold again after it retraces tOn the 4-hour chart for gold, the moving averages continue to trend upwards, maintaining a bullish alignment. Reviewing the intraday gold price movement, the overall trend remains upward, with a short-term pullback from the 415-4160 area. It's important to note that gold has seen minimal pullbacks throughout its upward breakout. The pullback in the European session only tested the 4110 level before continuing its upward climb. The short-term upward trend is expected to continue, and during the US session, buying on dips above 4100 is recommended.

Short first, then go long. The rhythm was perfectly in place!The bottoming strategy suggested buying low and selling high in gold, and the expected pullback from the 4155 resistance level materialized. Buying near 4110 also precisely hit the low point, resulting in immediate profits. Those who followed the strategy reaped good gains. The intraday strategy of first selling and then buying gold perfectly executed.
From the current gold price structure, the price is gradually completing a shift from strength to weakness within a consolidation pattern. The current upward trend resistance remains concentrated in the 4160-4180 area. Only a decisive break above this trendline resistance will open up further upside potential and usher in a new round of continuation opportunities. Conversely, if it fails to break through, this area may still become a consolidation resistance at the end of a triangle pattern. Therefore, even with an overall bullish bias, it is not recommended to blindly chase the market in the middle. On the 4-hour chart, short-term support is around 4115-4100, while resistance remains around 4160-4180. Trading strategy should be based on the strength of the price action, buying low and selling high at opportune moments.

The bullish trend is back; seize the opportunity today.Gold prices briefly retreated to around 4040 after opening yesterday before trending upwards. The high has now reached 4155, a daily gain of approximately $115. The daily candlestick closed as a nearly full-bodied bullish candle, demonstrating a strong upward trend and raising market expectations for continued bullish momentum. This is especially true given yesterday's bullish breakouts through various resistance levels, with both momentum and strength showing signs of further strengthening. However, it is important to note that the downward trend formed by connecting the previous high and the second-highest point still exists, posing the biggest challenge to the bulls. Key resistance is concentrated in the 4160-4180 area, which will become a watershed between bulls and bears. If gold breaks through strongly and stabilizes above this level, it will likely continue to test the 4200 level. If it encounters resistance and falls back in this area, it means that this rise is more of a correction before a downtrend, rather than a true trend reversal. Support below is in the 4130-4110 area, which is an important retracement point and an extreme support level for the day. Given the current overall bullish structure, this area remains the core reference zone for gradually placing long orders during the day.

The time is right to operate on the upper and lower rails.When gold prices rebounded to around 4095-4110, they encountered significant resistance. This price level is likely a key technical resistance area. It could be the starting point of the previous price decline (i.e., the previous high), an important psychological level, the upper Bollinger Band on the daily chart, or a significant Fibonacci retracement level, such as the 38.2% or 50% retracement level. Near this price level, selling pressure will significantly increase. From a candlestick pattern perspective, this could manifest as a bearish engulfing pattern, an evening star pattern, or consecutive upper shadows, all indicating that the upward momentum is gradually weakening. Therefore, placing short orders in batches around 4090-4110 is advisable, anticipating a pullback after the price encounters resistance and then tests the lower support levels.
The 4030-4020 area forms a strong support level within the current trading range. This level may be a low point platform formed by previous pullbacks, the lower Bollinger Band on the daily chart, or the location of the upward trend line. When the price pulls back to 4030-4020, it will attract bullish funds to enter the market to buy on the dip, while short sellers will also choose to take profits, thus forming buying support. From an indicator perspective, if the price touches the 4030-4020 area, the Relative Strength Index (RSI) may enter the oversold zone (e.g., below 30), signaling an impending price rebound. Therefore, placing long orders near 4030-4020 is an attempt to speculate on a rebound to the upper part of the trading range after the price finds support here. The stop loss is set below 4020 to prevent a larger pullback if the support level is effectively broken.
In summary, the gold market is currently oscillating within the 4030-4020 and 4095-4110 ranges. Trading strategies should revolve around a "sell high, buy low" approach. When the price approaches the upper limit of the range, look for shorting opportunities, targeting the lower limit; when the price approaches the lower limit, look for long opportunities, targeting the upper limit. This strategy often yields good results when the market lacks significant fundamental news. Specifically, short gold around 4095-4110, targeting around 4050; and long gold around 4030-4020, targeting around 4070.
Seize the opportunity to short sell at high levels.Technically, gold closed last week in a range-bound manner, and short positions once again yielded good profits. Shorting in the 4080-4100 range, focusing on selling at higher levels, offered considerable profit potential. Given the overall bearish structure on the 4-hour chart, the strategy of buying low and selling high within the lower range, relying on strong resistance and support (primarily shorting), was also favorable for those who went long. However, given the overall bearish trend, going long against the trend is generally cautious and should be avoided, especially chasing rallies in the middle. There's not much to say technically; the overall strategy remains to patiently sell on rallies. Intraday, if there's another rebound, shorting in batches within the 4080-4100 range can be considered.

Economic growth concerns may be overstated.Gold Technical Analysis: Last week, gold traded in a range. Monday saw a decline, Tuesday saw a dip to a weekly low near 3998 before rebounding to a positive close, Wednesday saw a rise followed by a fall, resulting in a small-bodied positive candle with a long upper shadow, and Thursday and Friday saw doji candles. The weekly chart ultimately closed with a small negative candle with upper and lower shadows, indicating continued short-term consolidation. Looking at the intraday chart, Friday saw another doji, reaching a high near 4101. The previous high of 4110 was not broken, and after a quick rise, the price returned to around 4050, clearly showing a tug-of-war between bulls and bears. This week, the market has been relatively quiet, with no major data releases. Given the limited movement in gold last week, consistently trading in a range from relatively low to high levels, a clear trend is not yet emerging.
Since the daily chart showed a pullback from around 4132, each subsequent decline has been followed by a rebound after testing the bottom. Therefore, this is a strong rebound, not a reversal. However, without a major positive catalyst, the previous resistance level of 4110 will be difficult to overcome. The rebound last Friday, followed by another surge driven by news, has likely extended the adjustment period. Today, Monday, there are no major news catalysts, and the consolidation and fluctuations at the weekly and weekly levels are not yet over. Therefore, the trading strategy for gold today remains range-bound, continuing the 4000-4130 range. The trading strategy is to maintain a short-selling approach, paying close attention to key levels. For now, gold is unlikely to experience significant price movements; a market stimulus is needed to break out with strong directional momentum. In summary, the recommended trading strategy for gold today is primarily to sell on rallies, with buying on dips as a secondary approach. The key resistance level to watch in the short term is 4100-4130, and the key support level is 4030-4000. Please follow the trend closely.

Gold continued to fluctuate on November 24th.Gold is currently trading on the hourly chart, with short-term moving averages remaining flat and converging, compressing the price between 4000-4120 and further narrowing the range to 4100-4130. Based on the current trend, the US session is likely to maintain a slightly range-bound movement. On the hourly chart, the price has broken out of the previous low-level consolidation range, and the candlestick pattern is gradually maintaining a slightly stronger upward trend along the short-term moving averages, suggesting potential for further short-term gains. However, the strength of these gains needs to be assessed, and attention should be paid to any short-term corrections or adjustments.
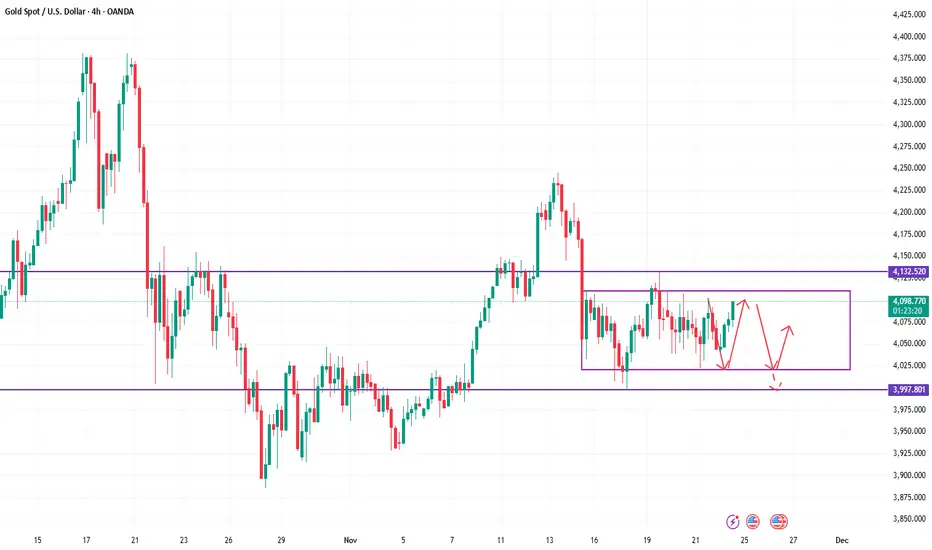
Gold's bullish and bearish trends were perfectly timed this weekGold Technical Analysis: Gold prices have been fluctuating between 4000 and 4110 in recent days, lacking a clear direction. This volatile market requires both caution and opportunity searching. Neither long nor short positions are inherently wrong; the key is precise entry points. Based on this week's closing price, gold reached a high of 4101 before retracing and closing at 4065. Next week, continue to monitor the range-bound movement. The monthly chart for gold may close with a doji, and next week will likely see continued range-bound trading. The weekly chart also shows a doji, indicating no clear direction. While the overall trend remains bullish, the pullback is not yet complete. Looking at the weekly chart alone, next week we temporarily recommend buying low and selling high within the 4110-4020 range until it is broken. A break above this range could lead to 4130-4150 or even 4200, while a break below could target 4000-3980. Strong support is at 3930, with an extreme low around 3886. The daily chart closed with a doji on Friday, so continue with a range-bound trading strategy on Monday.
Looking at the 4-hour chart, it is currently consolidating near the end of a triangle pattern. Once it breaks out effectively, there is an estimated profit potential of nearly $250. Before the breakout, operate within the trading range. Go long near the lower edge of the range around 4020 and go short near the upper edge around 4110. Go short a little earlier, around 4100. On the hourly chart, the moving averages are crossing upwards, indicating a bullish alignment. Currently, 4020 is a key short-term support level. If it holds, it will likely remain within the range. A break below this level could see strong support at the 4000 mark. The 4110 level also presents significant resistance; several attempts to break through have failed. However, this level is expected to gradually narrow over time. The longer the consolidation period, the stronger the subsequent breakout. The fundamentals of the bull market remain unchanged, and there is still room for further upward movement. In summary, the recommended trading strategy for gold is to primarily buy on dips and secondarily sell on rallies. The key resistance level to watch in the short term is around 4100-4110, while the key support level is around 4020-4000. Traders must follow the market closely, manage their positions carefully, and strictly adhere to stop-loss orders. Avoid holding losing positions. For specific trading instructions, please refer to the bottom notifications.
