Opportunities are plentiful; what's lacking is patience.Gold Technical Analysis: On Wednesday, a large bullish candlestick broke through the 4150 resistance level during the US session, ending the recent sideways consolidation. The price reached a high of around 4210. As we repeatedly emphasized on Wednesday, after consolidation, further upward movement was expected, opening a new upward channel. The market has largely lived up to expectations. The key focus now is on the sustainability of this upward move. Structurally, with this strong rally, all timeframes are in a bullish alignment. The immediate resistance levels to watch are around the 4-hour upper Bollinger Band at 4215, and the 0.786 Fibonacci retracement level, around 4275. These two levels are expected to provide some temporary resistance for the bulls. As the price has risen, the support level has gradually moved higher. The primary support level to watch in the short term is 4150. This level is a previous resistance zone that has repeatedly faced downward pressure and is currently a top-to-bottom reversal point. As long as the gold price holds above this level, the bullish trend will continue. The important support level is around 4100. As long as the price stays above this level, the upward trend will not change. Therefore, for the end of the week, we will continue to be bullish with 4150 and 4100 as support levels.
Gold prices have broken through the previous resistance zone around 4150 on the 4-hour chart. Both bulls and bears have made substantial profits over the past few trading days. If the price can hold above 4150, it is highly likely to reach 4250-4270 tomorrow. At the end of the trading day, pay attention to whether there will be a pullback followed by a second upward move. Also, watch for support around 4160-4150 in the final minutes of the trading day. The upward momentum after the recent breakout should continue, although the deviation in the smaller timeframes is slightly large. We should watch for any short-term corrections. On the hourly chart, watch the low of 4097 from Tuesday's pullback. The US session saw a rapid rise above 4150, indicating a low probability of a significant drop; at most, it will only be a pullback. Short-term focus should be on buying on dips, using the 4150 level (a previous support/resistance level) as support, and also looking for opportunities to buy at the 0.5 Fibonacci retracement level. In summary, today's gold trading strategy should prioritize buying on dips, with selling on rallies as a secondary approach. Key resistance levels to watch are 4250-4275, and key support levels are 4150-4170. Please stay on track.
Goldtechnicalanalysis

A massive shockwave crashes against the golden roller coaster.Gold Price Analysis: Yesterday, gold rose but encountered resistance around 4150, then fell back to around 4100 before rebounding and entering a period of consolidation. As of this morning's trading, it failed to break new highs. The first wave of the upward trend since the short-term bottom at 3886 has stalled. 4160 is the starting point of the second wave of the decline after the previous drop from 4380. Short-term pressure and pullback correction are normal. The overall upward trend remains unchanged. The rise from 3886 to around 4150 represents an increase of approximately $265, and the pullback correction is entirely a normal technical adjustment. However, after encountering resistance around 4150, the upward movement will be delayed. After Monday's surge, many people thought that a rally of over $100 in a single day was coming again. But now, the market is generally in a large range of high-level fluctuations, and it's impossible for it to rise by $100 every day. However, the overall daily uptrend remains unchanged. After a short-term correction, a second wave of upward movement will begin. But there is one thing to be aware of: this wave is a rebound correction after the drop from 4380. If it takes too long to break through and fails to rise further, we should be wary of a weakening momentum and subsequent decline. So, if the market fails to break through the resistance of 4150-4160 after this period of consolidation, the bulls should be cautious.
Gold Technical Analysis: After the morning's pullback, the MACD lines turned downwards again, continuing the death cross signal. Gold prices also showed a structure of lower highs, currently under pressure at the $4145 level. However, since the fast and slow lines are still running above the zero axis, if gold prices cannot fall further and cause the fast and slow lines to cross the zero axis, the bulls may launch another counterattack. The failure to break yesterday's high in the morning indicates that the bullish trend has slowed down. However, the failure to break yesterday's low of $4097 during the Asian session suggests that the bears are not strong either. The battle between bulls and bears is intense, and gold prices have entered a new adjustment period. Therefore, today's strategy remains to sell high and buy low. In the second half of the week, gold will continue to focus on testing the support level below. Currently, the moving averages show signs of crossing upwards, increasing the possibility of gold extending its rebound. However, the short-term upward movement was too sudden and the magnitude of the movement was too large, which brings great difficulty and risk to the operation. Therefore, even if the short-term outlook turns bullish, in actual operation, it is still necessary to wait for a pullback before considering going long. Do not blindly follow the bullish trend without considering the price level. In summary, today's gold trading strategy is to mainly buy on dips and sell on rallies as a secondary approach. The key resistance level to watch in the short term is 4145-4160, and the key support level to watch in the short term is 4110-4095. Friends, please keep up with the rhythm.

Perfectly grasp the rhythm of gold trading.Gold has maintained a strong upward squeeze this week, steadily climbing and breaking new highs. Currently, we are watching the 4145-4150 level as short-term resistance. A pullback and consolidation are needed to break through this level. The moving average system shows a bearish divergence, and the price has stalled at higher levels, failing to break through. There are currently no good entry points. Although the market outlook is bullish, we should wait for a pullback to the 4125-4110 area before considering long positions. The technical indicators need correction, so chasing the upward trend is not advisable. We should patiently wait for a pullback before looking for opportunities to go long!

Continue to buy gold after the correction!Gold opened on Monday and immediately began its upward trend, relying on the short-term moving average. It broke through two key resistance levels in succession, soaring once again. The daily chart showed a large bullish candle, breaking through the 4100 psychological level again, forming a strong upward spike and raising expectations for further gains. The weekly chart also broke through the short-term moving average again. Judging from the current pattern, the strength formed after the continuous upward movement is likely to continue strongly. Although there was a slight pullback during the US session, it ultimately continued its rapid upward climb. For now, we remain bullish on the gold market. The key resistance level remains around 4150, which will be the first target in the near term. The support level remains around 4110-4100, which is also one of the first pullback correction points for the bulls in the short term. If gold pulls back to around 4115-4100 during the day, we suggest going long on gold, with a target of around 4130-4150.

Right now, I've discovered another market opportunity.We publicly pointed out that we should pay close attention to the resistance in the 4100-4120 range. After encountering resistance, a pullback was expected. The market trend was largely in line with our expectations, with the lowest point reaching around 4074. We were very satisfied with the substantial profit we achieved.
There was indeed some upward movement during the day. This week, we need to focus on the news: Although the market continued its strong performance at the beginning of the week, it was easy to create the illusion that a "sharp rise was about to happen". However, the government shutdown is now in its final countdown, so we need to be wary of potential risks. Once the shutdown ends, the market may see a significant pullback. Since relevant news has already released signals, we should remain rational about the recent rise and not blindly follow the trend. There is always something fishy going on, so it is better to be cautious. For more detailed instructions, please refer to the notification at the bottom.
From a technical perspective, gold has repeatedly faced resistance near 4110 after breaking through 4100. It is severely overbought in the short term and shows signs of a potential top. I personally do not recommend continuing to buy at this high level to avoid a sharp drop, which is a common market shakeout pattern. Therefore, my strategy remains to prioritize short-term shorting. From the current structure, 4100 has not truly stabilized. Do not blindly and aggressively chase the upward trend. Focus on short-term adjustments and seize opportunities to trade within the time frame. Short positions can be initiated in the 4100-4120 range, with a target of 10-40 USD. The key support level to watch is 4050-4030, which can be considered as a range for buying on dips and medium- to long-term positions. It is best to remain on the sidelines and not participate in positions in the middle range. The 4100-4120 range remains a key focus for short-term bears. Market trends don't only rise or only fall. If you grasp the opportunities well, every phase can be a chance. Generally speaking, don't blindly chase the rise when you're bullish. Flexibly manage the rhythm of primarily long positions and secondarily short positions, and follow the trend to achieve steady success.

The gold price trend is clear; opportunities lie in the timing!At the start of the week, the gold price chose a clear upward direction, breaking through key resistance levels at 4030 and 4050, reaching a high near 4095. From the overall trend structure, the bullish momentum remains strong, and the short-term trend is still robust. However, the upside potential is gradually being limited. The biggest mistake in trend trading is chasing emotions. I personally prefer to focus on resistance signals in the 4100-4120 area. If signs of resistance appear, consider shorting at higher levels. If the price retraces to the 4050-4030 area and stabilizes, that would be a more stable entry point for long positions. After the breakout, the pace accelerates. The key now lies in entry points and execution. Avoid chasing highs and blindly shorting; steadily follow the rhythm and wait for market confirmation. True stability lies not in prediction, but in the unity of execution and rhythm.

GOLD (XAUUSD): Support & Resistance Analysis for Next Week
Here is my structure analysis for Gold for next week.
Support 1: 3868 - 3927 area
Support 2: 3766 - 3830 area
Support 3: 3690 - 3736 area
Resistance 1: 4023 - 4109 area
Resistance 2: 4187 - 4245 area
Resistance 3: 4357 - 4383 area
As we discussed earlier, the price is stuck within a range now
and we see a consolidation.
With the absence of high impact fundamentals, a sideways price action
will likely continue.
❤️Please, support my work with like, thank you!❤️
I am part of Trade Nation's Influencer program and receive a monthly fee for using their TradingView charts in my analysis.

The continuous short positions in gold have ended perfectly!Whether gold can break through resistance levels in the near term depends on the convergence of three factors: First, whether the US dollar and US Treasury yields experience a more sustained decline, creating room for discounting; second, whether risk appetite strengthens the "insurance demand" for gold due to equity volatility and increased macroeconomic uncertainty; and third, whether net inflows of funds continue, especially whether passive funds and longer-term allocation funds enter the market simultaneously. If these three factors fail to move in tandem, the price will likely continue to consolidate within the $3930-$4000-$4050 range. If they move in unison, the resistance above these round numbers will weaken more smoothly. It's worth noting that the People's Bank of China suspended its 18-month gold purchase program in May 2024 but resumed it in November of the same year. The market currently expects a 67% probability of a Fed rate cut in December, up from around 60% the previous trading day. The Fed just cut rates last week, and Powell stated that this may be the last rate cut this year. The market's current focus is on macroeconomic data and when the US government shutdown will end—which is also driving safe-haven demand for gold. The congressional gridlock led to the longest government shutdown in U.S. history, forcing investors and the data-dependent Federal Reserve to rely on private economic indicators. Since gold does not generate interest income, it typically performs well in low-interest-rate environments and periods of economic uncertainty.
Gold Technical Analysis: With the non-farm payroll data still pending, gold prices are likely to fluctuate little tonight, mainly consolidating. The battle between bulls and bears continues throughout the day. During the US session, gold rebounded to around 4027. We had already positioned short positions at 4015 and 4025, which subsequently fell back as expected, resulting in a profitable trade. This week's trading session has concluded perfectly, and we will not participate in the late-session trading. Our strategy remains to short below 4030.
From a technical analysis perspective, key resistance and support levels need to be monitored. The upper resistance level to watch is the 4020-4030 area. If gold prices can break through this range and hold, the upward trend may continue in the short term, potentially challenging higher levels. Before this breakout, we have consistently emphasized against chasing highs and have provided a strategy and analysis for shorting in batches around the 4015-4030 area. Those who follow me should have seen this. Gold faces significant upward pressure, and unless there is a major positive news event to stimulate a breakout, we will continue to maintain a strategy of selling on rallies. Due to the lack of non-farm payroll data, gold prices will continue to be treated as oscillating. The lower support level is seen in the 3975-3960 area. If this support level is effectively broken, it may trigger a new round of declines, potentially opening up further downside potential.

Will gold's rebound be followed by another decline?It's hard to explain in a few words. By Friday, the market was still fluctuating and oscillating. Gold had just reached a very critical juncture. Is there anything strange about the current position? No, not really. We've seen 4000 points multiple times since Monday, but the candlestick patterns and their arrangement have gradually turned 4000 into a significant resistance level. Two trend lines are evidence of this. First, there's the downtrend line at the top, which is right around 4000. I know it broke down, but does breaking down mean it has stabilized? We definitely shouldn't rush to make a decision.
Moreover, the upward trend line at the bottom is clearly over, and the expected resistance level is exactly the same as yesterday's level around 4020. If you look at it this way, it's a perfect double top pattern. I don't need to say what this pattern should do, it's definitely bearish. You can also put the stop loss above 4030, a loss of only about 10 US dollars, which is quite cost-effective. If it can break through 4030, then there's no need to trade anymore, just in case gold goes crazy. It's quite comfortable like it is now.
Finally, there's the issue of targets. I'm actually struggling with this too. Today is the last trading day of the week, and holding positions over the weekend isn't ideal. However, assuming 4018 really did top out and the price actually fell, exiting midway would be a huge loss, and it might be difficult to find a good entry point later. Regardless of how much it could fall, at least after this double top pattern formed, gold breaking below 3960 shouldn't be a major problem. Conservatively speaking, I'd suggest aiming for 3980, depending on whether you're a short-term trader.
Since the price of 3960 has encountered support and rebounded multiple times this week, there's no need to set a target at 3960. In other words, if it really drops to 3960, it might go down, resulting in a profit of about $40. Let's just see if it reaches 3980. As for whether to go long again later, I still suggest avoiding unnecessary trading. Everyone keeps saying they want to see the US government reopen, but it's been two days since Trump suggested ending the lengthy debates, and there's been no new information, not even news of a vote.
After such a long closure, and the second time the non-farm payrolls report was missed, even inflation statistics are being compiled, so why isn't employment data being collected? If I were to speculate maliciously, I'd say it's because employment is simply unsustainable. Just think about how long the closure lasted in October; aside from everything else, how much of the workforce has been lost officially? Not to mention the current situation where businesses have low demand. Previously, layoffs were slow and hiring was gradual, but now layoffs are being accelerated and hiring is being reduced. I really don't know how shocking the non-farm payrolls report will be. This is why I expect the market to fall at the open and then rise. The data is too uncertain, and it doesn't look like good news no matter how you look at it. Let's wait and see. I'm actually hoping that the market will break through this level starting from the opening.

Selling on rallies remains the dominant strategy for gold!Yesterday's closing price was around 3977, with a low of around 3964, successfully reaching the 3980-3960 range I predicted. I consistently emphasized against chasing the price higher yesterday and provided a shorting strategy around 4020-4030. Congratulations to those who followed my analysis for substantial profits. Gold faces significant upward pressure, and unless there's a major positive news catalyst, a breakout is unlikely. Otherwise, we will continue to focus on selling on rallies. Today, Friday, is the non-farm payrolls report; we will maintain our strategy of selling on rallies during the day. If you're currently experiencing difficulties with your trading, and I hope to help you avoid common pitfalls, feel free to contact me for discussion!
From the 4-hour chart, gold is maintaining a generally bearish trend with some volatility. The upside resistance is around 4010-4020, with a key resistance level near 4030. Support is around 3970-3960. The recommended strategy is to sell on rallies, observing more and acting less in the middle range, avoiding chasing the market, and patiently waiting for confirmation at key levels before entering the market. Specific trading strategies will be provided at the bottom; please pay close attention.
Gold Trading Strategy: Sell gold in batches in the 4010-4030 range on rebounds, with a target of 3980-3960.

"Short-selling is correct" - Gold consolidation awaits breakout.Gold prices have indeed been somewhat sluggish recently, fluctuating repeatedly within a range. While this volatility can be agonizing, it reflects the market's rhythm. In terms of trading, avoid blindly chasing highs and lows. If you're bearish, don't chase the market down. Patiently wait for a rebound and resistance before entering a position. The recent market rhythm is very clear: sharp rallies are prone to pullbacks, and sharp drops are prone to rebounds – typical characteristics of a range-bound market. Our trading advice remains clear: focus on the 4010-4030 area. If a rebound fails to break through resistance, continue shorting, building positions in batches and proceeding steadily. We have repeatedly emphasized that gold is currently in a range-bound, slightly bearish adjustment phase, with the overall center of gravity continuing to shift downwards. Short-term rallies do not signify a reversal, and so-called signals are often just bull traps. High-level rebounds remain a good opportunity to establish short positions. Market conditions can change rapidly, but there are always patterns to follow. Don't be misled by appearances; look at the underlying logic and structure. Gold is still in a downward continuation phase. Rebounds present opportunities, while false breakouts pose risks. Gold prices fell as expected. Although we exited early and missed the lowest point, a steady exit is a victory in itself. Trading is never about who is more greedy, but about who knows how to control the pace better.

The bears' rhythm is clear, and their direction remains firm!Gold's early morning dip yesterday did not continue, and it even broke through the important resistance level of 3990 during the European session. Today, it broke through the 4000 mark, reaching a high of around 4020, which is the resistance level we predicted earlier. The price has accurately reached the 4020-4030 rebound range, and then quickly fell back to around 3978 and fluctuated. I believe that those who followed the plan have made a steady profit. Judging from the current trend structure, gold is likely to continue its oscillating rebound, but the short-term rebound space is limited. The key resistance area to watch is still 4020-4030. If the rebound fails to break through the resistance, it will still be a good opportunity for short sellers to position themselves. In terms of strategy, we will continue to focus on shorting on rallies, entering positions in batches with small positions, controlling risks, and moving forward steadily. If you've been struggling with your recent trading and want to avoid pitfalls in complex market conditions, feel free to contact me. I'll do my best to help you clarify your thinking and master your own trading rhythm.

Gold breaks through $4,000, has the bulls returned?You might be surprised if I said gold could continue to decline? But the truth is, I'm not surprised. I see this round of trend very clearly: the break below the 4000 mark was just a brief "acceleration" rather than a true reversal of direction. After the price broke through, it quickly rose to around 4017. This performance is more like an emotional release than a trend reversal. After all, the 4000 level has been breached or recovered many times before. There have been too many short-term fluctuations, and the real significance has already been digested by the market's inertia. I maintain a bearish outlook because the chart structure has reached the testing area of the channel's low point, a key position I have repeatedly emphasized. There are only two possibilities for the trend: either the market will soar upwards and return to the upward channel, or it will begin a new round of decline. What I want to seize is the volatility opportunity in the latter. Looking at the key levels: the highs this week are 4050, 4040, and 4030. If the rebound stops in the 4020-4030 area, then a short-term top has likely appeared. At this point, entering a short position would be extremely cost-effective. As long as the market cannot regain a foothold above 4030, I remain firmly bearish, with targets to watch for a break below 4000 and further down to the 3980-3960 area. I don't strive for perfect predictions, but every move I make must be logical, structured, and valuable. When opportunities arise, do not hesitate or waver; execution is key. Seek victory through stability and do not blindly follow the noise of the market.

Gold Short-Term Technical Analysis Guide (November 4th)!!!Gold is showing a converging pattern on the 1-hour chart, with moving averages clearly intertwined and failing to establish a strong directional trend. Gold is currently facing resistance around the 4000 level and hasn't shown a strong upward breakout. If gold breaks through and holds above 4000, then the 4020-4030 resistance zone should be monitored during the US session. Overall, gold is expected to remain in a range-bound market.
Gold prices dipped and rebounded; watch for 3980.Gold prices traded within a range today, with bullish and bearish forces relatively evenly balanced.
In Asian trading, gold opened lower and quickly dipped, hitting a daily low of $3962 before rebounding. As of pre-market trading, gold is currently trading around $4000. Looking at the hourly chart, the Bollinger Bands are narrowing, and gold is trading below the middle band, exhibiting typical range-bound trading characteristics.
During the US session, watch for resistance at $4030. A break above this level could present a buying opportunity on a pullback, with a target of the $4050 area. If prices fall again, watch for support around $3980. In short, the market remains range-bound; avoid chasing highs or lows.

Gold: Bearish Divergence Signals Weak MomentumFenzoFx—Gold tapped into the $4,050.00 buy-side liquidity yesterday, currently trading below this level. The cumulative volume delta demonstrates a lack of buying interest in gold, formed a bearish divergence with the price chart.
From a technical perspective, if Gold remains below $4,050.00, the price will likely decline toward the equal lows at $3,925.00.

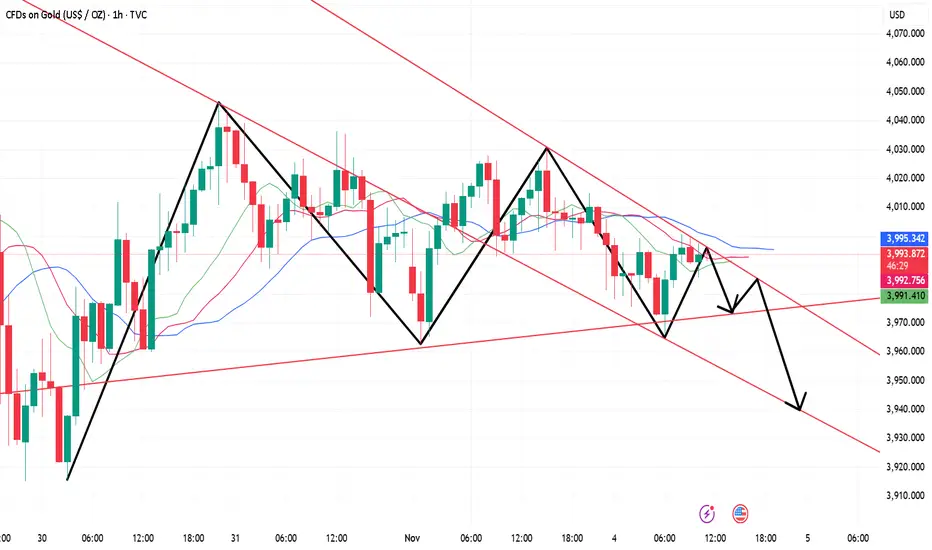
Beware of Black Friday as gold prices fall againOn Friday, the Asian session reaffirmed the upper resistance level of the channel at 4142-4144, further declining to 4081.
Can this trend continue, with the market holding highs and breaking lower, and breaking through the lower double-line on the hourly chart, the next support area to watch is the lower channel at 3990-3980.
The 3980 area is what we call the target point, representing a gap of exactly $400 compared to the historical high of 4380.
The hourly chart is sweeping the double-line range, with a breakout further opening up the market.
The upper channel is slightly further away at 4180, while the lower channel is getting closer. In the 4035 range
Support and resistance levels are shifting. If the market breaks below the lower double-line at 4035, the next target is the 4014-4004 low. The next target is the lower channel line, and breaking through it will continue the trend.
Holding highs is key, and breaking lows is crucial. Although the market fluctuates greatly, each initial move follows its own pattern.
Starting an uptrend, holding lows and breaking highs, holding lows throughout the process, and continuing the bullish climb.
Starting a downtrend, holding highs and breaking lows, holding highs throughout the process, and continuing the bearish decline.
To summarize, two points:
1. Maintain a cycle Regarding the rhythm of the decline, the area around 4100 should be considered as the dividing line. Looking down, we should look to the 4080 area. A break below this level could lead to further trading volume (don't expect a large rebound to confirm resistance).
2. A wide-ranging sweep, with the high of 4144 as a defensive measure, requires considering the 4133-4135 area, and then looking for leverage to complete a break below the lower low (this rebound will be more powerful, requiring additional attention to the highs).
Thus, regarding the future gold price, we should refer to the above-mentioned approach. First, the 4144 high should be used as a defensive measure. Here, we should consider the 4133-4135 area, and then look for leverage to complete a break below the lower low (this rebound will be more powerful, requiring additional attention to the highs). Pressure around 00: A slow decline is needed to break the lows. Time is used to buy space to find the lower band of the channel.
First, pressure at 4135 represents a correction. A break above 4080 will be leveraged to move lower, followed by a large-scale decline.
Focus on gains and losses at 4080. If it breaks below, the next target is the lower double line at 4035. Breaking through this level will lead to lower points at 4014-4004. Finally, focus on the lower band of the channel at 3990-3980.
Note: A break above this high will indicate a change in the nature of the market.
Clearly define your defenses, establish your strategy, implement risk control measures, and strictly enforce them.

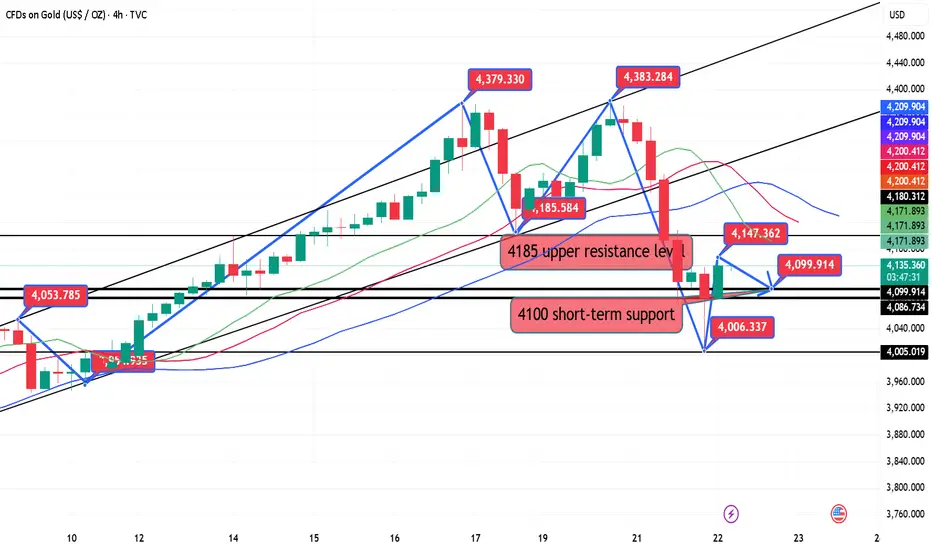
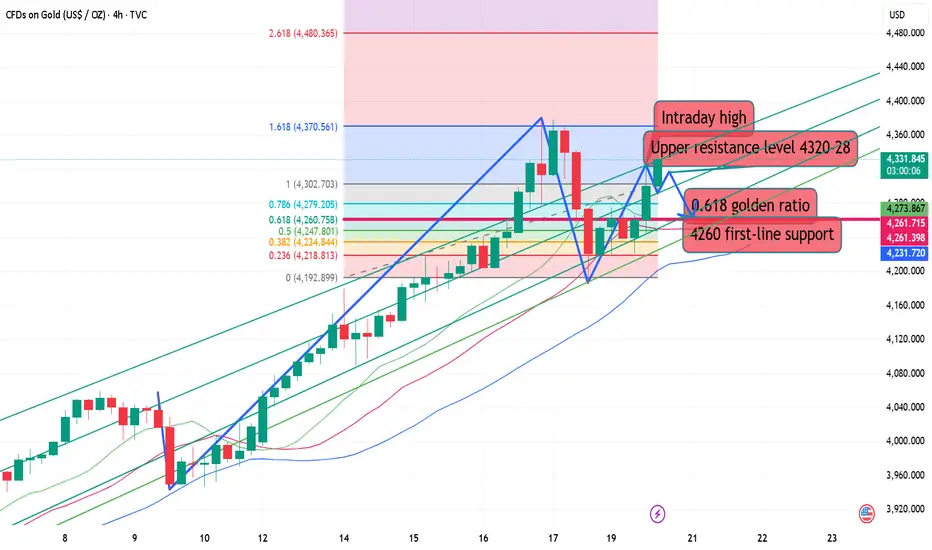
10, 23 gold is still expected to fall!!!This week, gold hit $4380 for the second time before retreating, forming a double top. The upward rebound was interrupted by a break below 4293. A break below the previous low of 4186 marked the first time a secondary decline has occurred, breaking the previous correction pattern. Previous declines have not resulted in a secondary break below the previous low, let alone a downward extension. Therefore, this time represents a shift in rhythm, a pause in the bull market, and a period of rest and consolidation. The bull market needs rest!
Short-term, yesterday's Asian session rebounded, reaching 4161 before retreating around 2:00 PM. Today, we will focus on the overnight rebound high of 4118 and the 2:00 PM timeframe. Specifically, relying on the resistance at 4118, we can short in the European session and continue to watch for a decline.
Specifically, keep an eye on the resistance at 4118 and consider shorting when the time is right.

10.22 Gold continues to correctAfter forming a double top early Tuesday morning, gold has been experiencing resistance during Tuesday's Asian session, signaling a potential Waterloo. As of Wednesday's Asian session, gold hit a low of 4004 before rebounding above 4100, a bullish consolidation. Gold is currently trading in a range-bound environment. We continue to monitor the 4147-50 resistance level, which also marked the resistance level at midnight Tuesday. Gold prices retreated after hitting this resistance level several times last night. During the day, we will monitor the upward resistance level. If gold fails to break through, we will maintain a volatile trading strategy. We will prioritize shorting within this resistance level.
From the 4-hour chart, we are currently focusing on the 4147-4150 resistance level for the upside, while the -4085-4100 support level is expected to remain. If bulls fail to break through, gold will likely continue its range-bound correction. Trading strategies should prioritize trading within this range. In the intermediate range, we should be cautious about buying orders and wait patiently for key entry points. I'll provide detailed trading strategies during the trading session, so please stay tuned.
Gold Trading Strategy:
1. Short gold with a light position at 4147-4150, stop loss at 4156, target at 4085-4100. Hold if it breaks through!
2. Go long gold at 4085-4095, stop loss at 4078, target at 4145-50. Hold if it breaks through!
10.21 Gold Intraday Short-Term Trading GuideGold currently has a clear double top on its 4-hour chart, with Friday's low of 4186 acting as the neckline. If it falls below 4186, a double top will form, and the downward trend will accelerate. In the short term, it is likely to move further towards the 4100-4080 area. If it does not break through 4186, the market will rebound again.
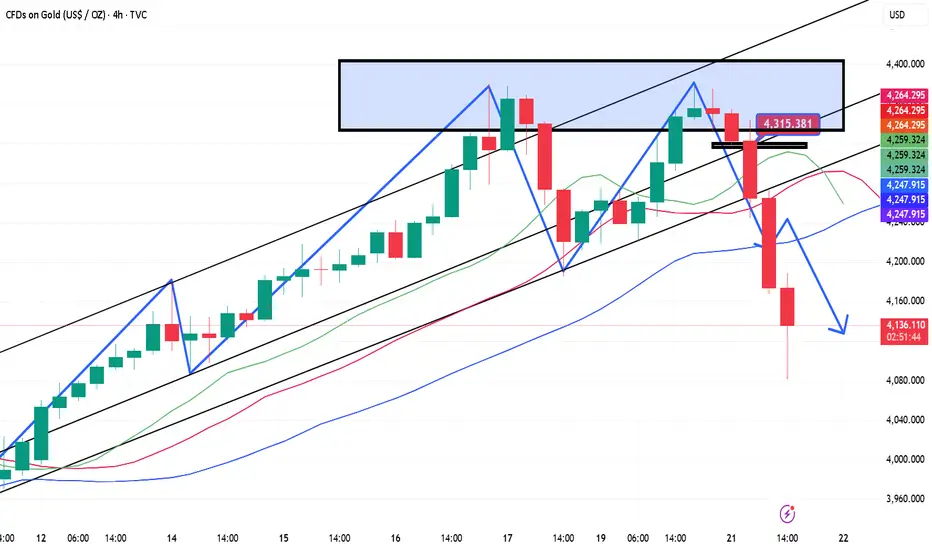
10.21 Gold correction continues to riseTechnical Analysis
The 4-hour MACD formed a death cross with shrinking volume, converging and flattening, indicating current volatility. The 4-hour candlestick chart also closed at a high level with a small Yin-Yang candlestick. The question now remains whether the candlestick chart will rise directly or retrace to the middle line near 4292. A direct rise would not fall below the morning's low of 4332.
The hourly chart began to fluctuate and decline after trading sideways this morning. Currently, attention is focused on support near 4332. The hourly MACD formed a golden cross with shrinking volume, and the STO indicator corrected downward, indicating a potential decline in the hourly chart. Current support on the hourly chart lies around 4332-4327 and 4302.
In summary:
The daily chart suggests today's decline is not over, and will likely reach at least 4300. The question now remains whether the 4-hour chart will fluctuate at a high level or rise directly. A direct rise would likely lead to a continued rise to around 4420, while consolidation at a high level would likely lead to a decline. Therefore, a short position around 4372-4377 is feasible. As for long orders, they need to be placed near 4267-4275, and the first long order can be placed near 4296-97.
Strategy:
Short near 4368-70, defend 4382, target 4335-4300-4270
Long near 4296-97 below, defend 4290, target 4330
Long near 4268-72 intraday, defend 4262, target 4300-4330-4370, etc.
Breaking above 4382 will directly lead to the 4410-4420-4480 line, so if it breaks above 4382 and then falls back to 4370, go long.
Like
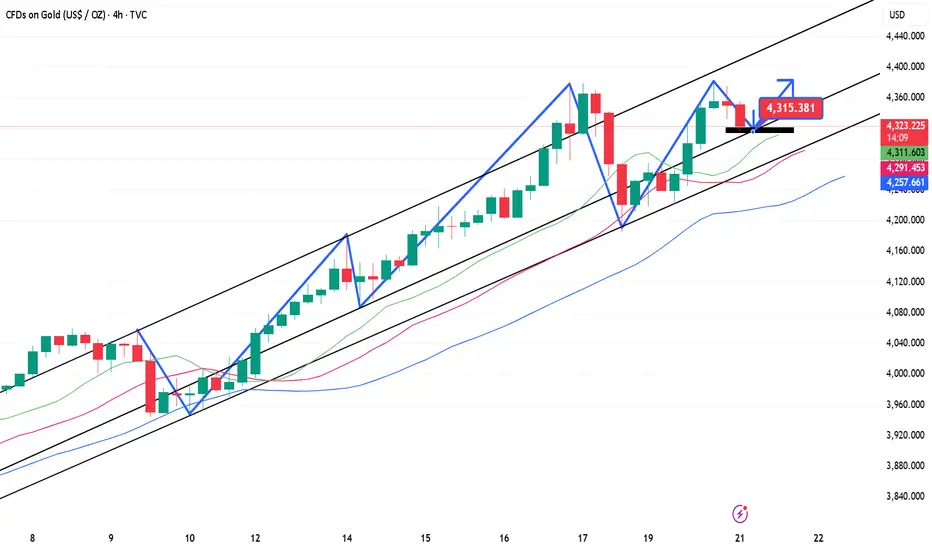
10.20 Gold breaks out of volatility and accelerates its riseThe 4260 level can be considered a short-term watershed, primarily because last week's upward movement peaked at 4380. The initial decline occurred at this level, and after rebounding below 4380, the price fell again, breaking below this level and reaching below 4200. However, this trend has not been sustained, and the price has risen again after breaking through this level in the US market. Therefore, in terms of future trading strategy, I personally believe that gold prices will continue to rise, and I recommend waiting for a pullback before continuing to invest in bullish long positions.
In short, 4260 is considered a watershed between bulls and bears, and also a protective level for our future strategies. The recommended entry point is around 4300, with an eye on resistance at the previous high of 4330!
10.20 Gold short-term resistance looks at 4280Gold prices twice confirmed their all-time high of 4380 before falling, the first time by $100 and the second time by nearly $200.
Last Friday, gold prices were insane, plummeting from 4380 to 4279, leaving $100 of room for further gains, before rising another $100 to find 4380.
After confirming resistance at 4380 for the second time, the price continued to rise, signaling a downward trend. Pressure was placed on the short side at 4380, 4355, 4350, 4321, and 4364. The price continued to move around the established downward trend, gradually shifting between levels, and finally accelerating to 4186 before ending the decline.
The price rebounded in late trading, returning to the 4250 mark to end the week!
Judging from Monday's market action, the market has entered a broad range-bound sweep. Specifically, the bullish rally may have temporarily paused, gathering momentum for a subsequent rebound.
We must clearly understand the positioning of our defensive lines. When these lines are breached, adjustments and changes must be made:
1. Coordination between the two lines on the hourly and 30-minute charts
It has fallen back into the 30-minute chart's two-line range, between 4280 and 4110.
It remains above the upper limit of the two lines on the hourly chart, at 4221. Although it broke briefly last Friday, the closing price quickly recovered. Support is also being sought at 4221 in the European session this afternoon.
The upper limit of the two lines, 4280-4220, is where the support is being sought.
If the price breaks through this range, the nature of the market will begin to change.
2. Top and bottom reversal positions and Within the small channel, pressure is building up in the 4280-4385 area. The lower band is extending and expanding, focusing on the 4180-4200 range.
In the Asian session, prices fluctuated around the 4219-4271 range. In the afternoon, we confirmed that the 4268 area was beginning to bearishly bearish. Based on this strategy, we chose to enter a bearish position from above, targeting the 4220 area. Once the price started to move, we would aggressively chase the price, pursuing the bearish trend until it accelerated to the 4221 area.
Short-term strategies for the European and US sessions
1. Short-term trading in the 4278-4282 area, with the upper pressure at 4286, a stop-loss at 4298, and a target of 4250. The next target is 4225-4215.
2. After completing the $100 sweep, focus on the 4320 area for short selling. The specific target is a bit further out, so stay tuned for real-time alerts.
3. Currently, the price has returned to around 4260, so we will wait for the plan in the first point.
