XAUUSD: 8/9 Today’s Trading StrategySpot gold rose slightly on Friday and is currently around 1926. After the ISM non-manufacturing index on Wednesday showed that the service industry is still strong, the number of initial jobless claims released on Thursday hit a six-month low, which also showed that the labor market is still resilient, once again strengthening the market's tightening expectations for the Federal Reserve, and the U.S. dollar index remains strong. . Yesterday's fundamentals showed that the number of initial jobless claims in the United States in the week to September 2nd was 216,000, lower than the expected 234,000, and a new low since the week of February 11, 2023. In line with the recent strong US data, the US dollar index has been supported, and gold, silver and non-US prices have fallen. Today's fundamentals mainly focus on the monthly US wholesale sales rate in July.
Looking at the 1-hour trend, gold has been on a downward trend, and its rebound has been suppressed by the downward trend line! Still a bearish downtrend! However, there has been a divergence in the strength of the decline, indicating that the strength of the decline has been exhausted and there is the possibility of a rebound! However, the upward pull of the U.S. dollar seems to be very strong, suppressing the probability of the gold price falling below this range, suppressing the gold price to fall back, and choosing a direction in the short-term consolidation. The gold daily K-line has fallen for 4 days, and the price has fallen continuously to 1915 recently. The market is gradually approaching the daily mid-term support, and the decline speed is slowing down. Since the 1914-1910 range is the long-short conversion range in the previous market, we can regard it as a short-term support range. That is to say, as long as the bulls trade sideways at 1910, it will still It can rise at any time, so since it does not fall, there is no need to go short. Gold opened at 1919.49 US dollars in early trading. After the opening, there was a shock and rise. The current highest point is near 1927. At $1915, a positive closing line appeared, and there was a stop-fall resistance. The weak market of gold prices in the market outlook is expected to change, and it will further return to the weekly level. Therefore, in terms of operation, Jieese suggests that the main idea is to do long at low positions, and focus on the 1918-1920 position below.
Gold operation strategy:
BUY:1919-1922
SL:1914
TP1:1926
TP2:1930
Goldtoday

Gold prediction interval 1915~1930Gold Layout Analysis: U.S. Treasury yields consolidated their weekly gains on Friday as U.S. yields edged higher on growing expectations of tightening policy from the Federal Reserve. The 2-year U.S. Treasury bond yield is 4.99%, and the 5-year and 10-year yields are 4.40% and 4.26% respectively. The yields on government bonds of these three different maturities all rose modestly, limiting the rise in gold prices on the day. Investors are eagerly awaiting U.S. consumer price index (CPI) and retail sales data for August to be released this week to continue betting on the Federal Reserve's next policy decision. Currently, the market expects another 25 basis points (bps) rate hike for the rest of this year, but the market is unsure whether the rate hike will occur in November or December. For gold traders, the most important economic data in the coming week is the U.S. August CPI and PPI, which will be released on Wednesday and Thursday respectively. Market participants will also be watching U.S. retail sales data for August and the European Central Bank's interest rate decision, both due on Thursday. Optimism has faded from precious metals markets as less than half of retail investors expect gold prices to rise this week, while most market analysts have returned to a bearish bias.
the
The golden daily line is in the peaking and falling stage, the MA5-MA10 moving average maintains the trend of dead cross, and the MACD green column can start to increase the volume; the weekly line is also in a concussive downward pattern, the Bollinger middle track under pressure continues to fall, and the three Bollinger Bands tracks open downward at the same time. , the decline is expected to go lower. At present, the 1930 mark has been tested many times and it has fallen back. The pressure above is obvious, so continue to maintain the bearish thinking. Focus on the key watershed of 1915. Once it clearly falls below, the downside risk will further intensify and it is expected to test near the 1900 mark. For a rebound, just focus on around 1928.

Today we focus on 1933~1937 to 1915~1917Gold layout analysis: The strong performance of U.S. economic data released last week supported the dollar's strength again. On Tuesday, Fed Governor Waller spoke, believing that policymakers can raise interest rates cautiously. The U.S. ISM non-manufacturing industry recorded 54.5 in August, released on Wednesday. Better than market expectations of 52.5, this increased expectations for the Federal Reserve to raise interest rates in November, pushing the dollar to continue to rise and suppressing gold prices.
Gold is currently relying on the support of 1915 to ease its decline, and it has also shown signs of bottoming in the short term. However, it hit the 1930 mark and fell again, which did not change the bearish trend of peaking at 1950. The daily line is in the peaking and falling stage, the MA5-MA10 moving average maintains the trend of a dead cross, and the MACD green column can start to increase the volume; the weekly line is also in a concussive downward pattern, the pressured Bollinger middle rail continues to fall, and the three Bollinger Bands rails open downward at the same time. The decline is expected to continue lower. The focus now is to focus on the key watershed of 1915. Once it clearly falls below, the downside risk will further intensify and it is expected to test near the 1900 mark. For a rebound, just focus on the pressure near 1926.
Focus on the position of gold: shorting near the 1933~1937 position, stop loss 6~7 US dollars, target 1917-1915

XAUUSD:6/9 Today’s Trading StrategyThe U.S. dollar index continued its upward momentum on Wednesday and is currently trading around 104.7. The next day, spot gold was suppressed by the rise in both the U.S. dollar and U.S. bond yields, closing down 0.64% at 1926.09. The U.S. dollar index rose all the way, once reaching the 105 mark, and closed up 0.64% at 104.81.
Gold opened lower in the morning and fell slowly today, with the price of gold maintaining a slow downward trend near the 1925 line. Gold had a clear correction yesterday, with the daily line closing out a clear negative line, currently near the short-term line, further showing signs of weakness on the part of gold bulls, and the rebound trend midway was very weak. Although the U.S. market tried to counterattack many times, it was eventually crushed. . The price went straight down from 1938, and fell below the rising trend line in the European market. The counter-pressure of the rebound in the evening continued downward. The barbar of the daily chart closed, the price fell below the 5-day and 10-day moving averages and closed below, and the current support is here, but The weak short position on the daily line has appeared. The market outlook will focus on the middle track. It remains to be seen whether it can break down further. Once it is broken, the market outlook will continue to decline. Therefore, for today's market, high altitude is still the best choice. The daily K chart shows random The indicator is in a dead cross state and the main trend is a bearish signal. The key support level is around 1920, and there is also a dividing line support level around 1918. These support levels form relatively strong support areas.
Therefore, some corrections may occur during the day, but continued declines require further news stimulation. Therefore, Jiesse suggests that the upper pressure level should focus on the vicinity of 1934-1935 in operation, and the lower target is still to break the bottom, but it is necessary to pay attention to the support level around 1920-1918. In terms of operation, it is recommended to go short after rebounding to a high level, and then go long after going back to the high level. If it does not break 1920, you can participate in long positions.
Gold operating strategy:
SELL:1932-1935
SL:1943
TP1:1928
TP2:1924

XAUUSD:5/9 Today Gold Trading StrategyDuring the Asian market on Tuesday, spot gold maintained a slight decline during the day, and then fluctuated within a narrow range, now around 1936. Yesterday, the price of gold continued to fall back under pressure after rising high. It rebounded slightly during the Asian and European trading periods, and then accelerated to rise but fell back due to the resistance of the 1946 line. The U.S. market experienced a continuous decline and continued to decline below the 1939 mark, the morning's rising point, and finally closed around 1936.
Gold's cross K-line was basically flat yesterday, and the second test of highs fell slightly. The overall space is not big. It is not so much a fall, but a horizontal correction. The daily chart has closed the cross K-line for three consecutive trading days, which is the end of the rebound. It remains to be seen whether it will turn back down or continue to rise after a partial correction. At present, the bullish trend remains unchanged and gold’s performance remains strong. Therefore, we cannot easily say that it is time to place short orders at high positions. Our resolutely bearish signal has yet to appear. Therefore, gold is likely to continue to fluctuate at high levels this week, either waiting for bulls to continue rising or waiting for bulls and bears to turn around and get out of a downward trend. This week's gold trend is not expected to be obvious until after Wednesday, so everyone needs to wait patiently. Regarding the shock at the beginning of the week, we need to pay close attention to the market changes on the day, so in terms of operation, we can just follow the trend and operate within the range.
Gold operating strategy:
SELL:1945-1947
SL:1952
TP1:1941
TP2:1938

XAUUSD: 30/8 Today’s Trading StrategyAt the beginning of the Asian market on Wednesday, gold held a nearly three-week high and is currently around 1936. The main U.S. employment data in July began to approach pre-epidemic levels, a sign of a cooling labor market. The dollar and U.S. bond yields fell sharply on Tuesday, with the 10-year U.S. bond yield hitting a near two-week low, helping gold soar more than $15 , conquered the key position near the 55-day moving average of 1931.5, and spot gold closed at 1937.17 on Wednesday. The gold 1915-1918 given by Jiesse yesterday emphasized the idea of gold bulls. I believe that the friends who followed have perfectly won the stop profit.
Yesterday's bulls rose and closed at a high level. The daily line included a big positive line, which broke through the previous highs at the highest point, but did not break through the previous lows. There was a bullish situation. After the shock, it broke through again, indicating the continuation of the bulls. From the perspective of the four-hour level, before this wave of rising gold was a wave of continuous falling waves, so the rising wave at this stage is an adjustment of the previous wave, or a new round of rising waves. Let’s start now Mainly do more at low positions. It is estimated that the watershed between long and short in the current trend will be at 1926, and you can continue to do long if the retracement does not break below.
Jiesse's conclusion: Gold's breakthrough again does not mean that it will continue to skyrocket. Today’s operation considers retracing and doing long mainly, and then shorting at high positions. Focus on the resistance of 1942-1947 at the top, support at 1918-1925 at the bottom, and focus on 1915 after an unexpected break. If the high point does not break through 1940 for many times, you can consider shorting.
Gold operation strategy:
SELL:1943-1947
TP1:1937
TP2:1933
1922-1926
TP1:1929
TP2:1932

XAUUSD: 31/8 Today’s Trading StrategyAt the beginning of the Asian market on Thursday, the U.S. dollar index fluctuated and fell slightly, currently around 103.2, continuing the overnight weakness. Gold prices temporarily stayed at four-week highs, currently around 1945. Gold is now in a volatile trend at the bottom, and the rebound is nearing the end. The big non-agricultural data will be released on Friday. With the news uncertain, gold will not easily break through the daily pressure. Today, we will see a band correction! This Friday is a critical node, everyone needs to take advantage of it.
Yesterday evening, after the ADP data was released, the U.S. dollar index fell sharply. The price of gold once rose to 1948, but this does not mean that gold will continue to break through and rise. The subsequent increase will not be large. It rebounded from 1984 to 1949, close to 65 US dollars, whether it is From the perspective of time and space, the rebound trend is about to end. On Thursday and Friday, we will focus on initial jobless claims data and non-agricultural data. At the top, we will focus on strong resistance near 1953-55. Short-term short orders can start to be placed. Overall, today Jiesse's short-term gold operation ideas suggest mainly shorting the highs, and then going long at the lows. The upper short-term focus will be on the 1950-1955 first-line resistance, and the lower short-term focus will be on the 1925-1933 first-line support.
Gold operating strategy:
BUY:1935-1938
SL:1930
TP1:1944
TP2:1950

XAUUSD: 1/9 Today’s Operation StrategyGold traded sideways at a high yesterday, fluctuating and retracing at the 1949.2 level, and stabilized and fluctuated at the 1938 level. The fluctuation was only 10 US dollars throughout the day, and the daily level fell slightly. The high price did not break the previous high, and the low price did not break the previous low. In continuous After rising, there is a negative closing, which may be a change in trend, but it cannot break the previous low. Judging from the trend, because non-agricultural non-agriculture is approaching, the overall fluctuations in the last trading day were limited.
The opening in early trading was at 1939.96, then rebounded to 1944 and then fell back. The range was compressed quite severely. Gold hit a high yesterday and fell back. The daily Xiaoyin K line closed. On the last day of the week, yesterday gold was under pressure at the middle track of the Bollinger Band. , in the volatile market, once it stops and cannot break through the key resistance, it will be a volatile ending rhythm at the end of the week. Pay attention to the closing situation of this week's line. The daily upward line is suspended. It is not a strong unilateral in itself. It will be blocked during the rebound and correction market and fall into shock. .
The 4-hour chart is currently confirming the second-wave upward trend, and the upward trend line has not fallen. Judging from the 4-hour structure alone, it is a correction in the upward trend. The longs and shorts have entered into differentiation, the weekly line is blocked, and it is still partially suppressed in 4 hours. It depends on whether to choose to break through downward or upward. The short-term begins to re-determine the direction. There are changes in the long and short positions, and the support of the trend line is around 1930-1927. The Asian market is expected to narrow and fluctuate, and the operating point will be placed on the European and American markets. Today's gold operation ideas Jiesse recommends selling high and then buying low.
Gold operating strategy:
BUY:1926-1929
SL:1920
TP1:1934
TP2:1940

Today's gold prediction interval 1907~1923Gold layout analysis: The gold 1921 empty order that was laid out last Friday. Precisely control the entry position, and perfectly won the weekly closing of last Friday. Congratulations to the fans and friends who have followed the strategy.
Gold opened at 1916 on Monday. Last week, the trend of gold went out of the trend of long first and then short. The first three days of last week gave the bulls plenty of momentum. In the next two days, it has been under pressure below the 1923 line, indicating that it is only a rebound trend and has not really opened up the bullish upward trend. Now the position of 1923 is a short-term peak, and this week is a non-agricultural week. Whether it can break the current trend is also within this week. In terms of the direction of the overall layout this week, it is temporarily arranged in the range of 1923-1885, and the short-term operation is still mainly based on selling high and buying low. Let me emphasize again that although the bullish rebound is over now, we still have to focus on the bulls under the support of the three bottoms below. Going short blindly will increase a lot of risks.
Back to the topic, according to the current market trend, there is a high probability that Monday and Tuesday will be dominated by range shocks. We only need to sell high and buy low to operate. Go long around 1907 and short around 1920

Trading strategies for today’s US non-farm payrolls dataGold layout analysis: The white market fluctuations on Friday are still sideways, and there is not much room for operation. We continue to wait and see. Focus on the non-farm payrolls announced in the afternoon. According to the results released in the past, the value of the non-farm payrolls announcement in the evening is expected to be greater than the forecast value, thus increasing the probability of negative news. Due to the excessive fluctuations in the early stage, after the evening data is released, the market should continue the trend from Wednesday to Thursday and continue to fluctuate and fall. Of course, this is just my analysis, and we still have to wait for the non-agricultural data to be released before we can confirm it. Therefore, we cannot be too aggressive in pursuing long orders in today's operation. Instead, make plans based on market trends.
Back to the topic: At present, the trend of gold has encountered obstacles and has fallen back. We can’t go long blindly, and there will be non-agricultural data released in the evening, so we still mainly sell high and buy low
Let’s look at 1936-1933 below first today. When you reach this range, look for a low point to enter the market and go long, SL1927 position. The target is above 1945.
If the European and American market rises to the 1950-1952 position, you can participate in short orders. SL1958 position, the target looks at the 1943 position below.

XAUUSD: 28/8 Trading Strategy TodayThis week focuses on non-agricultural data. After the hawkish stance of the Federal Reserve Chairman last week, focus on whether the employment data can demonstrate the resilience of the US economy and provide support for further interest rate hikes. In addition, focus on the speeches of several Fed officials and the announcement of the European Central Bank’s monetary policy in July meeting minutes. At the market-focused Jackson Hole meeting, Fed Chairman Jerome Powell said real interest rates were positive, well above most neutral expectations. He also pointed out that the Fed will carefully decide whether to raise interest rates again, will maintain a restrictive monetary policy stance until inflation continues to slow, and if appropriate, the Fed is ready to raise interest rates further.
Gold rebounded in the mid-yang line last week and closed higher, and the weekly line turned positive for the first time after four consecutive negative rebounds. The weekly line maintained a high level of volatility and saw-saw, recovering the previous week’s decline and holding the 1900 mark. Last Friday, the daily line rebounded with a dip and did not change much.
The daily chart is in a rebound correction. At the end of last week, it stepped back twice and still held above the 1900 mark. It is difficult to say that the daily line will continue unilaterally for the time being. In the short term, there may be see-saw shocks, and the duration will be longer. The strength of the US dollar is not strong, and although it is bullish, it is also a shock-like presentation.
After the rapid decline in the 4-hour chart, there was a recovery rebound in the late trading. The Dayin K-line did not close down, and the short-term shocks remained, and the previous low of 1884 was not lost. For the time being, there is no room for continuation of the downward trend. Some short-term shocks may occur. The duration will be longer, and there will be no strong unilateral market for the time being. The Bollinger Road began to tighten slightly, and once again oscillated on the middle track. The K-line pattern is in the process of rebounding, but the spatial continuity is still a problem. It may be accompanied by repeated market fluctuations, and the see-saw movement of one up and one down. In the see-saw and volatile market, the grasp of the entry point is even more tested. In terms of operation, combined with the flexible response to the morphological changes of the hourly chart, and switching back and forth between long and short, the key lies in the entry of points, but the main thing is to focus on long positions.
Gold operation strategy:
SELL:1919-1923
TP1:1916
TP2:1911
BUY:1907-1911
TP1:1914
TP2:1918

XAUUSD: 29/8 Today's Trading StrategyInternational gold prices continued to fluctuate and rise on Tuesday. The rise in gold prices on Monday was mainly helped by the fall in the dollar and U.S. Treasury yields. The market continued to digest Powell's speech last week. The focus will be on Thursday's U.S. personal consumption expenditures (PCE) price index report and Friday's U.S. non-farm payrolls data for August, where investors will look for further clues about the strength of the economy.
The gold market opened lower in early trading yesterday at US$1913.2, and then the market first pulled up to US$1917.8, then the market fell back, and the daily line was as low as US$1912.5, and then the market rose strongly in the US session, and the daily line reached a maximum of US$1926.1. The market finished at a high level, and the daily line finally closed at $1919.9, and then the market closed with a Zhongyang line with a long upper shadow line. After such a form, today's market has a technically bullish demand. The 4-hour chart held above the previous low point and further rose to explore higher. The middle rail of Bollinger Road formed a short-term support. slower.
In terms of operation, rely on 1903 as a defensive point and first look at the shock and rebound. Gold bottomed out as a whole and rebounded. In today's operation, Jiesse considers the retracement layout to be low and long, supplemented by high altitude. Focus on 1926-1932 at the top and 1918-1912 support at the bottom. If you break through the 1926 support, you can refer to around 30 for short orders.
Gold operation strategy:
SELL:1926-1929
TP1:1923
TP2:1919
BUY:1915-1918
TP1:1921
TP2:1926

XAUUSD: 25/8 Gold Trading Strategy TodayYesterday the U.S. Department of Labor said initial claims for state unemployment benefits fell by 10,000 to a seasonally adjusted 230,000 for the week ended Aug. 19. Economists polled by Reuters had expected 240,000 new claims in the latest week. The jobless benefits report may have also provided some support for the dollar on the day, but overall the gold market's reaction to the data was subdued. Yesterday the gold market fluctuated in a range. The market opened at 1916.2 in early trading. After that, the market first pulled up to 1922.9, and then the market quickly fell back. The Fibonacci pressure of 38.2 fell back in late trading, and the daily line finally closed at 1916.7. Afterwards, the market closed in the form of a long-line cross star with an upper shadow line slightly longer than the lower shadow line, and gold ushered in an adjustment.
The trend of gold yesterday was relatively simple. During the day as a whole, it went down slowly on one side. After encountering support, it began to rebound and continued the trend of long positions. After hitting a high point, it went down again. Yinxian, the previous weak downward pattern has been completely broken, and Wednesday's big Yangxian just laid the foundation for this wave of upward movement. It has changed the previous weak form, and has now stabilized at 1900 points. It is expected that there will be further upward shocks . In the 4-hour chart, the market went up and down, and then returned to its original position after rushing up. It seemed strong, but it also seemed to be an illusion. To a certain extent, it will limit the upside of gold, and in terms of trend, it is currently in the stage of rebound correction. At the end of the week, it is very easy to close the whole week lower, so short-term trading is cautiously waiting.
To sum up, a conclusion can be drawn: after the rise of gold, an adjustment pattern has been formed. At the top, focus on the 1922-26 resistance, and at the bottom, focus on the 1911-1907 support, to prevent the gold from turning short after an accidental break.
Gold Operation Strategy:
Buy: 1909-1911
TP1:1915
TP2:1920
SELL:1922-1924
TP1:1917
TP2:1913

XAUUSD: 23/8 Trading Strategy TodayDuring the Asian session on Wednesday, spot gold rebounded slightly, currently around 1903, although Fed officials were open to the possibility of "re-acceleration of the economy" yesterday, which helped the dollar index to refresh its high in nearly two months, making gold bulls scruples. But gains in U.S. Treasury yields were capped, and gold remained supported by bargain hunting.
Judging from the trend of gold yesterday, the overall tendency is to fluctuate back and forth, but the direction is a bit of a short-term bottoming. Yesterday morning, the market started to rebound after accelerating to bottom out. After breaking the previous high, it also tested the lower low support again, but it was still difficult to continue to break below, and then rebounded again. Judging from yesterday's continuous testing of low support, it is obvious that the current short-term bottoming is obvious, and yesterday's daily line also received a cross K negative column again, but there was no new low, so from the perspective of the moving average pattern , the daily MA10 pressure is temporarily at the 1901-1904 mark. In the short-term market outlook, as long as it breaks through again and stands firm, then the overall operation is expected to start to focus on bargain hunting.
Gold still failed to break through the downward trend line in 4 hours. Although the rebound seemed ferocious, it was actually just an illusion. It quickly rose and fell back. There was a lot of resistance above, and there was not enough bull power to support gold's reversal. The downward movement of the 4-hour chart has paused slightly. Due to the previous continuous weakness, it did not weaken and increase the volume at the bottom. Instead, the downward movement slowed down and then consolidated horizontally. There was still a slight rebound yesterday. At least the current K-line pattern is not weak, even if it is falling. It is very easy to have a reverse K line for correction. Bollinger Road began to close, and now it has crossed the middle rail and is shrinking. Temporarily in a sideways shock.
On the whole, in terms of the short-term operation of gold today, Jiesse suggests that rebounding should be mainly long, and high positions should be supplemented by short selling. We continue to increase the price of opening a short position a little bit. At the top, focus on the 1904-1908 position. If we quickly break through the 1906 position, we will not rush into the market to short, wait for the rebound to correct and look for opportunities to short, and continue to focus on the 1890 position below.
Gold operation strategy:
BUY: 1892-1894
SL:1888
TP1:1899
TP2:1903
SELL:1904-1906
SL:1910
TP1:1900
TP2:1896

Today's major data announcement, how to tradeAnalysis of gold layout: From the perspective of the structure of gold, gold rose slowly to the 1923 line yesterday and then began to fall after many pre-breakthroughs failed. We can't blindly operate this kind of trend too much. The final direction of gold is also out tonight. Although the failure to break through the high point for many times has made the bulls lose their confidence, and the momentum of the bulls has gradually weakened. It is expected that gold will go out of the weak weak downward trend for a short time. Waiting for the correction to break through the 1923 resistance will allow us to continue looking above 1930. Today's operation is based on the old rules, just sell high and buy low.
Back to the topic, gold was affected by the bad news last night, and its upward momentum has weakened significantly. It failed to hold above 1920, and this week's rebound is over.
Today, let’s watch gold rise to 1921-1923, reach this range to find a high level and enter the market to short, SL1928, TP1910
Fall to around 1911 and go long, SL1904, TP1920

Will the gold bulls exert their strength?Gold layout analysis: The gold welfare strategy deployed on Tuesday wins both long and short positions. At present, from the perspective of gold trend, it is at the key point of long-short conversion. Since it fell to the 1884 line and established the bottom position, gold has been fluctuating between long and short. Today the highest hit the 1905 line. Judging from the overall trend, the bulls may have to exert their strength. Judging from the current trend, there is still a lot of room for growth above. Looking at the intraday trend, from the opening to the current position, it has been oscillating and rising above 1900, which also shows that today's market trend is very critical. If you can effectively stand above the 1905 line, you can directly look at the upper 1912 position. However, it is still necessary to xi, Australia and New Zealand to soar high and fall back. Today's operation is still based on high altitude.
Back to the topic, the gap below 1870 in gold has not been covered, and the Federal Reserve spoke this Thursday night. If it continues to raise interest rates, it is bound to go down again, so the overall trend is still dominated by shorting.
Today, let’s first look at the 1905-1907 line above, and reach this range to find a high point and enter the market to sell short
SELL: 1905~1907, SL: 1912, TP: 1897
Europe and the United States fell below the 1895-1893 line, you can participate in long
BUY: 1895~1893, SL: 1888, TP: 1905
XAUUSD: 18/8 Gold Trading Strategy TodayIn early Asian trading on Friday, spot gold rebounded slightly after the recent slump, and the price of gold is now at $1,893. Gold fell towards $1,885 on Thursday, its lowest level since March 13. A stronger DXY and higher U.S. Treasury yields were responsible for gold's decline. Spot gold closed at US$1,889.11 on Thursday, down US$2.80, or 0.15%, with an intraday high of US$1,903.44 and a minimum of US$1,884.93. It faces renewed selling pressure against a backdrop of a stronger dollar and rising U.S. Treasury yields. Gold prices closed below the 200-day moving average on Thursday. Adding to hawkish bets on the Fed on Wednesday, minutes from the Federal Open Market Committee (FOMC) meeting showed members were open to continuing to raise interest rates due to upside risks related to inflation and noted that the labor market remains extremely tight . Expectations that U.S. interest rates could be higher for longer have pushed the yield on the benchmark 10-year U.S. Treasury bond to its highest level since October, making non-yielding bullion less attractive to investors.
From the perspective of the daily line structure, gold has closed in the negative for 4 consecutive trading days this week. In addition to the continuous decline last week, it has been falling continuously for almost two consecutive weeks. Such an extreme trend is not common, and it is enough Indicates the current negative and pessimistic state of bulls. Judging from the hourly chart, the rhythm of gold and DXY yesterday has a certain degree of coordination, but there is also a disconnection, that is, when DXY is under pressure and recovers, gold rebounds slightly, and when DXY rebounds and measures pressure, gold falls sharply. The rhythm clearly shows that the gold bulls are still in a state of serious lack of confidence. The lack of confidence is caused by two factors. One is that after gold itself fell below the key support, the confidence of market bulls was damaged; And these two factors complement each other, so if gold wants to turn to an upward trend in the future, it must be based on the DXY recovery, and it must be technically back above 1900, otherwise it will still be very difficult Forming an effective upward trend, if there is a recovery but cannot stand above the key position, then it can only be regarded as a short-term oversold rebound.
Therefore, today's gold operation idea Jiesse suggests that as yesterday, the rebound is mainly short at high levels, supplemented by callback at low levels, and the upper part focuses on the first-line resistance of 1900-1903, and the lower part focuses on the first-line support of 1890-1885. If it breaks the 1880 line, continue to look at the 1867 position below, and don't go long yet.
Gold operation strategy:
SELL:1897-1900
TP1:1893
TP2:1890
BUY:1881-1884
TP1:1886
TP2:1890

Today's gold forecast is 1889~1903, sell high and buy lowAnalysis of the gold layout: won on Monday with a complete victory. The current trend of gold has rebounded strongly last night since it repeatedly attacked the bottom 1885-1884, but then began to fall back, and finally fell to the 1886 line to stabilize and fluctuate. From the perspective of the trend, it is a weak slow-rising pattern, and it has broken through to the vicinity of the 1901 line above. From here we can see that this is completely different from the previous trend. After breaking through the 1884 line yesterday, it started to rebound. Now that the bulls are about to move, our operating thinking must be changed immediately, and we cannot chase the short in the main. Instead, go back to our old thinking, just sell high and buy low. While stable, it can also avoid many risks. Today, focus on the breakthrough of 1905. As long as this position is not broken, it is still a short-term idea.
Back to the topic, since gold fell below the 1884 line yesterday, it has obviously stopped falling after rebounding. Today, let’s look at the 1901-1903 line above, and reach this range to find a high point to enter the market and open short
Near SELL1903, SL:1908, TP:1890
Europe and the United States fell below the 1892-1889 line to do more gold
BUY1889~1892, SL:1884, TP:1900

Gold continues to fall, can it bottom out tonight?Gold layout analysis: From the perspective of the gold trend, the overall situation is bearish. Recently, the highs have been moving down, and the lows have been broken. The lowest point fell to the 1902 line and then began to pull back. Strength is still good. The empty orders laid out yesterday did not give a chance to enter the market. I really did not expect the gold bulls to be so weak. Gold is still bearish on the main body today. However, when the monthly sales rate is announced in the evening, you can’t blindly chase short positions. You still have to make corresponding adjustments according to the specific trend of the European market in the afternoon. Judging from the current disk, the trend of short positions has not changed. What we have to worry about now is whether gold will bottom out at night and rebound. We followed the trend and waited for the rebound to reach a high point before going short.
Back to the topic, it is already a certainty to be short on gold. Under such a trend, it is the most stable to go short when gold rebounds, and the integer mark below 1900 is close at hand.
BUY1900-1903, SL1897, TP1910
SELL1911-1913, SL1918, TP1900

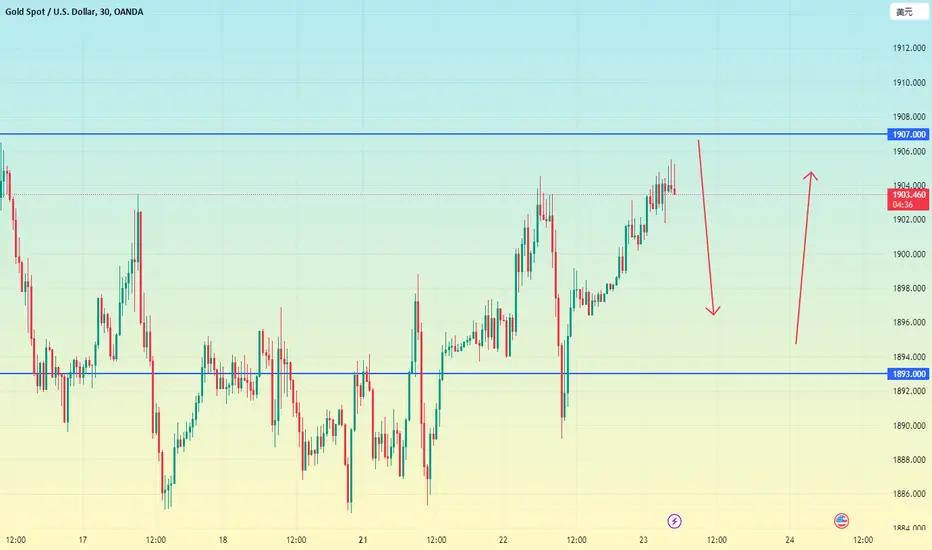
SHORT ON GOLD AFTER LOSING THE 1900 SUPPORT "So, GOLD has lost one of its important supports (1896 ~ 1902). It is currently at the lowest price in the last 60 days. The price has formed a clear CHOCH on the 1H and 4H time frames, and the trend has remained bearish after losing the support.
The first scenario involves being rejected after retesting the previously lost structure around 1896 ~ 1902 and then making a direct move towards 1980. Following that, we might observe a consolidation phase around that area.
The second scenario entails breaking the 1980 support zone, retesting it, and potentially going deeper to 1860.
Today's news appears to be unfavorable for GOLD, leading to our next resistance zones at 1880 and 1860.
My recommendation is to go short until we witness a solid breakout at 1907 ~ 1912.
Good luck, everybody."
OANDA:XAUUSD FOREXCOM:XAUUSD CAPITALCOM:GOLD

Gold: 1938 empty orders enter the market, Europe continues to be
Gold has reminded 1938 to continue shorting. The judgment is so accurate. The highest rebound in the early trading was to touch the 1938 line, and then began to fall. Resolutely continue to enter the market directly in 1938. The short order is profitable. The European market maintains the bearish thinking and waits. Profit!
Gold is short at 1938, stop loss at 1943, and stop profit at 1920.
Share this point of view with my friends, I hope you can make more money and realize your dreams. Friends in need can keep up

Gold future 55 min poss. price action projection into the futurethis is the result of my analysis about the 55 min chart possible price action develepement. Just an idea, nothing seriouse. Worth to monitor ;) Pls leave a like when it worked out
Das ist das Ergebnis meiner Analyse über den 55 min Chart mögliche Preisentwicklung. Nur eine idee, nichts gravierendes. Wert, im Auge zu behalten ;) Bitte liken wenn es gefällt

Go long gold now!After last week’s sharp rise, gold temporarily stagnated at the 1963 high. On Friday, the small negative line retraces and corrects. The week’s closing work has not further risen to break new highs. The overall rise has come out of the high volatility after the surge, and there is room for retracement It is not enough to change the bullish structure for the time being, but the continuous exploration of highs without breaking the highs also exacerbates the risk of short-term corrections
Last Friday emphasized that gold fell back in 1950, and the layout was bullish. It was close to the 1963 high point. The position of 1963 has also been reminded many times. Once again, we tried to see 1963 fall under pressure, and we firmly grasped this opportunity
Technically, after the sharp rise at the beginning of last week, gold fell back under pressure at the end of the week in 1963. Up to now, it has continued to run sideways at a high level. During the week, gold temporarily remained below 1963 to see high volatility. It is difficult to get out if the high point of 1963 is not broken. There is room for a big rise. On the contrary, it is more likely to increase the pullback after a high level of stagflation. Last Friday’s drop at the low point of 1950 is the first support, followed by the 1940 mark. Structurally, it may follow the confirmation of the back step and then rise. The key point is The stabilizing support point of stepping back can be decided before the market is combined with the K-line shape of the hourly chart. The support point of the retracement can be deep or shallow, and the weaker retracement should pay attention to the 1940 mark before stabilizing, and arrange the entry point of multiple orders in combination with the pattern retracement in the operation.
In terms of intraday operations, the support point for last Friday's fall was at 1950. For the time being, this point has not been broken, and it also has a certain supporting effect. In case of being short-lived, it is recommended that gold be around 1950 once more, and the target is above 1960; There are many market adjustments in the 1940 area, the loss is 1933, and the target is 15-20 US dollars; the empty order strategy revolves around the participation of light positions below 1963, and it is enough to strictly break the new high and stop the loss to leave the market.
If you don't know how to trade accurately, then contact me and I will give you accurate advice!
