Gold May Continue Rising as the USD Weakens📊 Market Overview:
Gold surged strongly and remains above the 5000 USD/oz level as the US dollar weakened and expectations of Fed rate cuts increased, boosting safe-haven demand. Market sentiment remains risk-off amid ongoing macroeconomic uncertainties.
________________________________________
📉 Technical Analysis:
Key Resistance:
• 5035 – 5040
• 5065 – 5070
Nearest Support:
• 5000 – 4995
• 4970 – 4965
EMA:
• Price is trading above EMA 09 → short-term trend remains bullish.
Candlestick / Volume / Momentum:
• H1 candles show bullish bodies with short lower wicks → buyers are in control.
• Volume increased during the breakout above 5000 → confirming a valid breakout.
• RSI and momentum remain bullish but not overbought → further upside potential remains.
________________________________________
📌 Outlook:
Gold may continue rising in the short term if price holds above 5000 and no hawkish signals from the Fed or strong US economic data emerge.
________________________________________
💡 Trading Strategy:
🔻 SELL XAU/USD: 5039 – 5042
🎯 TP: 40 / 80 / 200 pips
❌ SL: 5045
🔺 BUY XAU/USD: 4999 – 4996
🎯 TP: 40 / 80 / 200 pips
❌ SL: 4993
Goldtradeidea

Gold May Continue Short-Term Correction Amid High Volatility📊 Market Overview:
Earlier today, spot gold (XAU/USD) experienced a sharp sell-off toward the 4,655 USD/oz area before rebounding. This move highlights elevated market volatility, driven by a firm US dollar and cautious investor sentiment following the previous strong rally. Dip-buying emerged near lower levels, but short-term selling pressure remains evident.
📉 Technical Analysis:
Key Resistances:
• 4,900 – 4,950 USD
• 5,020 – 5,080 USD
Immediate Supports:
• 4,700 – 4,750 USD
• 4,600 – 4,650 USD
EMA:
• Price is hovering around the EMA 09, indicating an unclear short-term trend and a consolidating market.
Candlestick / Volume / Momentum:
• Large-range candles with long wicks show strong buying and selling pressure. Volume remains elevated, confirming active market participation, but bullish momentum is not yet strong enough to confirm a sustainable uptrend.
📌 Outlook:
Gold may continue to correct in the short term if price fails to hold above the 4,700 USD/oz support, while rallies may continue to face profit-taking pressure.
💡 Suggested Trading Strategy:
🔻 SELL XAU/USD: 4,947 – 4,950
🎯 TP: 40 / 80 / 200 / 300 pips
❌ SL: 4,957
🔺 BUY XAU/USD: 4,703 – 4,700
🎯 TP: 40 / 80 / 200 / 300 pips
❌ SL: 4,693

Gold Short Analysis – Bullish Trend & TradeGold remains bullish but corrective on the 1H chart, trading within a rising channel. Price has reacted from the 4960-4980 demand zone and is attempting to hold above the trendline support. As long as this zone holds the overall structure favors continuation higher though a brief pullback or consolidation is still possible before the next leg up.
Trade Plan:
Buy Zone: 4980 – 4960
Buy Trigger: Bullish rejection from the buy zone or a strong 1H/4H close above 5100
Targets: 5,100 → 5,165 → 5,210
Invalidation: Sustained break and close below 4,940
Fundamentally gold is supported by geopolitical uncertainty expectations of a more accommodative Fed stance and ongoing pressure on the US dollar and real yields. Any risk-off sentiment or weaker US data can further fuel upside while only a sharp USD rebound or hawkish surprises may slow the bullish momentum.
Note
Please risk management in trading is a Key so use your money accordingly. If you like the idea then please like and boost. Thank you and Good Luck!

Gold Continues Its Uptrend as Safe-Haven Flows Rebalance📊 Market Overview:
XAU/USD has just posted a strong rebound from the short-term bottom, indicating that defensive buying demand remains present after a sharp correction. Current momentum appears to be a technical rebound, not a broad breakout yet.
________________________________________
📉 Technical Analysis:
• Key Resistance:
– 4478–4485
– 4550
• Nearest Support:
– 4425–4430 (intraday support, price reaction zone)
– 4405–4410 (strong support, prior rebound low)
• EMA 09: Price is trading above the H1 EMA 09 → short-term uptrend remains valid, but price is extended from EMA, increasing the risk of a pullback.
• Candlesticks / Volume / Momentum: A strong bullish candle with a long body after a rejection shows buyers returning; however, volume is not expanding → likely a technical rebound rather than a new impulsive rally.
________________________________________
📌 Outlook:
Gold is likely to move sideways with a short-term rebound, favoring BUY positions at support, while SELL trades should only be considered at clear resistance levels, avoiding chasing shorts mid-range.
________________________________________
💡 Suggested Trading Strategy:
🔻 SELL XAU/USD at: 4485–4488
🎯 TP: 40 / 80 / 200 pips
❌ SL: 4492.5
🔺 BUY XAU/USD at: 4429–4426
🎯 TP: 40 / 80 / 200 pips
❌ SL: 4422.5

GOLD (XAUUSD): Short Term Bearish! Watch The -FVG!In this Weekly Market Forecast, we will analyze Gold (XAUUSD) for the week of Jan.5-9th.
Gold took a bearish turn last week, closing below the previous weekly candle. This is ordinarily a bearish indication. But with the US actions against Venezuela, we may see Gold spike up with
the tensions.
If the market moves higher, there is a -FVG just above it to offer resistance. If the market doesn't respect the -FVG, we know to look for long setups upon the inversion of that FVG.
If the market respects the -FVG, look for sells on the LTFs.
Simple.
Enjoy!
May profits be upon you.
Leave any questions or comments in the comment section.
I appreciate any feedback from my viewers!
Like and/or subscribe if you want more accurate analysis.
Thank you so much!
Disclaimer:
I do not provide personal investment advice and I am not a qualified licensed investment advisor.
All information found here, including any ideas, opinions, views, predictions, forecasts, commentaries, suggestions, expressed or implied herein, are for informational, entertainment or educational purposes only and should not be construed as personal investment advice. While the information provided is believed to be accurate, it may include errors or inaccuracies.
I will not and cannot be held liable for any actions you take as a result of anything you read here.
Conduct your own due diligence, or consult a licensed financial advisor or broker before making any and all investment decisions. Any investments, trades, speculations, or decisions made on the basis of any information found on this channel, expressed or implied herein, are committed at your own risk, financial or otherwise.

Gold Bullish Continuation – Trade Plan & Key LevelsGold is trading within a well-defined ascending channel on the 4H timeframe maintaining a strong bullish structure with higher highs and higher lows. Price has successfully held above the key BOS area around 4374–4380 which is acting as a major demand and continuation zone. The market is currently consolidating below the 4400–4405 resistance marked as a ATH indicating potential liquidity buildup. As long as price holds above 4360–4345 the bullish bias remains intact supported by trendline confluence. A clean breakout and acceptance above 4405–4410 can open the path toward the 4445–4490.
Buy on pullback: 4,370 – 4,345
- SL: Below 4,325
- TP1: 4,405
- TP2: 4,445
- TP3: 4,485 – 4,490
Buy on breakout: Clear 4H close above 4,410
- SL: 4,380
- TP: 4,450 → 4,490
Sell scenario (only if rejection): Strong rejection from 4,405–4,420
- SL: Above 4,445
- TP: 4,360 → 4,325
Overall, the trend remains bullish and sells should only be considered on strong rejection signals. Best strategy is to buy dips or confirmed breakouts keeping risk tight as price approaches the upper channel and year-end volatility remains high.
Note
Please risk management in trading is a Key so use your money accordingly. If you like the idea then please like and boost. Thank you and Good Luck!

Gold Holds Bullish Momentum After Breaking Key Resistance📊 Market Overview
Gold reacted exactly as expected: it touched the 4,318 zone, pulled back to 4,307, then bounced sharply and broke solidly above 4,320+. This price action shows that buyers remain in control, and bullish momentum continues to dominate the short-term trend. The prior sideways consolidation, followed by a strong breakout, has created room for an extended move upward.
📉 Technical Analysis
🔥 Key Resistance Levels
1. ~4,325 – 4,332 — current expansion zone
2. ~4,350 — major psychological and technical barrier
🟢 Nearest Support Levels
1. ~4,312 – 4,315 — breakout retest support
2. ~4,300 — key psychological and technical support
📊 EMA & Trend
• Price remains above the EMA09, confirming that the short-term uptrend is intact following the breakout. EMA continues to slope upward, indicating strong bullish momentum.
📉 Candlestick / Volume / Momentum
• A shallow retest followed by a strong rebound suggests increasing bullish momentum.
• The widening H1 candlestick range after the breakout signals growing buying pressure and solid market participation from bulls.
________________________________________
📌 Market View
Gold is clearly in a short-term uptrend after breaking strongly above the 4,300–4,318 resistance zone and holding above 4,320. As long as price stays above 4,315, the probability of reaching 4,325 – 4,332 remains high. However, if price falls below 4,312, a minor correction toward 4,300 may occur.
________________________________________
💡 Trade Ideas
🔼 Trend-Following BUY
Entry: 4,315 – 4,318
🎯 TP: 40 / 80 / 200 pips
❌ SL: 4,310
🔻 Scalping SELL
Entry: 4,330 – 4,334
🎯 TP: 40 / 80 / 200 pips
❌ SL: 4,338

Gold Continues to Range; Awaiting Breakout📊 Market Overview:
Gold continues to trade within a tight range 4180 – 4215, reflecting strong market indecision as traders await upcoming U.S. economic data. The USD remains relatively stable, keeping gold movement suppressed.
________________________________________
📉 Technical Analysis:
Key Resistance Levels:
• 4220
• 4230 – 4240
Nearest Support Levels:
• 4185 – 4180
• 4160 – 4150
EMA & Trend:
• Price is ranging around EMA 09, indicating lack of directional momentum.
• A confirmed H1/H4 close above 4215 signals bullish continuation.
• A breakdown below 4180 opens room toward 4160 – 4150.
Candlestick / Momentum Notes:
• Weak momentum, low volume → classic range-bound behavior.
• Rejection candles at 4220 show sellers defending the highs.
• Wick rejections near 4180 indicate buyers awaiting dips.
________________________________________
📌 Outlook:
Gold is likely to remain range-bound between 4180–4215 until a breakout occurs.
• Above 4215 → bullish bias toward 4230–4240
• Below 4180 → bearish bias toward 4160–4150
💡 Suggested Trading Plan:
🔻 SELL XAU/USD: 4227 – 4230
🎯 TP: 40 / 80 / 200 pips
❌ SL: 4234
🔺 BUY XAU/USD: 4160 – 4157
🎯 TP: 40 / 80 / 200 pips
❌ SL: 4154

Gold Eyes Support as Fed Cut Bets Fuel Volatility📊 Market Developments
• Gold is trading around ~4,224 USD/ounce, with strong volatility as U.S. bond yields rise slightly → creating downward pressure on gold.
• Expectations that the Fed may cut interest rates soon help gold maintain underlying buying interest.
• The market is awaiting new U.S. economic data to determine a clearer direction.
📉 Technical Analysis
Key Resistance:
1. 4,240 – 4,250 USD (near resistance – recent reaction high).
2. 4,268 – 4,275 USD (extended resistance – breaking above may open the path toward 4,300).
Key Support:
1. 4,180 – 4,200 USD (near support – strong buy zone for bulls).
2. 4,155 – 4,165 USD (mid-term support – aligns with major EMAs; losing this zone may trigger a drop toward 4,130).
EMA:
• Price is hovering around EMA09 on H1/H4 → short-term trend remains indecisive, no clear bullish or bearish confirmation yet.
Candles / Volume / Momentum:
• Volume leans bearish, momentum slightly declining.
• Waiting for confirmation candles: a bullish reversal at 4,180–4,200 or a strong breakdown below 4,165.
📌 Outlook
Gold may retest support with mild downside, especially if U.S. yields continue rising.
However, weak economic data and stronger expectations of Fed rate cuts could trigger a rebound from support.
➡️ Current trend: Neutral – slightly bearish, waiting for reaction at support.
💡 Suggested Trading Strategy
🔻 SELL XAU/USD: 4,242 – 4,245
🎯 TP: 40 / 80 / 200 pips
❌ SL: ~4,248
🔺 BUY XAU/USD: 4,158 – 4,155
🎯 TP: 40 / 80 / 200 pips
❌ SL: ~4,152

Gold Continues Decline After Breaking Support at 4224📊 Market Overview:
Gold continues to face pressure as the USD shows slight recovery and safe-haven demand withdraws. After reaching 4256 earlier this morning, gold dropped sharply and is now trading around 4218, indicating that selling pressure dominates in the short term.
________________________________________
📉 Technical Analysis:
• Key Resistance: 4224 – 4232 | 4250 – 4256 (mid-term)
• Nearest Support: 4208 (mid-term) | 4198 (deep support)
• EMA (09): Price is below EMA09, confirming a prevailing bearish trend.
• Candles / Momentum: Consecutive long red candles appear, with strong downward momentum; no rejection candle observed around 4215 → downside risk remains high.
________________________________________
📌 Outlook:
Gold may continue to decline in the short term if the price breaks 4215 with a strong candle. Conversely, if a clear rejection appears at 4215, gold could see a technical rebound toward 4230 – 4235.
________________________________________
💡 Trade Ideas:
🔻 SELL XAU/USD at: 4235 – 4238
🎯 TP: 40 / 80 / 200 pips
❌ SL: 4241
🔺 BUY XAU/USD at: 4198 – 4195
🎯 TP: 40 / 80 / 200 pips
❌ SL: 4192

Gold Short-Term Trading GuideThe price action today has been generally above 4130. After breaking through to a high of 4173 in the European session, it entered a short-term consolidation phase, without a rapid pullback compared to previous periods. The US session is expected to see a pullback for consolidation. The strategy remains to buy on dips above 4110. Avoid chasing the price higher! Look for opportunities to buy on pullbacks.
Short-term Strategy
Buy gold above 4110, stop loss at 4100, target 4180-4200
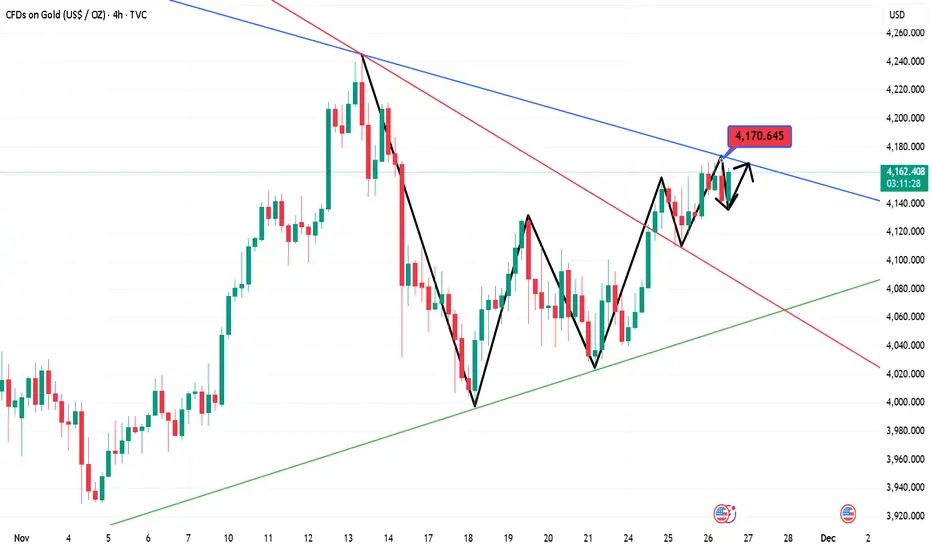
On November 26th, consider buying gold again after it retraces tOn the 4-hour chart for gold, the moving averages continue to trend upwards, maintaining a bullish alignment. Reviewing the intraday gold price movement, the overall trend remains upward, with a short-term pullback from the 415-4160 area. It's important to note that gold has seen minimal pullbacks throughout its upward breakout. The pullback in the European session only tested the 4110 level before continuing its upward climb. The short-term upward trend is expected to continue, and during the US session, buying on dips above 4100 is recommended.

Gold US Session Short-Term Hourly Chart Analysis Guide (NovemberGold hourly chart: Overnight, it rose steadily, and in the Asian session today, it initially continued its upward trend, reaching a high of 4156. However, due to the recent period of consolidation, the continuity of gains has been relatively weak. The initial rise suggests a potential pullback in the afternoon or European session, with a likely scenario of a correction based on the 4150-4160 resistance zone. This prediction ultimately materialized, with the price falling to a low of 4109, close to the 38.3% Fibonacci retracement level of yesterday's gains at 4111. The European session saw a further decline, breaking below the Asian session low. Any subsequent rebound should not be viewed as a bullish trap. Furthermore, based on today's high and low points, 4138 represents the 61.8% Fibonacci retracement level, currently acting as resistance. The best option for the US session is to wait. The next move will likely be a second downward pressure, either stabilizing at 4109 to form a double bottom, or breaking through it to confirm the 4104 annual moving average, or stabilizing at 4097 (50% retracement support) for a bullish move. These two levels also correspond to the short-term 5-day and 10-day support levels on the daily chart. Resistance is at 4138-4140. A break above this level would mean holding above the 10-day moving average, making further declines less likely and potentially pushing higher to test the 4150-4160 high. The key level is 4097. Trading above this level suggests a slightly bullish bias, while trading below it would indicate a weaker bias and a higher likelihood of wide-ranging price swings.
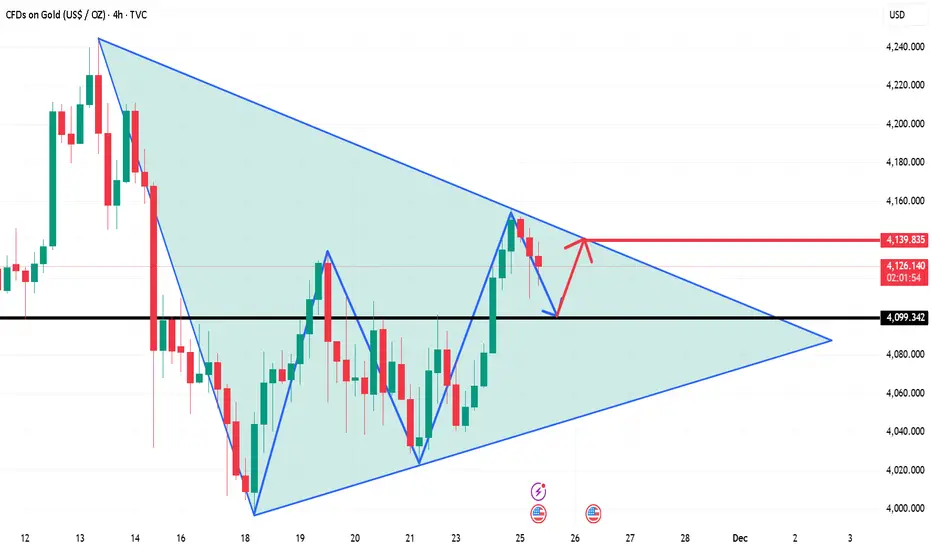
Gold Weekly Closes on November 21; Rebound Still BearishGold prices rebounded quickly to around 4088 after opening before continuing to fall. Key support lies around the previous low of 4020, which is the last line of defense for the bulls. A breach of this level would open up further downside potential, with the next target likely around 4000. However, this is only the first small target; a further break below this level could lead to a retest of the previous low of 3900.
From the 4-hour chart, the key resistance level to watch is 4076-85, while the key support level is 4020-25. Technically, a pullback is more likely. We will patiently wait for key entry points.
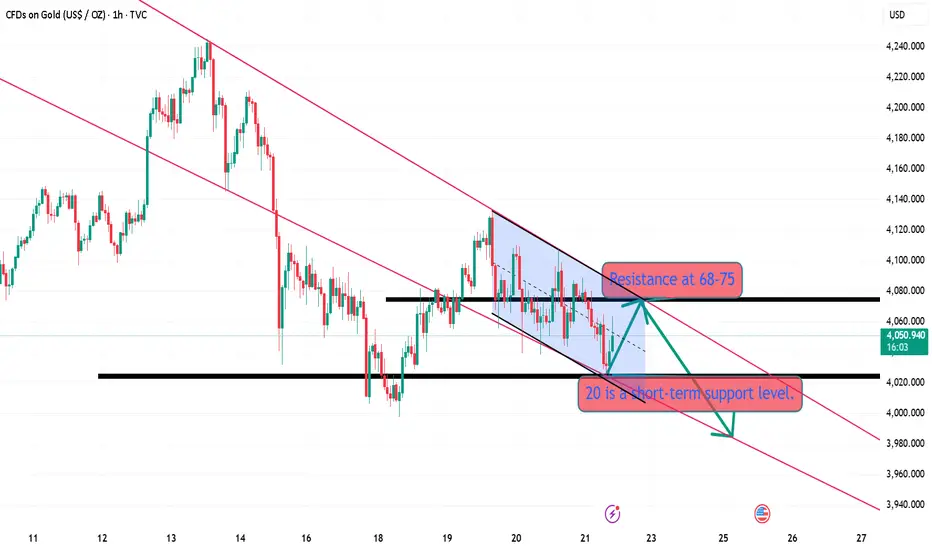
Gold Short-Term Technical Analysis (November 21st)With the release of the hawkish minutes from the Federal Reserve, the US dollar index climbed back above 100, suppressing gold prices. Yesterday, gold rebounded after testing a low near 4055 in the US session, then rallied slightly to around 4110 in the early morning before weakening again. In the Asian session, it broke lower, briefly touching around 4040. During the European session, it fell again, touching 4038 before stabilizing and rebounding. It has repeatedly tested the support around 4040 without breaking it, and is currently fluctuating.
11/22 Gold Short-Term Trading Strategy
Sell gold near 4085, with a stop-loss at 4095, targeting below 4070/60. Buy gold near 4044/5f, with a stop-loss at 4034, targeting 4070/80.

Gold prices fluctuated on November 20th, awaiting the non-farm pOn the hourly chart, gold continues to oscillate between 4000 and 4100. The current short-term trend is slightly weak, but not particularly strong. Before today's non-farm payroll data release, a strategy of buying low and selling high is recommended. Consider a small long position at 4040, targeting the 4080-4100 area. Short positions can be considered at resistance levels. The European session is expected to be relatively quiet; therefore, a cautious, small-position trading strategy is advised. Avoid chasing the market down; the potential downside is limited.
Gold prices fluctuated on November 20th, awaiting the non-farm pThe 1-hour moving average for gold has started to turn upwards, and the overall trend remains one of upward fluctuation. However, the fluctuation is currently biased towards the upper end. Gold has tested the support area of 4050 multiple times in the past two days, and has basically managed to stabilize and continue rising. This indicates that the bulls still have significant support in the 4050-4000 area. If the support area of 4040 is not broken today, then gold can continue to be bought on dips. The road to the north is long, and patience is still required.

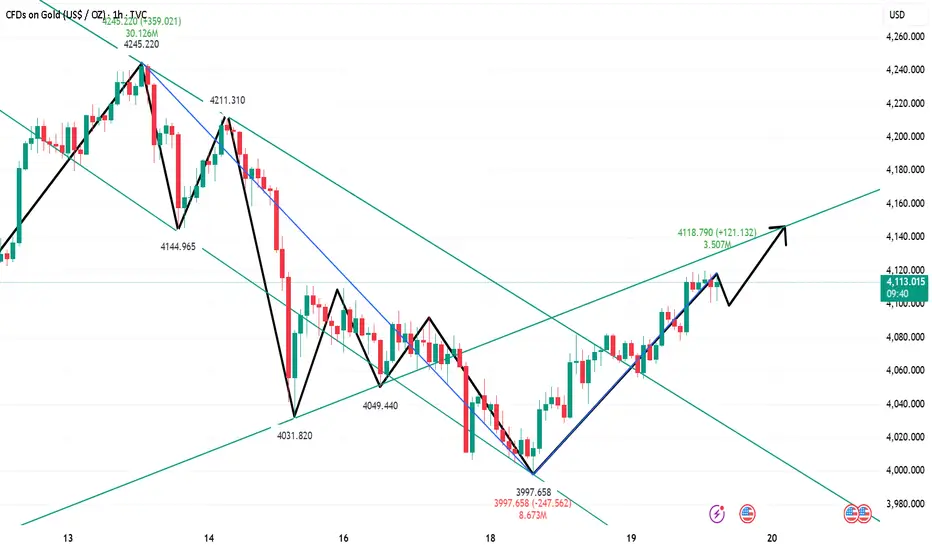
Gold pullback on November 19th: Buy on dips!The 1-hour moving average for gold has turned upwards, indicating continued upward momentum. After breaking through and stabilizing above 4100, gold is currently exhibiting a steady upward trend on the 1-hour chart. The 4090 area has formed short-term support, and buying on dips to this level presents a buying opportunity.
Gold: Buy at 4090, stop-loss at 4078, target 4150-4160;
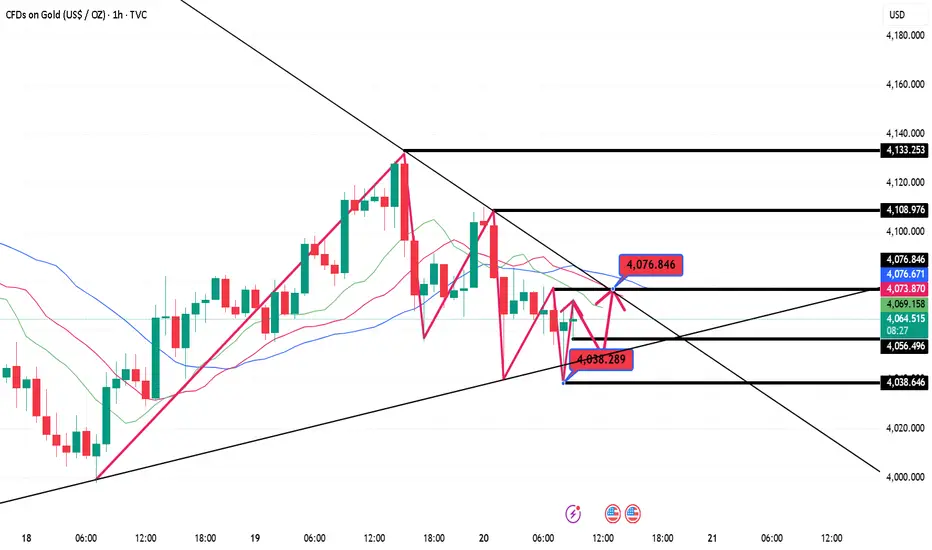
Gold Short-Term Trading Guide (November 18th)!!!The US released some unemployment claims data, and gold briefly broke through 4000 before experiencing a strong rebound. Is this rebound merely a flash in the pan due to the data, or will it help reverse the gold bullish trend?
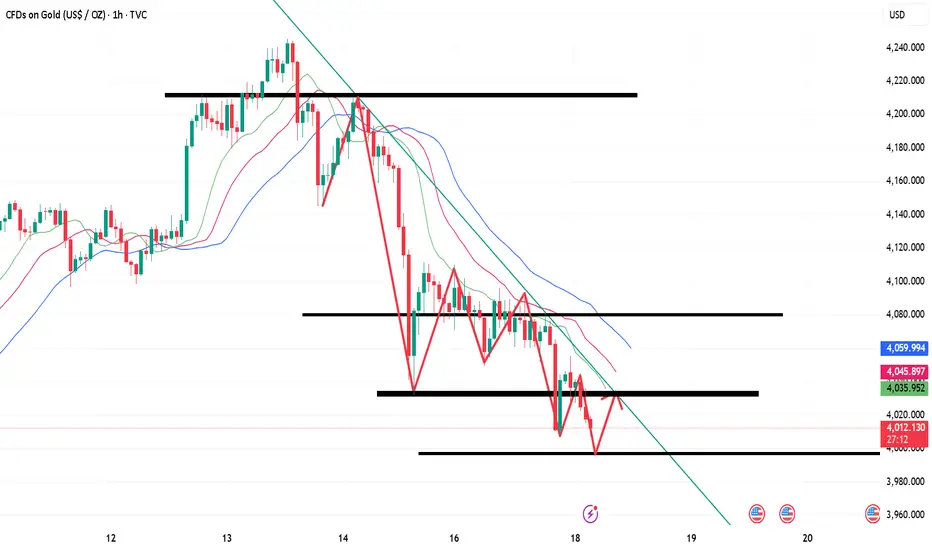
First, we should note that gold is still generally weak. The 1-hour moving averages are still in a bearish crossover, indicating continued downward momentum. Gold is also still trading within a 1-hour downtrend channel. If gold continues to trade within this channel, the overall trend will likely remain one of oscillating decline. The upper resistance level of the 1-hour downtrend channel has now moved down to around 4068. If gold rallies below 4068, the strategy remains to sell on rallies.
Gold prices naturally fluctuate, just like the tides. Volatility creates opportunities. If gold cannot break through the 4068 level, the rebound may be short-lived. Until a break above 4068 is achieved, continue to sell on rallies.
US Session Trading Strategy:
Sell gold at 4060, stop loss at 4070, target 4000-3980;

Gold pullback on November 18th, expect a rebound.Gold prices are trading around 4015. For short positions, watch the 4050 level; a move to short at this level would be a good entry point. This level represents the low point of the initial upward move at the beginning of the week and has now become effective resistance. Hold this area for shorting. The 8-hour uptrend line provides support around 3993. If the price breaks below this uptrend line, the downtrend could accelerate, potentially reaching as low as 3924. Focus on shorting today; hold short positions below 4053 and prepare to maximize profits! Weak outlook! Specific and more winning entry points will be provided during the trading session! Take profits on the short positions!
#Intraday Strategy: Hold short positions below 4050 and maximize profits! Weak outlook!
Focus on the 3995-4005 range, a key support/resistance level!
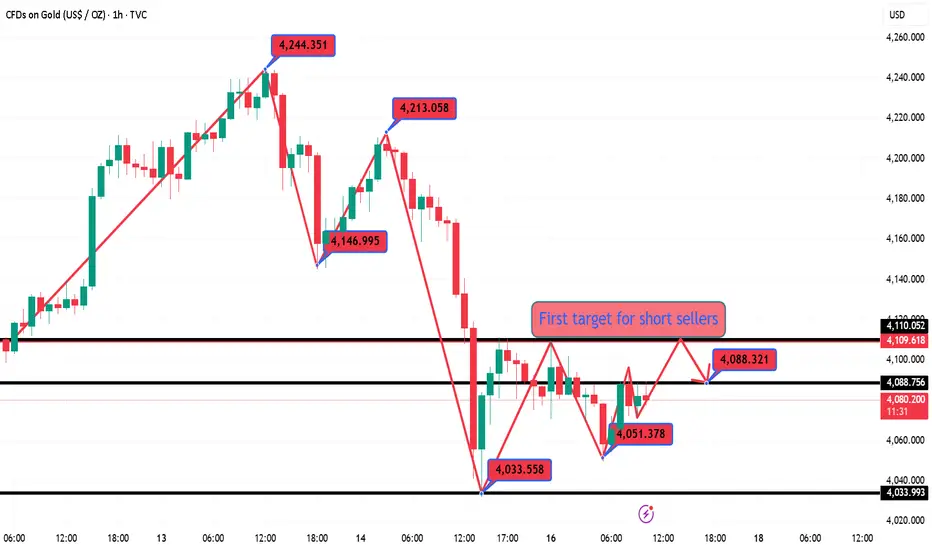
Gold is expected to rise and then fall in the short term.After opening today, gold was pressured down by the 4110 area, finding support at around 4050 and rebounding. The 1-hour and 4-hour charts show severe oversold conditions, indicating a clear short-term stabilization. Therefore, overall, while maintaining a bearish outlook for gold, a short-term rebound is likely, with a high probability of further declines.
Key resistance remains at the 4110 area, followed by the 4140-50 area. A sustained bearish stance is warranted; an unexpected upward breakout could extend the rebound, but a decline is still expected. Key support during the European session is at the 4050 area, with the 4030-40 area being a short-term key level. A break below this level would likely lead to further declines towards the 3980-3950 and 3915 areas.
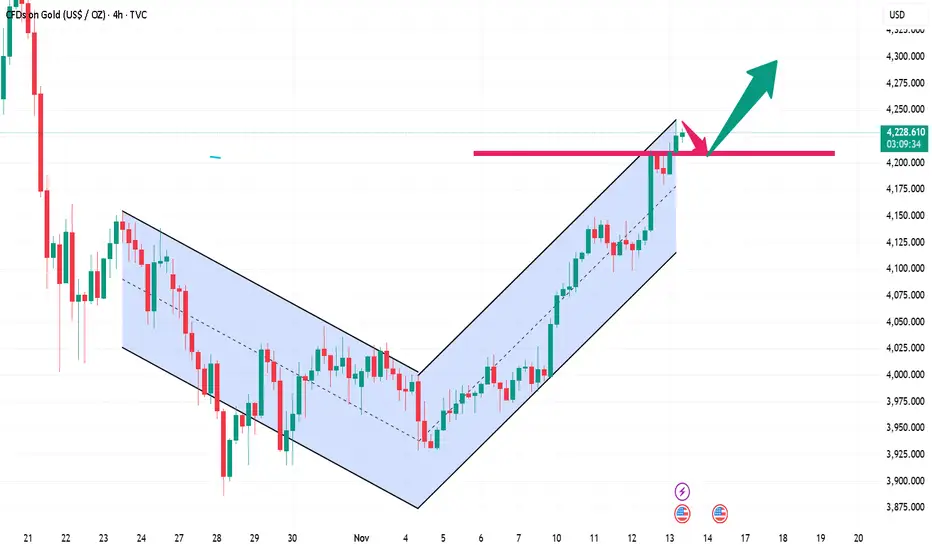
Gold US Session Short-Term Technical Analysis Guide (November 13Gold is currently trending slightly higher on the 4-hour chart, maintaining a slightly bullish bias along the short-term moving averages. The price is currently trading near the previous resistance zone, but there hasn't been much room for a pullback. We should be wary of a potential continuation of the upward trend during the European and American sessions. On the hourly chart, after a second upward move from the highs, it's currently consolidating in a narrow range with insufficient momentum. We should watch for a pullback before a continuation of the upward trend. There's some divergence on the smaller timeframes; we should monitor the short-term correction and recovery.
Gold prices fluctuated at high levels on November 12th; a short-Gold has recently surged, but some uncertainty has led to fluctuations at higher levels. After reaching a high of around 4145 today, it experienced a significant pullback, briefly touching a low of around 4098 before a rapid rebound. This forms a double bottom support level with yesterday's pullback to around 4097 in the US session. The key level to watch in the near term is 4100. A decisive break below this level would indicate further upside potential; otherwise, the bulls may experience further fluctuations. For tonight, consider buying around 4100/4105, and follow the trend after a breakout.
11/12 Gold Short-Term Trading Strategy:
Sell gold around 4138, with a stop-loss at 4146, targeting below 4120/10. If it breaks below 4100, continue selling with a target around 4070. Buy gold on a pullback around 4102/4, with a stop-loss at 4096, targeting above 4120/30.
